|
|
市場調査レポート
商品コード
1224529
アクションフィギュアの市場規模、シェア、動向分析レポート:タイプ別(スーパーヒーロー、アニメキャラクター、映画キャラクター)、最終用途別(8歳まで、9~15歳、15歳以上)、流通チャネル別、地域別、セグメント予測、2023年~2030年Action Figures Market Size, Share & Trends Analysis Report By Type (Superheroes, Anime Characters, Movie Characters), By End-user (Up To 8 Years, 9 - 15 Years, 15 Years & Above), By Distribution Channel, By Region, And Segment Forecasts, 2023 - 2030 |
||||||
|
|
|||||||
|
● お客様のご希望に応じて、既存データの加工や未掲載情報(例:国別セグメント)の追加などの対応が可能です。 詳細はお問い合わせください。 |
|||||||


| アクションフィギュアの市場規模、シェア、動向分析レポート:タイプ別(スーパーヒーロー、アニメキャラクター、映画キャラクター)、最終用途別(8歳まで、9~15歳、15歳以上)、流通チャネル別、地域別、セグメント予測、2023年~2030年 |
|
出版日: 2023年01月06日
発行: Grand View Research
ページ情報: 英文 86 Pages
納期: 2~10営業日
|
- 全表示
- 概要
- 図表
- 目次
アクションフィギュアの市場成長・動向
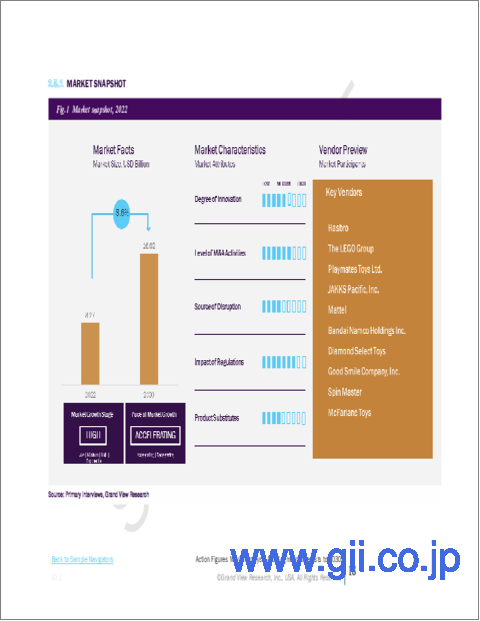
Grand View Research, Inc.の新しいレポートによると、アクションフィギュアの世界市場規模は、2023年から2030年にかけてCAGR8.6%を記録し、2030年までに160億2000万米ドルに達すると予測されています。子供たちがよりインタラクティブで自己関与の高い玩具に傾倒するようになったことが、アクション玩具の需要を促進しています。さらに、映画、コミック、ビデオゲーム、テレビ番組などのキャラクターの人気が高まっていることも、予測期間中に世界中でこの製品の需要を押し上げると予想されます。
世界中で発生したコロナウイルスは、世界経済に大きな影響を与えました。コロナウイルスの連鎖と拡散を断ち切るため、世界中のさまざまな国からロックダウン命令が出されました。パンデミックの影響で親が家で過ごす時間が増えたため、玩具の売上は増加し、2020年の外遊びとともに、ゲームやパズル、人形やアクションフィギュアなどが大きなカテゴリーとなりました。
金額ベースでは、スーパーヒーロー部門が市場を独占し、予測期間中に最大の市場シェアを占めると予想されます。スーパーヒーローの人気が高まっていることは、これらの架空のキャラクターが超自然的な力と非常に強い特性を持ち、子どもたちにアピールしていることを考えると、極めて明白です。さらに、DCやMarvelの素晴らしい映画やシリーズが数多く公開された後、これらのスーパーヒーローの受け入れが増加しており、これが市場成長の推進力になると予想されます。
オンライン流通チャネルは、予測期間中、最も速いCAGRで成長すると推定されます。オンラインチャネルの成長は、インターネット接続の改善や、ブラックフライデーやサイバーマンデーといったオンラインショッピングイベントの出現といった要因に起因しています。さらに、オンラインショッピングは、そのアクセスのしやすさと利便性により、消費者にとってより魅力的なものとなっています。お客様はご自宅にいながらにして買い物をすることができます。また、様々な配送方法を選択することができ、より専門的なショッピングを体験することができます。このことは、予測期間中の市場成長を促進するものと期待できます。
2021年の市場シェアは、北米が最大でした。子供たちの間でアクション玩具が受け入れられつつあるのは、マーベルやDCのコミックブックやシリーズのキャラクターの人気に大きく影響されています。アクション玩具のメーカーはこの機会を活用し、特にそのような要件を満たす製品を提供しています。さらに、アクショントイにおける主要プレイヤーの存在が、北米の市場成長を牽引する主要因になると予想されます。
この業界の企業は、市場シェアとサービス提供地域を拡大するために、成長、合併、買収などの戦術に集中しています。レゴグループは、2022年6月にバージニア州チェスターフィールド郡に10億米ドル以上を投じて新施設を建てる計画を発表しました。
アクションフィギュア市場レポートハイライト
アニメキャラクター分野は、2023年から2030年までのCAGRが9.4%となり、予測期間中に大幅な成長が見込まれます。先進国および発展途上国におけるコミックブックの人気の高まりが、アニメキャラクターのアクションフィギュアの需要を促進している
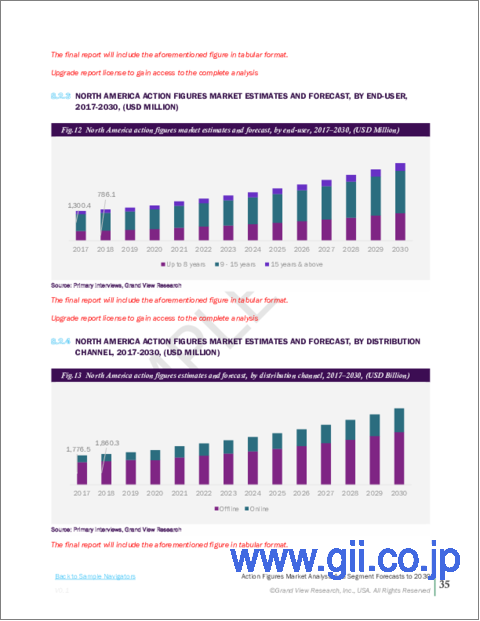
9-15歳のエンドユーザーセグメントは、2022年に46億1,680万米ドルとなり、2030年には87億2,620万米ドルに達すると予想されます。9~15歳の子どもたちの間でスーパーヒーローフィギュアへの需要が急速に高まっていることが、市場成長を加速させている
アジア太平洋地域は、2022年に18億9,480万米ドルとなり、予測期間中に9.7%のCAGRを記録すると予想されています。この地域の成長は、主にインドや中国などの新興経済諸国における玩具の需要増に起因するものである
目次
第1章 調査手法と範囲
- 市場セグメンテーションと範囲
- 市場の定義
- 情報調達
- 購入したデータベース
- GVRの内部データベース
- 二次情報と第三者の視点
- 1次調査
- 情報分析
- データ分析モデル
- 市場形成とデータ可視化
- データの検証と公開
第2章 エグゼクティブサマリー
- 市場の見通し
- タイプ Outlook
- エンドユーザーの見通し
- 流通経路の見通し
- 地域の見通し
第3章 アクションフィギュアの市場変数、動向、範囲
- 市場イントロダクション
- 浸透と成長の見通しのマッピング
- 業界バリューチェーン分析
- 販売・小売チャネル分析
- 利益率分析
- 市場力学
- 市場促進要因分析
- 市場抑制要因分析
- 業界の課題
- 業界の機会
- 事業環境分析
- 業界分析- ポーターズ
- サプライヤーの力
- 買い手の交渉力
- 代替の脅威
- 新規参入者からの脅威
- 競争企業間の敵対関係
- 業界分析- ポーターズ
- アクションフィギュア市場のロードマップ
- 市場参入戦略
- アクションフィギュア市場に対するCOVID-19の影響
第4章 消費者行動分析
- 人口統計分析
- 消費者の動向と好み
- 購入決定に影響を与える要因
- 消費者タイプの採用
- 所見と推奨事項
第5章 アクションフィギュア市場:タイプ推定・動向分析
- タイプの変動分析と市場シェア、2021年と2030年
- スーパーヒーロー
- アニメキャラクター
- 映画のキャラクター
- その他
第6章 アクションフィギュア市場:エンドユーザーの推定・動向分析
- エンドユーザーの変動分析と市場シェア、2021年と2030年
- 8歳未満
- 9~15歳
- 15歳以上
第7章 アクションフィギュア市場:流通チャネルの推定・動向分析
- 流通チャネルの変動分析と市場シェア、2021年と2030年
- オフライン
- オンライン
第8章 アクションフィギュア市場:地域推定・動向分析
- 地域変動分析と市場シェア、2021年と2030年
- 北米
- 米国
- カナダ
- 欧州
- 英国
- ドイツ
- フランス
- アジア太平洋地域
- 中国
- 日本
- インド
- 中南米
- ブラジル
- 中東およびアフリカ
- 南アフリカ
第9章 競合分析
- 主要な世界プレーヤー、最近の動向、業界への影響
- 主要企業/競合の分類(主要なイノベーター、市場リーダー、新興企業)
- ベンダー情勢
- 主要企業の市場シェア分析、2022年
第10章 企業プロファイル
- Hasbro
- 会社概要
- 財務実績
- タイプのベンチマーク
- 戦略的イニシアチブ
- The LEGO Group.
- 会社概要
- 財務実績
- タイプのベンチマーク
- 戦略的イニシアチブ
- Playmates Toys Ltd.
- 会社概要
- 財務実績
- タイプのベンチマーク
- 戦略的イニシアチブ
- JAKKS Pacific, Inc.
- 会社概要
- 財務実績
- タイプのベンチマーク
- 戦略的イニシアチブ
- Mattel
- 会社概要
- 財務実績
- タイプのベンチマーク
- 戦略的イニシアチブ
- Bandai Namco Holdings Inc.
- 会社概要
- 財務実績
- タイプのベンチマーク
- 戦略的イニシアチブ
- Diamond Select Toys
- 会社概要
- 財務実績
- タイプのベンチマーク
- 戦略的イニシアチブ
- Good Smile Company, Inc.
- 会社概要
- 財務実績
- タイプのベンチマーク
- 戦略的イニシアチブ
- Spin Master
- 会社概要
- 財務実績
- タイプのベンチマーク
- 戦略的イニシアチブ
- McFarlane Toys
- 会社概要
- 財務実績
- タイプのベンチマーク
- 戦略的イニシアチブ
List of Tables
- 1. Action Figures market - Driving factor market analysis
- 2. Action Figures market - Restraint factor market analysis
- 3. Global action figures market estimates and forecast, for superheroes, 2017 - 2030 (USD Million)
- 4. Global action figures market estimates and forecast, for anime characters, 2017 - 2030 (USD Million)
- 5. Global action figures market estimates and forecast, for movie characters, 2017 - 2030 (USD Million)
- 6. Global action figures market estimates and forecast, for others, 2017 - 2030 (USD Million)
- 7. Global action figures market estimates and forecast, for up to 8 years, 2017 - 2030 (USD Million)
- 8. Global action figures market estimates and forecast, for 9 - 15 years, 2017 - 2030 (USD Million)
- 9. Global action figures market estimates and forecast, for 15 years & above, 2017 - 2030 (USD Million)
- 10. Global action figures market estimates and forecast, by offline, 2017 - 2030 (USD Million)
- 11. Global action figures market estimates and forecast, by online, 2017 - 2030 (USD Million)
- 12. North America action figures market estimates and forecast, 2017 - 2030 (USD Million)
- 13. North America action figures market estimates and forecast, by type, 2017 - 2030 (USD Million)
- 14. North America action figures market estimates and forecast, by end-user, 2017 - 2030 (USD Million)
- 15. North America action figures market estimates and forecast, by distribution channel, 2017 - 2030 (USD Million)
- 16. U.S. action figures market estimates and forecast, 2017 - 2030 (USD Million)
- 17. U.S. action figures market estimates and forecast, by type, 2017 - 2030 (USD Million)
- 18. U.S. action figures market estimates and forecast, by end-user, 2017 - 2030 (USD Million)
- 19. U.S. action figures market estimates and forecast, by distribution channel, 2017 - 2030 (USD Million)
- 20. Canada action figures market estimates and forecast, 2017 - 2030 (USD Million)
- 21. Canada action figures market estimates and forecast, by type, 2017 - 2030 (USD Million)
- 22. Canada action figures market estimates and forecast, by end-user, 2017 - 2030 (USD Million)
- 23. Canada action figures market estimates and forecast, by distribution channel, 2017 - 2030 (USD Million)
- 24. Europe action figures market estimates and forecast, 2017 - 2030 (USD Million)
- 25. Europe action figures market estimates and forecast, by type, 2017 - 2030 (USD Million)
- 26. Europe action figures market estimates and forecast, by end-user, 2017 - 2030 (USD Million)
- 27. Europe action figures market estimates and forecast, by distribution channel, 2017 - 2030 (USD Million)
- 28. U.K. action figures market estimates and forecast, 2017 - 2030 (USD Million)
- 29. U.K. action figures market estimates and forecast, by type, 2017 - 2030 (USD Million)
- 30. U.K. action figures market estimates and forecast, by end-user, 2017 - 2030 (USD Million)
- 31. U.K. action figures market estimates and forecast, by distribution channel, 2017 - 2030 (USD Million)
- 32. Germany action figures market estimates and forecast, 2017 - 2030 (USD Million)
- 33. Germany action figures market estimates and forecast, by type, 2017 - 2030 (USD Million)
- 34. Germany action figures market estimates and forecast, by end-user, 2017 - 2030 (USD Million)
- 35. Germany action figures market estimates and forecast, by distribution channel, 2017 - 2030 (USD Million)
- 36. France action figures market estimates and forecast, 2017 - 2030 (USD Million)
- 37. France action figures market estimates and forecast, by type, 2017 - 2030 (USD Million)
- 38. France action figures market estimates and forecast, by end-user, 2017 - 2030 (USD Million)
- 39. France action figures market estimates and forecast, by distribution channel, 2017 - 2030 (USD Million)
- 40. Asia Pacific action figures market estimates and forecast, 2017 - 2030 (USD Million)
- 41. Asia Pacific action figures market estimates and forecast, by type, 2017 - 2030 (USD Million)
- 42. Asia Pacific action figures market estimates and forecast, by end-user, 2017 - 2030 (USD Million)
- 43. Asia Pacific action figures market estimates and forecast, by distribution channel, 2017 - 2030 (USD Million)
- 44. China action figures market estimates and forecast, 2017 - 2030 (USD Million)
- 45. China action figures market estimates and forecast, by type, 2017 - 2030 (USD Million)
- 46. China action figures market estimates and forecast, by end-user, 2017 - 2030 (USD Million)
- 47. China action figures market estimates and forecast, by distribution channel, 2017 - 2030 (USD Million)
- 48. Japan action figures market estimates and forecast, 2017 - 2030 (USD Million)
- 49. Japan action figures market estimates and forecast, by type, 2017 - 2030 (USD Million)
- 50. Japan action figures market estimates and forecast, by end-user, 2017 - 2030 (USD Million)
- 51. Japan action figures market estimates and forecast, by distribution channel, 2017 - 2030 (USD Million)
- 52. India action figures market estimates and forecast, 2017 - 2030 (USD Million)
- 53. India action figures market estimates and forecast, by type, 2017 - 2030 (USD Million)
- 54. India action figures market estimates and forecast, by end-user, 2017 - 2030 (USD Million)
- 55. India action figures market estimates and forecast, by distribution channel, 2017 - 2030 (USD Million)
- 56. Central & South America action figures market estimates and forecast, 2017 - 2030 (USD Million)
- 57. Central & South America action figures market estimates and forecast, by type, 2017 - 2030 (USD Million)
- 58. Central & South America action figures market estimates and forecast, by end-user, 2017 - 2030 (USD Million)
- 59. Central & South America action figures market estimates and forecast, by distribution channel, 2017 - 2030 (USD Million)
- 60. Brazil action figures market estimates and forecast, 2017 - 2030 (USD Million)
- 61. Brazil action figures market estimates and forecast, by type, 2017 - 2030 (USD Million)
- 62. Brazil action figures market estimates and forecast, by end-user, 2017 - 2030 (USD Million)
- 63. Brazil action figures market estimates and forecast, by distribution channel, 2017 - 2030 (USD Million)
- 64. Middle East & Africa action figures market estimates and forecast, 2017 - 2030 (USD Million)
- 65. Middle East & Africa action figures market estimates and forecast, by type, 2017 - 2030 (USD Million)
- 66. Middle East & Africa action figures market estimates and forecast, by end-user, 2017 - 2030 (USD Million)
- 67. Middle East & Africa action figures market estimates and forecast, by distribution channel, 2017 - 2030 (USD Million)
- 68. South Africa action figures market estimates and forecast, 2017 - 2030 (USD Million)
- 69. South Africa action figures market estimates and forecast, by type, 2017 - 2030 (USD Million)
- 70. South Africa action figures market estimates and forecast, by end-user, 2017 - 2030 (USD Million)
- 71. South Africa action figures market estimates and forecast, by distribution channel, 2017 - 2030 (USD Million)
- 72. Company categorization
List of Figures
- 1. Action Figures market segmentation
- 2. Information procurement
- 3. Primary research pattern
- 4. Primary research approaches
- 5. Primary research process
- 6. Action Figures market - Penetration & growth prospect mapping, by type
- 7. Action Figures market - Value chain analysis
- 8. Action Figures market: Porter's Five Forces Analysis
- 9. Action Figures market: Roadmap
- 10. Action Figures market: Type revenue share (%) analysis, 2023 & 2030
- 11. Action Figures market: End-user revenue share (%) analysis, 2023 & 2030
- 12. Action Figures market: Distribution Channel revenue share (%) analysis, 2023 & 2030
- 13. Action Figures market: Regional share (%) analysis, 2023 & 2030
- 14. Action Figures market: Estimated company market share (%) analysis, 2022
Action Figures Market Growth & Trends:
The global action figures market size is expected to reach USD 16.02 billion by 2030, registering a CAGR of 8.6% from 2023 to 2030, according to a new report by Grand View Research, Inc. The increasing inclination of children towards more interactive and self-engaging toys has fueled the demand for action toys. Moreover, the increasing popularity of some characters from films, comic book, video games, or television programs is expected to boost the demand for the product across the globe during the forecast period.
The outbreak of coronavirus around the world badly affected the global economy. In order to break the chain and spread of coronavirus, lockdown orders were imposed by various countries across the globe. As the pandemic took hold and parents were spending more time at home, toy sales were up and the big categories were games and puzzles, dolls and action figures, along with outdoor play in 2020.
In terms of value, the superheroes segment dominated the market and is expected to account for the largest market share during the forecast period. The increasing popularity of superheroes is quite obvious, considering that these fictional characters hold supernatural powers and extremely strong characteristics that appeal to children. Moreover, the acceptance of these superheroes has increased after the release of a number of amazing DC and Marvel movies and series, which is expected to propel the market growth.
The online distribution channel segment is estimated to grow with the fastest CAGR during the forecast period. The growth of online channels can be attributed to factors such as improved internet connectivity and the advent of online shopping events, such as Black Friday and Cyber Monday. Moreover, online buying is made more appealing to consumers by its accessibility and convenience. Customers can shop from the convenience of their own homes. They can select from a variety of delivery alternatives and get a more specialized shopping experience. This can be expected to propel the market growth during the forecast period.
North America held the largest market share in 2021. The growing acceptance of action toys among kids has been significantly influenced by the popularity of Marvel and DC comic books and series characters. Manufacturers of action toys have been utilizing this opportunity and offering products to specifically meet such requirements. Moreover, the presence of the key players in action toys is expected to be the major factor driving the market growth in North America.
Companies in the industry are concentrating on the tactics like growth, mergers, and acquisitions in order to improve their market share and service footprint. The LEGO Group announced plans to spend more than $1.0 billion to erect a new facility in Chesterfield County, Virginia, in June 2022.
Action Figures Market Report Highlights:
- The anime characters segment is expected to witness substantial growth during the forecast period with a CAGR of 9.4% from 2023 to 2030. The increasing popularity of comic books in developed and developing nations is propelling demand for action figures of anime characters
- The 9 - 15 year end-user segment was valued at USD 4,616.8 million in 2022 and is expected to reach USD 8,726.2 million by 2030. The rapidly growing demand for superhero figures among the 9 to 15 years age group children is accelerating the market growth
- The Asia Pacific market was valued a USD 1,894.8 million in 2022 and is expected to register a CAGR of 9.7% during the forecast period. The growth in the region is majorly attributed to the increasing demand for toys in developing economies such as India and China
Table of Contents
Chapter 1. Methodology and Scope
- 1.1. Market Segmentation & Scope
- 1.2. Market Definition
- 1.3. Information Procurement
- 1.3.1. Purchased Database
- 1.3.2. GVR's Internal Database
- 1.3.3. Secondary Sources & Third-Party Perspectives
- 1.3.4. Primary Research
- 1.4. Information Analysis
- 1.4.1. Data Analysis Models
- 1.5. Market Formulation & Data Visualization
- 1.6. Data Validation & Publishing
Chapter 2. Executive Summary
- 2.1. Market Outlook
- 2.2. Type Outlook
- 2.3. End-user Outlook
- 2.4. Distribution Channel Outlook
- 2.5. Regional Outlook
Chapter 3. Action Figures Market Variables, Trends & Scope
- 3.1. Market Introduction
- 3.2. Penetration & Growth Prospect Mapping
- 3.3. Industry Value Chain Analysis
- 3.3.1. Sales/Retail Channel Analysis
- 3.3.2. Profit Margin Analysis
- 3.4. Market Dynamics
- 3.4.1. Market Driver Analysis
- 3.4.2. Market Restraint Analysis
- 3.4.3. Industry Challenges
- 3.4.4. Industry Opportunities
- 3.5. Business Environment Analysis
- 3.5.1. Industry Analysis - Porter's
- 3.5.1.1. Supplier Power
- 3.5.1.2. Buyer Power
- 3.5.1.3. Substitution Threat
- 3.5.1.4. Threat from New Entrant
- 3.5.1.5. Competitive Rivalry
- 3.5.1. Industry Analysis - Porter's
- 3.6. Roadmap of Action Figures Market
- 3.7. Market Entry Strategies
- 3.8. Impact of COVID-19 on Action Figures Market
Chapter 4. Consumer Behavior Analysis
- 4.1. Demographic Analysis
- 4.2. Consumer Trends and Preferences
- 4.3. Factors Affecting Buying Decision
- 4.4. Consumer Type Adoption
- 4.5. Observations & Recommendations
Chapter 5. Action Figures Market: Type Estimates & Trend Analysis
- 5.1. Type Movement Analysis & Market Share, 2021 & 2030
- 5.2. Superheroes
- 5.2.1. Market estimates and forecast, 2017 - 2030 (USD Million)
- 5.3. Anime Characters
- 5.3.1. Market estimates and forecast, 2017 - 2030 (USD Million)
- 5.4. Movie Characters
- 5.4.1. Market estimates and forecast, 2017 - 2030 (USD Million)
- 5.5. Others
- 5.5.1. Market estimates and forecast, 2017 - 2030 (USD Million)
Chapter 6. Action Figures Market: End-user Estimates & Trend Analysis
- 6.1. End-user Movement Analysis & Market Share, 2021 & 2030
- 6.2. Up to 8 years
- 6.2.1. Market estimates and forecast, 2017 - 2030 (USD Million)
- 6.3. 9 - 15 years
- 6.3.1. Market estimates and forecast, 2017 - 2030 (USD Million)
- 6.4. 15 years & above
- 6.4.1. Market estimates and forecast, 2017 - 2030 (USD Million)
Chapter 7. Action Figures Market: Distribution Channel Estimates & Trend Analysis
- 7.1. Distribution Channel Movement Analysis & Market Share, 2021 & 2030
- 7.2. Offline
- 7.2.1. Market estimates and forecast, 2017 - 2030 (USD Million)
- 7.3. Online
- 7.3.1. Market estimates and forecast, 2017 - 2030 (USD Million)
Chapter 8. Action Figures Market: Regional Estimates & Trend Analysis
- 8.1. Regional Movement Analysis & Market Share, 2021 & 2030
- 8.2. North America
- 8.2.1. Market estimates and forecast, 2017 - 2030 (USD Million)
- 8.2.2. Market estimates and forecast, by type, 2017 - 2030 (USD Million)
- 8.2.3. Market estimates and forecast, by end-user, 2017 - 2030 (USD Million)
- 8.2.4. Market estimates and forecast, by distribution channel, 2017 - 2030 (USD Million)
- 8.2.5. The U.S.
- 8.2.5.1. Market estimates and forecast, 2017 - 2030 (USD Million)
- 8.2.5.2. Market estimates and forecast, by type, 2017 - 2030 (USD Million)
- 8.2.5.3. Market estimates and forecast, by end-user, 2017 - 2030 (USD Million)
- 8.2.5.4. Market estimates and forecast, by distribution channel, 2017 - 2030 (USD Million)
- 8.2.6. Canada
- 8.2.6.1. Market estimates and forecast, 2017 - 2030 (USD Million)
- 8.2.6.2. Market estimates and forecast, by type, 2017 - 2030 (USD Million)
- 8.2.6.3. Market estimates and forecast, by end-user, 2017 - 2030 (USD Million)
- 8.2.6.4. Market estimates and forecast, by distribution channel, 2017 - 2030 (USD Million)
- 8.3. Europe
- 8.3.1. Market estimates and forecast, 2017 - 2030 (USD Million)
- 8.3.2. Market estimates and forecast, by type, 2017 - 2030 (USD Million)
- 8.3.3. Market estimates and forecast, by end-user, 2017 - 2030 (USD Million)
- 8.3.4. Market estimates and forecast, by distribution channel, 2017 - 2030 (USD Million)
- 8.3.5. The U.K.
- 8.3.5.1. Market estimates and forecast, 2017 - 2030 (USD Million)
- 8.3.5.2. Market estimates and forecast, by type, 2017 - 2030 (USD Million)
- 8.3.5.3. Market estimates and forecast, by end-user, 2017 - 2030 (USD Million)
- 8.3.5.4. Market estimates and forecast, by distribution channel, 2017 - 2030 (USD Million)
- 8.3.6. Germany
- 8.3.6.1. Market estimates and forecast, 2017 - 2030 (USD Million)
- 8.3.6.2. Market estimates and forecast, by type, 2017 - 2030 (USD Million)
- 8.3.6.3. Market estimates and forecast, by end-user, 2017 - 2030 (USD Million)
- 8.3.6.4. Market estimates and forecast, by distribution channel, 2017 - 2030 (USD Million)
- 8.3.7. France
- 8.3.7.1. Market estimates and forecast, 2017 - 2030 (USD Million)
- 8.3.7.2. Market estimates and forecast, by type, 2017 - 2030 (USD Million)
- 8.3.7.3. Market estimates and forecast, by end-user, 2017 - 2030 (USD Million)
- 8.3.7.4. Market estimates and forecast, by distribution channel, 2017 - 2030 (USD Million)
- 8.4. Asia Pacific
- 8.4.1. Market estimates and forecast, 2017 - 2030 (USD Million)
- 8.4.2. Market estimates and forecast, by type, 2017 - 2030 (USD Million)
- 8.4.3. Market estimates and forecast, by end-user, 2017 - 2030 (USD Million)
- 8.4.4. Market estimates and forecast, by distribution channel, 2017 - 2030 (USD Million)
- 8.4.5. China
- 8.4.5.1. Market estimates and forecast, 2017 - 2030 (USD Million)
- 8.4.5.2. Market estimates and forecast, by type, 2017 - 2030 (USD Million)
- 8.4.5.3. Market estimates and forecast, by end-user, 2017 - 2030 (USD Million)
- 8.4.5.4. Market estimates and forecast, by distribution channel, 2017 - 2030 (USD Million)
- 8.4.6. Japan
- 8.4.6.1. Market estimates and forecast, 2017 - 2030 (USD Million)
- 8.4.6.2. Market estimates and forecast, by type, 2017 - 2030 (USD Million)
- 8.4.6.3. Market estimates and forecast, by end-user, 2017 - 2030 (USD Million)
- 8.4.6.4. Market estimates and forecast, by distribution channel, 2017 - 2030 (USD Million)
- 8.4.7. India
- 8.4.7.1. Market estimates and forecast, 2017 - 2030 (USD Million)
- 8.4.7.2. Market estimates and forecast, by type, 2017 - 2030 (USD Million)
- 8.4.7.3. Market estimates and forecast, by end-user, 2017 - 2030 (USD Million)
- 8.4.7.4. Market estimates and forecast, by distribution channel, 2017 - 2030 (USD Million)
- 8.5. Central & South America
- 8.5.1. Market estimates and forecast, 2017 - 2030 (USD Million)
- 8.5.2. Market estimates and forecast, by type, 2017 - 2030 (USD Million)
- 8.5.3. Market estimates and forecast, by end-user, 2017 - 2030 (USD Million)
- 8.5.4. Market estimates and forecast, by distribution channel, 2017 - 2030 (USD Million)
- 8.5.5. Brazil
- 8.5.5.1. Market estimates and forecast, 2017 - 2030 (USD Million)
- 8.5.5.2. Market estimates and forecast, by type, 2017 - 2030 (USD Million)
- 8.5.5.3. Market estimates and forecast, by end-user, 2017 - 2030 (USD Million)
- 8.5.5.4. Market estimates and forecast, by distribution channel, 2017 - 2030 (USD Million)
- 8.6. Middles East & Africa
- 8.6.1. Market estimates and forecast, 2017 - 2030 (USD Million)
- 8.6.2. Market estimates and forecast, by type, 2017 - 2030 (USD Million)
- 8.6.3. Market estimates and forecast, by end-user, 2017 - 2030 (USD Million)
- 8.6.4. Market estimates and forecast, by distribution channel, 2017 - 2030 (USD Million)
- 8.6.5. South Africa
- 8.6.5.1. Market estimates and forecast, 2017 - 2030 (USD Million)
- 8.6.5.2. Market estimates and forecast, by type, 2017 - 2030 (USD Million)
- 8.6.5.3. Market estimates and forecast, by end-user, 2017 - 2030 (USD Million)
- 8.6.5.4. Market estimates and forecast, by distribution channel, 2017 - 2030 (USD Million)
Chapter 9. Competitive Analysis
- 9.1. Key global players, recent developments & their impact on the industry
- 9.2. Key Company/Competition Categorization (Key innovators, Market leaders, Emerging players)
- 9.3. Vendor Landscape
- 9.3.1. Key company market share analysis, 2022
Chapter 10. Company Profiles
- 10.1. Hasbro
- 10.1.1. Company Overview
- 10.1.2. Financial Performance
- 10.1.3. Type Benchmarking
- 10.1.4. Strategic Initiatives
- 10.2. The LEGO Group.
- 10.2.1. Company Overview
- 10.2.2. Financial Performance
- 10.2.3. Type Benchmarking
- 10.2.4. Strategic Initiatives
- 10.3. Playmates Toys Ltd.
- 10.3.1. Company Overview
- 10.3.2. Financial Performance
- 10.3.3. Type Benchmarking
- 10.3.4. Strategic Initiatives
- 10.4. JAKKS Pacific, Inc.
- 10.4.1. Company Overview
- 10.4.2. Financial Performance
- 10.4.3. Type Benchmarking
- 10.4.4. Strategic Initiatives
- 10.5. Mattel
- 10.5.1. Company Overview
- 10.5.2. Financial Performance
- 10.5.3. Type Benchmarking
- 10.5.4. Strategic Initiatives
- 10.6. Bandai Namco Holdings Inc.
- 10.6.1. Company Overview
- 10.6.2. Financial Performance
- 10.6.3. Type Benchmarking
- 10.6.4. Strategic Initiatives
- 10.7. Diamond Select Toys
- 10.7.1. Company Overview
- 10.7.2. Financial Performance
- 10.7.3. Type Benchmarking
- 10.7.4. Strategic Initiatives
- 10.8. Good Smile Company, Inc.
- 10.8.1. Company Overview
- 10.8.2. Financial Performance
- 10.8.3. Type Benchmarking
- 10.8.4. Strategic Initiatives
- 10.9. Spin Master
- 10.9.1. Company Overview
- 10.9.2. Financial Performance
- 10.9.3. Type Benchmarking
- 10.9.4. Strategic Initiatives
- 10.10. McFarlane Toys
- 10.10.1. Company Overview
- 10.10.2. Financial Performance
- 10.10.3. Type Benchmarking
- 10.10.4. Strategic Initiatives