|
|
市場調査レポート
商品コード
1041278
世界と日本のPVCフィギュア市場:考察と予測 (2027年まで)Global and Japan PVC Figures Market Insights, Forecast to 2027 |
||||||
|
|
|||||||
|
● お客様のご希望に応じて、既存データの加工や未掲載情報(例:国別セグメント)の追加などの対応が可能です。 詳細はお問い合わせください。 |
|||||||


| 世界と日本のPVCフィギュア市場:考察と予測 (2027年まで) |
|
出版日: 2022年05月07日
発行: QYResearch
ページ情報: 英文 141 Pages
納期: 2~3営業日
|
- 全表示
- 概要
- 図表
- 目次
当レポートは、PVCフィギュア (PVC Figures) 市場について調査しており、市場規模や予測、動向、成長要因および課題、タイプ・用途・企業・地域別の市場分析、競合情勢、主要企業のプロファイルなどの情報を提供しています。
目次
第1章 調査対象
- フィギュアの製品概要
- 市場:タイプ別
- 世界のPVCフィギュアの市場規模成長率:タイプ別
- Anime Figures
- Movie Figures
- Other
- 市場:アプリケーション別
- 世界のPVCフィギュアの市場規模成長率:アプリケーション別
- Online Store
- Offline Store
- 調査目的
- 対象期間
第2章 レポート概要
- 世界のPVCフィギュア 市場規模, 推定および予測
- 世界のPVCフィギュアの収益 2016-2027
- 世界のPVCフィギュアの販売 2016-2027
- 世界のPVCフィギュア, 市場規模:地域別: 2016 VS 2021 VS 2027
- PVCフィギュアの市場規模推移:地域別 (2016-2021)
- 世界のPVCフィギュアの過去の市場シナリオ(販売):地域別: 2016-2021
- 世界のPVCフィギュアの過去の市場シナリオ(収益):地域別: 2016-2021
- PVC フィギュアの市場 推定および予測:地域別 (2022-2027)
- 世界のPVCフィギュアの販売予測:地域別 (2022-2027)
- 世界のPVCフィギュアの収益予測:地域別 (2022-2027)
第3章 世界のPVCフィギュアの競合状況:プレーヤー別
- 世界のPVCフィギュアの上位メーカー:販売別
- 世界のPVCフィギュアの販売:メーカー別 (2016-2021)
- 世界のPVCフィギュアの販売市場シェア:メーカー別 (2016-2021)
- 世界のPVCフィギュアの上位メーカー:収益別
- 主要なPVCフィギュア メーカー:収益別ランキング
- 世界のPVCフィギュアの収益:メーカー別 (2016-2021)
- 世界のPVCフィギュアの収益シェア:メーカー別 (2016-2021)
- 世界のPVCフィギュア 市場集中度 (CR5 and HHI) (2016-2021)
- 世界の上位10・上位5企業: フィギュアの収益 2020
- 世界のPVCフィギュアの市場シェア:企業タイプ別 (Tier 1, Tier 2 and Tier 3)
- 世界のPVCフィギュアの販売価格:メーカー別
- 世界のPVCフィギュアの製造拠点分布, 製品タイプ
- PVCフィギュアのメーカーの製造拠点分布, 本社
- メーカーのPVCフィギュアの製品タイプ
- メーカーの市場参入時期: PVCフィギュア 市場
- メーカーのM&A, 拡張計画
第4章 内訳データ:タイプ別 (2016-2027)
- 世界のPVCフィギュア 市場規模:タイプ別 (2016-2021)
- 世界のPVCフィギュアの販売:タイプ別 (2016-2021)
- 世界のPVCフィギュアの収益:タイプ別 (2016-2021)
- PVCフィギュアの平均販売価格:タイプ別 (2016-2021)
- 世界のフィギュアの市場規模予測:タイプ別 (2022-2027)
- 世界のフィギュアの販売予測:タイプ別 (2022-2027)
- 世界のフィギュアの収益予測:タイプ別 (2022-2027)
- フィギュアの平均販売価格予測:タイプ別 (2022-2027)
第5章 内訳データ:アプリケーション別 (2016-2027)
- 世界のフィギュア 市場規模:アプリケーション別 (2016-2021)
- 世界のPVCフィギュアの販売:アプリケーション別 (2016-2021)
- 世界のPVCフィギュアの収益:アプリケーション別 (2016-2021)
- PVCフィギュアの価格:アプリケーション別 (2016-2021)
- PVCフィギュアの市場規模予測:アプリケーション別 (2022-2027)
- 世界のPVCフィギュアの販売予測:アプリケーション別 (2022-2027)
- 世界のPVCフィギュアの収益予測:アプリケーション別 (2022-2027)
- 世界のPVCフィギュアの価格予測:アプリケーション別 (2022-2027)
第6章 日本のプレーヤー, タイプおよびアプリケーション別
- 日本のPVCフィギュアの市場規模:対前年成長率 2016-2027
- 日本のPVCフィギュアの販売:対前年成長率 2016-2027
- 日本のPVCフィギュアの収益:対前年成長率 2016-2027
- 日本のPVCフィギュア グローバル市場における市場シェア 2016-2027
- 日本のPVCフィギュアの市場規模:プレーヤー別(海外および国内)
- 日本のPVCフィギュアの上位プレーヤー:販売別 (2016-2021)
- 日本のPVCフィギュアの上位プレーヤー:収益別 (2016-2021)
- 日本のPVCフィギュアの過去の市場概要:タイプ別 (2016-2021)
- 日本のPVCフィギュアの販売市場シェア:タイプ別 (2016-2021)
- 日本のPVCフィギュアの収益市場シェア:タイプ別 (2016-2021)
- 日本のPVCフィギュアの価格:タイプ別 (2016-2021)
- 日本のPVCフィギュアの市場 推定および予測:タイプ別 (2022-2027)
- 日本のPVCフィギュアの販売予測:タイプ別 (2022-2027)
- 日本のPVCフィギュアの収益予測:タイプ別 (2022-2027)
- 日本のPVCフィギュアの価格予測:タイプ別 (2022-2027)
- 日本のPVCフィギュアの過去の市場概要:アプリケーション別 (2016-2021)
- 日本のPVCフィギュアの販売市場シェア:アプリケーション別 (2016-2021)
- 日本のPVCフィギュアの収益市場シェア:アプリケーション別 (2016-2021)
- 日本のPVCフィギュアの価格:アプリケーション別 (2016-2021)
- 日本のPVCフィギュアの市場 推定および予測:アプリケーション別 (2022-2027)
- 日本のPVCフィギュアの販売予測:アプリケーション別 (2022-2027)
- 日本のPVCフィギュアの収益予測:アプリケーション別 (2022-2027)
- 日本のPVCフィギュアの価格予測:アプリケーション別 (2022-2027)
第7章 北米
- 北米のPVCフィギュアの市場規模:対前年成長率 2016-2027
- 北米のPVCフィギュアの市場概要と数値:国別
- 北米のPVCフィギュアの販売:国別 (2016-2021)
- 北米のPVCフィギュアの収益:国別 (2016-2021)
- 米国
- カナダ
第8章 アジア太平洋
- アジア太平洋のPVCフィギュアの市場規模:対前年成長率 2016-2027
- アジア太平洋のPVCフィギュアの市場概要と数値:地域別
- アジア太平洋のPVCフィギュアの販売:地域別 (2016-2021)
- アジア太平洋のPVCフィギュアの収益:地域別 (2016-2021)
- 中国
- 日本
- 韓国
- インド
- オーストラリア
- オーストラリア
- インドネシア
- タイ
- マレーシア
- フィリピン
- ベトナム
第9章 欧州
- 欧州のPVCフィギュアの市場規模:対前年成長率 2016-2027
- 欧州のPVCフィギュアの市場概要と数値:国別
- 欧州のPVCフィギュアの販売:国別 (2016-2021)
- 欧州のPVCフィギュアの収益:国別 (2016-2021)
- ドイツ
- フランス
- 英国
- イタリア
第10章 ラテンアメリカ
- ラテンアメリカのPVCフィギュアの市場規模:対前年成長率 2016-2027
- ラテンアメリカのPVCフィギュアの市場概要と数値:国別
- ラテンアメリカのPVCフィギュアの販売:国別 (2016-2021)
- ラテンアメリカのPVCフィギュアの収益:国別 (2016-2021)
- メキシコ
- ブラジル
- アルゼンチン
第11章 中東・アフリカ
- 中東・アフリカのPVCフィギュアの市場規模:対前年成長率 2016-2027
- 中東・アフリカのPVCフィギュアの市場概要と数値:国別
- 中東・アフリカのPVCフィギュアの販売:国別 (2016-2021)
- 中東・アフリカのPVCフィギュアの収益:国別 (2016-2021)
- トルコ
- サウジアラビア
- UAE
第12章 企業プロファイル
- Good Smile Company
- Alter
- Max Factory
- Kotobukiya
- Hobbymax
- HOT TOYS
- Aniplex+
- MegaHouse
- AZONE
- Sideshow Collectibles
- Good Smile Company
第13章 市場の機会, 課題, リスクと影響要因の分析
- PVCフィギュア 業界動向
- PVCフィギュア 市場の促進要因
- PVCフィギュア 市場の課題
- PVCフィギュア 市場の抑制要因
第14章 バリューチェーンと販売チャネルの分析
- バリューチェーンの分析
- PVC フィギュア 顧客
- 販売チャネル分析
- 販売チャネル
- 卸業者
第15章 市場調査結果と結論
第16章 付録
LIST OF TABLES
- Table 1. Global PVC Figures Market Size Growth Rate by Type, 2016 VS 2021 VS 2027 (US$ Million)
- Table 2. Major Manufacturers of Movie Figures
- Table 3. Global PVC Figures Market Size Growth Rate by Application, 2016 VS 2021 VS 2027 (US$ Million)
- Table 4. Global PVC Figures Market Size by Region (US$ Million): 2016 VS 2021 VS 2027
- Table 5. Global PVC Figures Sales by Region (2016-2021) & (K Units)
- Table 6. Global PVC Figures Sales Market Share by Region (2016-2021)
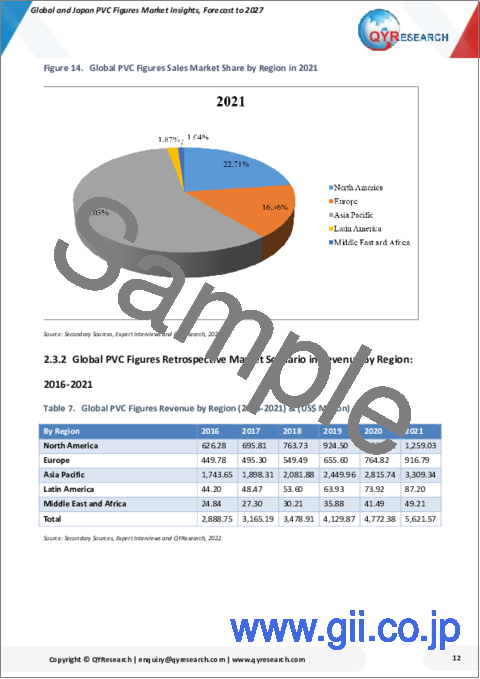
- Table 7. Global PVC Figures Revenue by Region (2016-2021) & (US$ Million)
- Table 8. Global PVC Figures Sales Forecast by Region (2022-2027) & (K Units)
- Table 9. Global PVC Figures Sales Market Share Forecast by Region (2022-2027)
- Table 10. Global PVC Figures Revenue Forecast by Region (2022-2027) & (US$ Million)
- Table 11. Global PVC Figures Revenue Market Share Forecast by Region (2022-2027)
- Table 12. Global PVC Figures Sales by Manufacturer (2016-2021) & (K Units)
- Table 13. Global PVC Figures Sales Share by Manufacturer (2016-2021)
- Table 14. Ranking of Global Top PVC Figures Manufacturers by Revenue (US$ Million) in 2021
- Table 15. PVC Figures Revenue by Manufacturer (2016-2021) & (US$ Million)
- Table 16. PVC Figures Revenue Share by Manufacturer (2016-2021)
- Table 17. Global PVC Figures Manufacturers Market Concentration Ratio (CR5 and HHI) & (2016-2021)
- Table 18. Global PVC Figures by Company Type (Tier 1, Tier 2, and Tier 3) & (based on the Revenue in PVC Figures as of 2020)
- Table 19. Key Manufacturers PVC Figures Price (2016-2021) & (US$/Unit)
- Table 20. PVC Figures Manufacturers Manufacturing Base Distribution and Headquarters
- Table 21. Manufacturers PVC Figures Product Type
- Table 22. Founded Date of International Manufacturers
- Table 23. Manufacturers Mergers & Acquisitions, Expansion Plans
- Table 24. Global PVC Figures Sales by Type (2016-2021) & (K Units)
- Table 25. Global PVC Figures Sales Share by Type (2016-2021)
- Table 26. Global PVC Figures Revenue by Type (2016-2021) & (US$ Million)
- Table 27. Global PVC Figures Revenue Share by Type (2016-2021)
- Table 28. PVC Figures Average Selling Price (ASP) by Type (2016-2021) & (US$/Unit)
- Table 29. Global PVC Figures Sales Forecast by Type (2022-2027) & (K Units)
- Table 30. Global PVC Figures Sales Market Share Forecast by Type (2022-2027)
- Table 31. Global PVC Figures Revenue Forecast by Type (2022-2027) & (US$ Million)
- Table 32. Global PVC Figures Revenue Market Share Forecast by Type (2022-2027)
- Table 33. Global PVC Figures Average Selling Price (ASP) Forecast by Type (2022-2027) & (US$/Unit)
- Table 34. Global PVC Figures Sales by Application (2016-2021) & (K Units)
- Table 35. Global PVC Figures Sales Share by Application (2016-2021)
- Table 36. Global PVC Figures Revenue by Application (2016-2021) & (US$ Million)
- Table 37. Global PVC Figures Revenue Share by Application (2016-2021)
- Table 38. PVC Figures Price by Application (2016-2021) & (US$/Unit)
- Table 39. Global PVC Figures Sales Forecast by Application (2022-2027) & (K Units)
- Table 40. Global PVC Figures Sales Market Share Forecast by Application (2022-2027)
- Table 41. Global PVC Figures Revenue Forecast by Application (2022-2027) & (US$ Million)
- Table 42. Global PVC Figures Revenue Market Share Forecast by Application (2022-2027)
- Table 43. Global PVC Figures Price Forecast by Application (2022-2027) & (US$/Unit)
- Table 44. Japan PVC Figures Sales (K Units) of Key Companies (2016-2021)
- Table 45. Japan PVC Figures Sales Share by Company (2016-2021)
- Table 46. Japan PVC Figures Revenue (US$ Million) by Company (2016-2021)
- Table 47. Japan PVC Figures Revenue Share by Company (2016-2021)
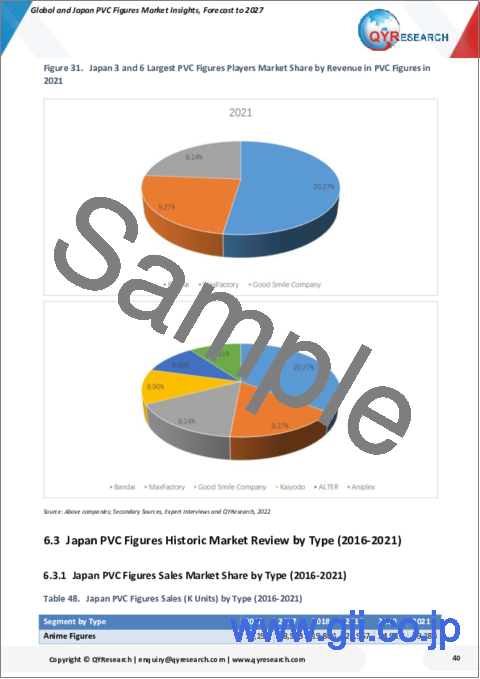
- Table 48. Japan PVC Figures Sales (K Units) by Type (2016-2021)
- Table 49. Japan PVC Figures Sales Share by Type (2016-2021)
- Table 50. Japan PVC Figures Revenue (US$ Million) Market Share by Type (2016-2021)
- Table 51. Japan PVC Figures Price (US$/Unit) by Type (2016-2021)
- Table 52. Japan PVC Figures Sales (K Units) by Type (2022-2027)
- Table 53. Japan PVC Figures Sales Share by Type (2022-2027)
- Table 54. Japan PVC Figures Revenue (US$ Million) Market Share by Type (2022-2027)
- Table 55. Japan PVC Figures Revenue Share by Type (2022-2027)
- Table 56. Japan PVC Figures Price (US$/Unit) by Type (2022-2027)
- Table 57. Japan PVC Figures Sales (K Units) by Application (2016-2021)
- Table 58. Japan PVC Figures Sales Share by Application (2016-2021)
- Table 59. Japan PVC Figures Revenue (US$ Million) Market Share by Application (2016-2021)
- Table 60. Japan PVC Figures Revenue Share by Application (2016-2021)
- Table 61. Japan PVC Figures Price (US$/Unit) by Application (2016-2021)
- Table 62. Japan PVC Figures Sales (K Units) by Application (2022-2027)
- Table 63. Japan PVC Figures Sales Share by Application (2022-2027)
- Table 64. Japan PVC Figures Revenue (US$ Million) Market Share by Application (2022-2027)
- Table 65. Japan PVC Figures Revenue Share by Application (2022-2027)
- Table 66. Japan PVC Figures Price (US$/Unit) by Application (2022-2027)
- Table 67. North America PVC Figures Sales by Country (2016-2021) & (K Units)
- Table 68. North America PVC Figures Sales Market Share by Country (2016-2021)
- Table 69. North America PVC Figures Revenue by Country (2016-2021) & (US$ Million)
- Table 70. North America PVC Figures Revenue Market Share by Country (2016-2021)
- Table 71. Asia-Pacific PVC Figures Sales by Region (2016-2021) & (K Units)
- Table 72. Asia-Pacific PVC Figures Sales Market Share by Region (2016-2021)
- Table 73. Asia-Pacific PVC Figures Revenue by Region (2016-2021) & (US$ Million)
- Table 74. Asia-Pacific PVC Figures Revenue Market Share by Region (2016-2021)
- Table 75. Europe PVC Figures Sales by Country (2016-2021) & (K Units)
- Table 76. Europe PVC Figures Sales Market Share by Country (2016-2021)
- Table 77. Europe PVC Figures Revenue by Country (2016-2021) & (US$ Million)
- Table 78. Europe PVC Figures Revenue Market Share by Country (2016-2021)
- Table 79. Latin America PVC Figures Sales by Country (2016-2021) & (K Units)
- Table 80. Latin America PVC Figures Sales Market Share by Country (2016-2021)
- Table 81. Latin America PVC Figures Revenue by Country (2016-2021) & (US$ Million)
- Table 82. Latin America PVC Figures Revenue Market Share by Country (2016-2021)
- Table 83. Middle East and Africa PVC Figures Sales by Country (2016-2021) & (K Units)
- Table 84. Middle East and Africa PVC Figures Sales Market Share by Country (2016-2021)
- Table 85. Middle East and Africa PVC Figures Revenue by Country (2016-2021) & (US$ Million)
- Table 86. Middle East and Africa PVC Figures Revenue Market Share by Country (2016-2021)
- Table 87. Good Smile Company Corporation Information
- Table 88. Good Smile Company Description and Business Overview
- Table 89. Good Smile Company PVC Figures Sales (K Units), Revenue (US$ Million), Price (US$/Unit) and Gross Margin (2016-2021)
- Table 90. Good Smile Company PVC Figures Product
- Table 91. MaxFactory Corporation Information
- Table 92. MaxFactory Description and Business Overview
- Table 93. MaxFactory PVC Figures Sales (K Units), Revenue (US$ Million), Price (US$/Unit) and Gross Margin (2016-2021)
- Table 94. MaxFactory PVC Figures Product
- Table 95. ALTER Corporation Information
- Table 96. ALTER Description and Business Overview
- Table 97. ALTER PVC Figures Sales (K Units), Revenue (US$ Million), Price (US$/Unit) and Gross Margin (2016-2021)
- Table 98. ALTER PVC Figures Product
- Table 99. Aniplex Corporation Information
- Table 100. Aniplex Description and Business Overview
- Table 101. Aniplex PVC Figures Sales (K Units), Revenue (US$ Million), Price (US$/Unit) and Gross Margin (2016-2021)
- Table 102. Aniplex PVC Figures Product
- Table 103. Aniplex Recent Development
- Table 104. Bandai Corporation Information
- Table 105. Bandai Description and Business Overview
- Table 106. Bandai PVC Figures Sales (K Units), Revenue (US$ Million), Price (US$/Unit) and Gross Margin (2016-2021)
- Table 107. Bandai PVC Figures Product
- Table 108. Kaiyodo Corporation Information
- Table 109. Kaiyodo Description and Business Overview
- Table 110. Kaiyodo PVC Figures Production Sales (K Units), Revenue (US$ Million), Price (USD/Unit) and Gross Margin (2015-2020)
- Table 111. Kaiyodo PVC Figures Product
- Table 112. Kotobukiya Corporation Information
- Table 113. Kotobukiya Description and Business Overview
- Table 114. Kotobukiya PVC Figures Sales (K Units), Revenue (US$ Million), Price (US$/Unit) and Gross Margin (2016-2021)
- Table 115. Kotobukiya PVC Figures Product
- Table 116. Funko Corporation Information
- Table 117. Funko Description and Business Overview
- Table 118. Funko PVC Figures Sales (K Units), Revenue (US$ Million), Price (US$/Unit) and Gross Margin (2016-2021)
- Table 119. Funko PVC Figures Product
- Table 120. Hasbro Corporation Information
- Table 121. Hasbro Description and Business Overview
- Table 122. Hasbro PVC Figures Sales (K Units), Revenue (US$ Million), Price (US$/Unit) and Gross Margin (2016-2021)
- Table 123. Hasbro PVC Figures Product
- Table 124. Hasbro Recent Development
- Table 125. Mattel Corporation Information
- Table 126. Mattel Description and Business Overview
- Table 127. Mattel PVC Figures Sales (K Units), Revenue (US$ Million), Price (US$/Unit) and Gross Margin (2016-2021)
- Table 128. Mattel PVC Figures Product
- Table 129. Hot Toys Corporation Information
- Table 130. Hot Toys Description and Business Overview
- Table 131. Hot Toys PVC Figures Sales (K Units), Revenue (US$ Million), Price (US$/Unit) and Gross Margin (2016-2021)
- Table 132. Hot Toys PVC Figures Product
- Table 133. Sideshow Collectibles Corporation Information
- Table 134. Sideshow Collectibles Description and Business Overview
- Table 135. Sideshow Collectibles PVC Figures Sales (K Units), Revenue (US$ Million), Price (US$/Unit) and Gross Margin (2016-2021)
- Table 136. Sideshow Collectibles PVC Figures Product
- Table 137. POP MART Corporation Information
- Table 138. POP MART Description and Business Overview
- Table 139. POP MART PVC Figures Sales (K Units), Revenue (US$ Million), Price (US$/Unit) and Gross Margin (2016-2021)
- Table 140. POP MART PVC Figures Product
- Table 141. PVC Figures Market Trends
- Table 142. PVC Figures Market Drivers
- Table 143. PVC Figures Market Challenges
- Table 144. PVC Figures Market Restraints
- Table 145. PVC Figures Customers List
- Table 146. PVC Figures Distributors List
- Table 147. Research Programs/Design for This Report
- Table 148. Key Data Information from Secondary Sources
- Table 149. Key Data Information from Primary Sources
List of Figures
- Figure 1. PVC Figures Product Picture
- Figure 2. Global PVC Figures Market Share by Type in 2021 & 2027
- Figure 3. Anime Figures Product Picture
- Figure 4. Major Manufacturers of Anime Figures
- Figure 5. Movie Figures Product Picture
- Figure 6. Global PVC Figures Market Share by Application in 2021 & 2027
- Figure 7. Offline Sales
- Figure 8. Online Sales
- Figure 9. Global PVC Figures Market Size, (US$ Million), 2016 VS 2021 VS 2027
- Figure 10. Global PVC Figures Market Size 2016-2027 (US$ Million)
- Figure 11. Global PVC Figures Sales 2016-2027 (K Units)
- Figure 12. Global PVC Figures Market Size Market Share by Region: 2021 Versus 2027
- Figure 13. Global PVC Figures Sales Market Share by Region (2016-2021)
- Figure 14. Global PVC Figures Sales Market Share by Region in 2021
- Figure 15. Global PVC Figures Revenue Market Share by Region (2016-2021)
- Figure 16. Global PVC Figures Revenue Market Share by Region in 2021
- Figure 17. Global PVC Figures Sales Share by Manufacturer in 2021
- Figure 18. The Top 3 and 6 Players Market Share by PVC Figures Revenue in 2021
- Figure 19. PVC Figures Market Share by Company Type (Tier 1, Tier 2, and Tier 3) in 2021
- Figure 20. Global PVC Figures Sales Market Share by Type (2016-2021)
- Figure 21. Global PVC Figures Sales Market Share by Type in 2021
- Figure 22. Global PVC Figures Revenue Market Share by Type (2016-2021)
- Figure 23. Global PVC Figures Revenue Market Share by Type in 2021
- Figure 24. Global PVC Figures Sales Market Share by Application (2016-2021)
- Figure 25. Global PVC Figures Sales Market Share by Application in 2021
- Figure 26. Global PVC Figures Revenue Market Share by Application (2016-2021)
- Figure 27. Global PVC Figures Revenue Market Share by Application in 2021
- Figure 28. Japan PVC Figures Sales Growth Rate 2016-2027 (K Units)
- Figure 29. Japan PVC Figures Revenue Growth Rate 2016-2027 (US$ Million)
- Figure 30. Japan PVC Figures Revenue Market Share in Global Market 2016-2027
- Figure 31. Japan 3 and 6 Largest PVC Figures Players Market Share by Revenue in PVC Figures in 2021
- Figure 32. Japan PVC Figures Revenue Share by Type (2016-2021)
- Figure 33. Japan PVC Figures Revenue Market Share by Type in 2016 & 2021
- Figure 34. North America PVC Figures Sales Growth Rate 2016-2027 (K Units)
- Figure 35. North America PVC Figures Revenue Growth Rate 2016-2027 (US$ Million)
- Figure 36. North America PVC Figures Sales Market Share by Country in 2021
- Figure 37. North America PVC Figures Revenue Market Share by Country in 2021
- Figure 38. U.S. PVC Figures Sales Growth Rate (2016-2021) & (K Units)
- Figure 39. U.S. PVC Figures Revenue Growth Rate (2016-2021) & (US$ Million)
- Figure 40. Canada PVC Figures Sales Growth Rate (2016-2021) & (K Units)
- Figure 41. Canada PVC Figures Revenue Growth Rate (2016-2021) & (US$ Million)
- Figure 42. Mexico PVC Figures Sales Growth Rate (2016-2021) & (K Units)
- Figure 43. Mexico PVC Figures Revenue Growth Rate (2016-2021) & (US$ Million)
- Figure 44. Asia-Pacific PVC Figures Sales Growth Rate 2016-2027 (K Units)
- Figure 45. Asia-Pacific PVC Figures Revenue Growth Rate 2016-2027 (US$ Million)
- Figure 46. Asia-Pacific PVC Figures Sales Market Share by Region in 2021
- Figure 47. Asia-Pacific PVC Figures Revenue Market Share by Region in 2021
- Figure 48. China PVC Figures Sales Growth Rate (2016-2021) & (K Units)
- Figure 49. China PVC Figures Revenue Growth Rate (2016-2021) & (US$ Million)
- Figure 50. Japan PVC Figures Sales Growth Rate (2016-2021) & (K Units)
- Figure 51. Japan PVC Figures Revenue Growth Rate (2016-2021) & (US$ Million)
- Figure 52. South Korea PVC Figures Sales Growth Rate (2016-2021) & (K Units)
- Figure 53. South Korea PVC Figures Revenue Growth Rate (2016-2021) & (US$ Million)
- Figure 54. India PVC Figures Sales Growth Rate (2016-2021) & (K Units)
- Figure 55. India PVC Figures Revenue Growth Rate (2016-2021) & (US$ Million)
- Figure 56. Australia PVC Figures Sales Growth Rate (2016-2021) & (K Units)
- Figure 57. Australia PVC Figures Revenue Growth Rate (2016-2021) & (US$ Million)
- Figure 58. Taiwan PVC Figures Sales Growth Rate (2016-2021) & (K Units)
- Figure 59. Taiwan PVC Figures Revenue Growth Rate (2016-2021) & (US$ Million)
- Figure 60. Indonesia PVC Figures Sales Growth Rate (2016-2021) & (K Units)
- Figure 61. Indonesia PVC Figures Revenue Growth Rate (2016-2021) & (US$ Million)
- Figure 62. Thailand PVC Figures Sales Growth Rate (2016-2021) & (K Units)
- Figure 63. Thailand PVC Figures Revenue Growth Rate (2016-2021) & (US$ Million)
- Figure 64. Malaysia PVC Figures Sales Growth Rate (2016-2021) & (K Units)
- Figure 65. Malaysia PVC Figures Revenue Growth Rate (2016-2021) & (US$ Million)
- Figure 66. Europe PVC Figures Sales Growth Rate 2016-2027 (K Units)
- Figure 67. Europe PVC Figures Revenue Growth Rate 2016-2027 (US$ Million)
- Figure 68. Europe PVC Figures Sales Market Share by Country in 2021
- Figure 69. Europe PVC Figures Revenue Market Share by Country in 2021
- Figure 70. Germany PVC Figures Sales Growth Rate (2016-2021) & (K Units)
- Figure 71. Germany PVC Figures Revenue Growth Rate (2016-2021) & (US$ Million)
- Figure 72. France PVC Figures Sales Growth Rate (2016-2021) & (K Units)
- Figure 73. France PVC Figures Revenue Growth Rate (2016-2021) & (US$ Million)
- Figure 74. U.K. PVC Figures Sales Growth Rate (2016-2021) & (K Units)
- Figure 75. U.K. PVC Figures Revenue Growth Rate (2016-2021) & (US$ Million)
- Figure 76. Italy PVC Figures Sales Growth Rate (2016-2021) & (K Units)
- Figure 77. Italy PVC Figures Revenue Growth Rate (2016-2021) & (US$ Million)
- Figure 78. Russia PVC Figures Sales Growth Rate (2016-2021) & (K Units)
- Figure 79. Russia PVC Figures Revenue Growth Rate (2016-2021) & (US$ Million)
- Figure 80. Latin America PVC Figures Sales Growth Rate 2016-2027 (K Units)
- Figure 81. Latin America PVC Figures Revenue Growth Rate 2016-2027 (US$ Million)
- Figure 82. Latin America PVC Figures Sales Market Share by Country in 2021
- Figure 83. Latin America PVC Figures Revenue Market Share by Country in 2021
- Figure 84. Brazil PVC Figures Sales Growth Rate (2016-2021) & (K Units)
- Figure 85. Brazil PVC Figures Revenue Growth Rate (2016-2021) & (US$ Million)
- Figure 86. Argentina PVC Figures Sales Growth Rate (2016-2021) & (K Units)
- Figure 87. Argentina PVC Figures Revenue Growth Rate (2016-2021) & (US$ Million)
- Figure 88. Middle East and Africa PVC Figures Sales Growth Rate 2016-2027 (K Units)
- Figure 89. Middle East and Africa PVC Figures Revenue Growth Rate 2016-2027 (US$ Million)
- Figure 90. Middle East and Africa PVC Figures Sales Market Share by Country in 2021
- Figure 91. Middle East and Africa PVC Figures Revenue Market Share by Country in 2021
- Figure 92. Turkey PVC Figures Sales Growth Rate (2016-2021) & (K Units)
- Figure 93. Turkey PVC Figures Revenue Growth Rate (2016-2021) & (US$ Million)
- Figure 94. Saudi Arabia PVC Figures Sales Growth Rate (2016-2021) & (K Units)
- Figure 95. Saudi Arabia PVC Figures Revenue Growth Rate (2016-2021) & (US$ Million)
- Figure 96. UAE PVC Figures Sales Growth Rate (2016-2021) & (K Units)
- Figure 97. UAE PVC Figures Revenue Growth Rate (2016-2021) & (US$ Million)
- Figure 98. PVC Figures Value Chain
- Figure 99. Channels of Distribution
- Figure 100. Distributors Profiles
- Figure 101. Bottom-up and Top-down Approaches for This Report
- Figure 102. Data Triangulation
- Figure 103. Key Executives Interviewed
Market Analysis and Insights:
This report focuses on global and Japan PVC Figures market.
In 2021, the global PVC Figures market size was US$ 5.62 billion and it is expected to reach US$ 13.61 billion by the end of 2027, with a CAGR of 15.88% during 2021-2027. In Japan the PVC Figures market size is expected to grow from US$ 2.37 billion in 2021 to US$ 4.49 billion by 2027, at a CAGR of 11.25% during 2021-2027.
Scope and Market Size:
PVC Figures market is segmented by region (country), by players, by Type, and by Application. Players, stakeholders, and other participants in the global PVC Figures market will be able to gain the upper hand as they use the report as a powerful resource. The segmental analysis focuses on sales, revenue and forecast by Type and by Application for the period 2016-2027.
For China market, this report focuses on the PVC Figures market size by players, by Type, and by Application, for the period 2016-2027. The key players include the global and local players which play important roles in China.
By Company
- Good Smile Company
- MaxFactory
- ALTER
- Aniplex
- Bandai
- Kaiyodo
- Kotobukiya
- Funko
- Hasbro
- Mattel
- Hot Toys
- Sideshow Collectibles
- POP MART
Segment by Type
- Anime Figures
- Movie Figures
- Others
Segment by Application
- Offline Sales
- Online Sales
By Region
- North America
- U.S.
- Canada
- Mexico
- Asia-Pacific
- China
- Japan
- South Korea
- India
- Australia
- Taiwan
- Indonesia
- Thailand
- Malaysia
- Europe
- Germany
- France
- U.K.
- Italy
- Russia
- Others
- Latin America
- Brazil
- Argentina
- Others
- Middle East & Africa
- Turkey
- Saudi Arabia
- UAE
- Egypt
- Other
TABLE OF CONTENTS
1 STUDY COVERAGE
- 1.1 PVC Figures Product Introduction
- 1.2 Market by Type
- 1.2.1 Global PVC Figures Market Size Growth Rate by Type
- 1.2.2 Anime Figures
- 1.2.3 Movie Figures
- 1.3 Market by Application
- 1.3.1 Global PVC Figures Market Size Growth Rate by Application
- 1.3.2 Offline Sales
- 1.3.3 Online Sales
- 1.4 Study Objectives
- 1.5 Years Considered
2 EXECUTIVE SUMMARY
- 2.1 Global PVC Figures Market Size Estimates and Forecasts
- 2.1.1 Global PVC Figures Revenue 2016-2027
- 2.1.2 Global PVC Figures Sales 2016-2027
- 2.2 PVC Figures Market Size by Region: 2016 VS 2021 VS 2027
- 2.3 PVC Figures Historical Market Size by Region (2016-2027)
- 2.3.1 Global PVC Figures Retrospective Market Scenario in Sales by Region: 2016-2021
- 2.3.2 Global PVC Figures Retrospective Market Scenario in Revenue by Region: 2016-2021
- 2.4 PVC Figures Market Estimates and Projections by Region (2022-2027)
- 2.4.1 Global PVC Figures Sales Forecast by Region (2022-2027)
- 2.4.2 Global PVC Figures Revenue Forecast by Region (2022-2027)
3 GLOBAL PVC FIGURES COMPETITOR LANDSCAPE BY PLAYERS
- 3.1 Global Top PVC Figures Manufacturers by Sales
- 3.1.1 Global PVC Figures Sales by Manufacturer (2016-2021)
- 3.1.2 Global PVC Figures Sales Market Share by Manufacturer (2016-2021)
- 3.2 Global Top PVC Figures Manufacturers by Revenue
- 3.2.1 Key PVC Figures Manufacturers Covered: Ranking by Revenue
- 3.2.2 Global PVC Figures Revenue by Manufacturer (2016-2021)
- 3.2.3 Global PVC Figures Revenue Share by Manufacturer (2016-2021)
- 3.2.4 Global PVC Figures Market Concentration Ratio (CR5 and HHI) & (2016-2021)
- 3.2.5 Global Top 3 and Top 6 Companies by PVC Figures Revenue in 2021
- 3.2.6 Global PVC Figures Market Share by Company Type (Tier 1, Tier 2, and Tier 3)
- 3.3 Global PVC Figures Price by Manufacturer (2016-2021)
- 3.4 Global PVC Figures Manufacturing Base Distribution, Product Type
- 3.4.1 PVC Figures Manufacturers Manufacturing Base Distribution, Headquarters
- 3.4.2 Manufacturers PVC Figures Product Type
- 3.4.3 Founded Date of International Manufacturers
- 3.5 Manufacturers Mergers & Acquisitions, Expansion Plans
4 BREAKDOWN DATA BY TYPE (2016-2027)
- 4.1 Global PVC Figures Market Size by Type (2016-2021)
- 4.1.1 Global PVC Figures Sales by Type (2016-2021)
- 4.1.2 Global PVC Figures Revenue by Type (2016-2021)
- 4.1.3 PVC Figures Average Selling Price (ASP) by Type (2016-2021)
- 4.2 Global PVC Figures Market Size Forecast by Type (2022-2027)
- 4.2.1 Global PVC Figures Sales Forecast by Type (2022-2027)
- 4.2.2 Global PVC Figures Revenue Forecast by Type (2022-2027)
- 4.2.3 Global PVC Figures Average Selling Price (ASP) Forecast by Type (2022-2027)
5 BREAKDOWN DATA BY APPLICATION (2016-2027)
- 5.1 Global PVC Figures Market Size by Application (2016-2021)
- 5.1.1 Global PVC Figures Sales by Application (2016-2021)
- 5.1.2 Global PVC Figures Revenue by Application (2016-2021)
- 5.1.3 PVC Figures Price by Application (2016-2021)
- 5.2 PVC Figures Market Size Forecast by Application (2022-2027)
- 5.2.1 Global PVC Figures Sales Forecast by Application (2022-2027)
- 5.2.2 Global PVC Figures Revenue Forecast by Application (2022-2027)
- 5.2.3 Global PVC Figures Price Forecast by Application (2022-2027)
6 JAPAN BY PLAYERS, BY TYPE AND BY APPLICATION
- 6.1 Japan PVC Figures Market Size YoY Growth 2016-2027
- 6.1.1 Japan PVC Figures Sales YoY Growth 2016-2027
- 6.1.2 Japan PVC Figures Revenue YoY Growth 2016-2027
- 6.1.3 Japan PVC Figures Revenue Market Share in Global Market 2016-2027
- 6.2 Japan PVC Figures Market Size by Players (International and Local Players)
- 6.2.1 Japan Top PVC Figures Players by Sales (2016-2021)
- 6.2.2 Japan Top PVC Figures Players by Revenue (2016-2021)
- 6.3 Japan PVC Figures Historic Market Review by Type (2016-2021)
- 6.3.1 Japan PVC Figures Sales Market Share by Type (2016-2021)
- 6.3.2 Japan PVC Figures Revenue Market Share by Type (2016-2021)
- 6.3.3 Japan PVC Figures Price by Type (2016-2021)
- 6.4 Japan PVC Figures Market Estimates and Forecasts by Type (2022-2027)
- 6.4.1 Japan PVC Figures Sales Forecast by Type (2022-2027)
- 6.4.2 Japan PVC Figures Revenue Forecast by Type (2022-2027)
- 6.4.3 Japan PVC Figures Price Forecast by Type (2022-2027)
- 6.5 Japan PVC Figures Historic Market Review by Application (2016-2021)
- 6.5.1 Japan PVC Figures Sales Market Share by Application (2016-2021)
- 6.5.2 Japan PVC Figures Revenue Market Share by Application (2016-2021)
- 6.5.3 Japan PVC Figures Price by Application (2016-2021)
- 6.6 Japan PVC Figures Market Estimates and Forecasts by Application (2022-2027)
- 6.6.1 Japan PVC Figures Sales Forecast by Application (2022-2027)
- 6.6.2 Japan PVC Figures Revenue Forecast by Application (2022-2027)
- 6.6.3 Japan PVC Figures Price Forecast by Application (2022-2027)
7 NORTH AMERICA
- 7.1 North America PVC Figures Market Size YoY Growth 2016-2027
- 7.2 North America PVC Figures Market Facts & Figures by Country
- 7.2.1 North America PVC Figures Sales by Country (2016-2021)
- 7.2.2 North America PVC Figures Revenue by Country (2016-2021)
- 7.2.3 U.S.
- 7.2.4 Canada
- 7.2.5 Mexico
8 ASIA-PACIFIC
- 8.1 Asia-Pacific PVC Figures Market Size YoY Growth 2016-2027
- 8.2 Asia-Pacific PVC Figures Market Facts & Figures by Region
- 8.2.1 Asia-Pacific PVC Figures Sales by Region (2016-2021)
- 8.2.2 Asia-Pacific PVC Figures Revenue by Region (2016-2021)
- 8.2.3 China
- 8.2.4 Japan
- 8.2.5 South Korea
- 8.2.6 India
- 8.2.7 Australia
- 8.2.8 Taiwan
- 8.2.9 Indonesia
- 8.2.10 Thailand
- 8.2.11 Malaysia
9 EUROPE
- 9.1 Europe PVC Figures Market Size YoY Growth 2016-2027
- 9.2 Europe PVC Figures Market Facts & Figures by Country
- 9.2.1 Europe PVC Figures Sales by Country (2016-2021)
- 9.2.2 Europe PVC Figures Revenue by Country (2016-2021)
- 9.2.3 Germany
- 9.2.4 France
- 9.2.5 U.K.
- 9.2.6 Italy
- 9.2.7 Russia
10 LATIN AMERICA
- 10.1 Latin America PVC Figures Market Size YoY Growth 2016-2027
- 10.2 Latin America PVC Figures Market Facts & Figures by Country
- 10.2.1 Latin America PVC Figures Sales by Country (2016-2021)
- 10.2.2 Latin America PVC Figures Revenue by Country (2016-2021)
- 10.2.3 Brazil
- 10.2.4 Argentina
11 MIDDLE EAST AND AFRICA
- 11.1 Middle East and Africa PVC Figures Market Size YoY Growth 2016-2027
- 11.2 Middle East and Africa PVC Figures Market Facts & Figures by Country
- 11.2.1 Middle East and Africa PVC Figures Sales by Country (2016-2021)
- 11.2.2 Middle East and Africa PVC Figures Revenue by Country (2016-2021)
- 11.2.3 Turkey
- 11.2.4 Saudi Arabia
- 11.2.5 UAE
12 COMPANY PROFILES
- 12.1 Good Smile Company
- 12.1.1 Good Smile Company Corporation Information
- 12.1.2 Good Smile Company Description, Business Overview
- 12.1.3 Good Smile Company PVC Figures Sales, Revenue and Gross Margin (2016-2021)
- 12.1.4 Good Smile Company PVC Figures Products Offered
- 12.2 MaxFactory
- 12.2.1 MaxFactory Corporation Information
- 12.2.2 MaxFactory Description, Business Overview
- 12.2.3 MaxFactory PVC Figures Sales, Revenue and Gross Margin (2016-2021)
- 12.2.4 MaxFactory PVC Figures Products Offered
- 12.3 ALTER
- 12.3.1 ALTER Corporation Information
- 12.3.2 ALTER Description, Business Overview
- 12.3.3 ALTER PVC Figures Sales, Revenue and Gross Margin (2016-2021)
- 12.3.4 ALTER PVC Figures Products Offered
- 12.4 Aniplex
- 12.4.1 Aniplex Corporation Information
- 12.4.2 Aniplex Description, Business Overview
- 12.4.3 Aniplex PVC Figures Production Sales, Revenue and Gross Margin (2015-2020)
- 12.4.4 Aniplex PVC Figures Products Offered
- 12.4.5 Aniplex Recent Development
- 12.5 Bandai
- 12.5.1 Bandai Corporation Information
- 12.5.2 Bandai Description, Business Overview
- 12.5.3 Bandai PVC Figures Sales, Revenue and Gross Margin (2016-2021)
- 12.5.4 Bandai PVC Figures Products Offered
- 12.6 Kaiyodo
- 12.6.1 Kaiyodo Corporation Information
- 12.6.2 Kaiyodo Description, Business Overview
- 12.6.3 Kaiyodo PVC Figures Sales, Revenue and Gross Margin (2016-2021)
- 12.6.4 Kaiyodo PVC Figures Products Offered
- 12.7 Kotobukiya
- 12.7.1 Kotobukiya Corporation Information
- 12.7.2 Kotobukiya Description, Business Overview
- 12.7.3 Kotobukiya PVC Figures Sales, Revenue and Gross Margin (2016-2021)
- 12.7.4 Kotobukiya PVC Figures Products Offered
- 12.8 Funko
- 12.8.1 Funko Corporation Information
- 12.8.2 Funko Description, Business Overview
- 12.8.3 Funko PVC Figures Sales, Revenue and Gross Margin (2016-2021)
- 12.8.4 Funko PVC Figures Products Offered
- 12.9 Hasbro
- 12.9.1 Hasbro Corporation Information
- 12.9.2 Hasbro Description, Business Overview
- 12.9.3 Hasbro PVC Figures Sales, Revenue and Gross Margin (2016-2021)
- 12.9.4 Hasbro PVC Figures Products Offered
- 12.9.5 Hasbro Recent Development
- 12.10 Mattel
- 12.10.1 Mattel Corporation Information
- 12.10.2 Mattel Description, Business Overview
- 12.10.3 Mattel PVC Figures Sales, Revenue and Gross Margin (2016-2021)
- 12.10.4 Mattel PVC Figures Products Offered
- 12.11 Hot Toys
- 12.11.1 Hot Toys Corporation Information
- 12.11.2 Hot Toys Description, Business Overview
- 12.11.3 Hot Toys PVC Figures Sales, Revenue and Gross Margin (2016-2021)
- 12.11.4 Hot Toys PVC Figures Products Offered
- 12.12 Sideshow Collectibles
- 12.12.1 Sideshow Collectibles Corporation Information
- 12.12.2 Sideshow Collectibles Description, Business Overview
- 12.12.3 Sideshow Collectibles PVC Figures Sales, Revenue and Gross Margin (2016-2021)
- 12.12.4 Sideshow Collectibles PVC Figures Products Offered
- 12.13 POP MART
- 12.13.1 POP MART Corporation Information
- 12.13.2 POP MART Description, Business Overview
- 12.13.3 POP MART PVC Figures Sales, Revenue and Gross Margin (2016-2021)
- 12.13.4 POP MART PVC Figures Products Offered
13 MARKET DRIVERS, OPPORTUNITIES, CHALLENGES AND RISKS FACTORS ANALYSIS
- 13.1 PVC Figures Industry Trends
- 13.2 PVC Figures Market Drivers
- 13.3 PVC Figures Market Challenges
- 13.4 PVC Figures Market Restraints
14 VALUE CHAIN AND SALES CHANNELS ANALYSIS
- 14.1 Value Chain Analysis
- 14.2 PVC Figures Customers
- 14.3 Sales Channels Analysis
- 14.3.1 Sales Channels
- 14.3.2 Distributors
15 RESEARCH FINDINGS AND CONCLUSION
16 APPENDIX
- 16.1 Research Methodology
- 16.1.1 Methodology/Research Approach
- 16.1.2 Data Source
- 16.2 Author Details
- 16.3 Disclaimer 122