|
|
市場調査レポート
商品コード
1178662
ソーシャルコマースの市場規模、シェア、動向分析レポート:ビジネスモデル別、製品タイプ別、プラットフォーム/販売チャネル別、地域別、セグメント別予測、2023年~2030年Social Commerce Market Size, Share & Trends Analysis Report By Business Model, By Product Type, By Platform/Sales Channel, By Region, And Segment Forecasts, 2023 - 2030 |
||||||
|
|
|||||||
|
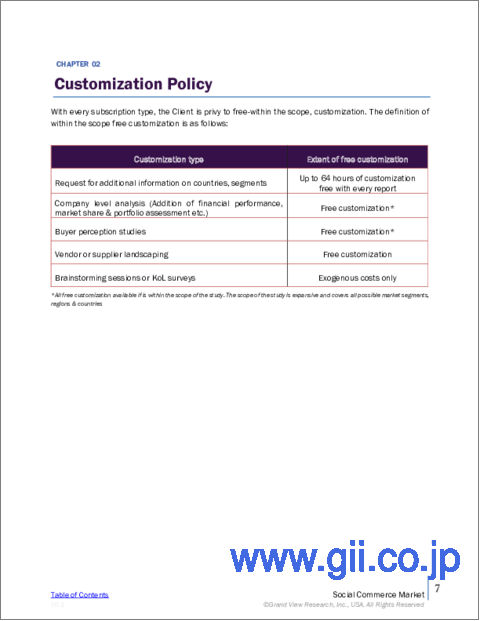
● お客様のご希望に応じて、既存データの加工や未掲載情報(例:国別セグメント)の追加などの対応が可能です。 詳細はお問い合わせください。 |
|||||||


| ソーシャルコマースの市場規模、シェア、動向分析レポート:ビジネスモデル別、製品タイプ別、プラットフォーム/販売チャネル別、地域別、セグメント別予測、2023年~2030年 |
|
出版日: 2022年12月27日
発行: Grand View Research
ページ情報: 英文 109 Pages
納期: 2~10営業日
|
- 全表示
- 概要
- 図表
- 目次
ソーシャルコマース市場の成長・動向
Grand View Research, Inc.の新しい調査によると、世界のソーシャルコマース市場規模は2030年までに6兆2439億4000万米ドルに達すると予測され、2023年から2030年までCAGR31.6%で拡大するとされています。ソーシャルコマースの需要を促進する最も重要な要因は、オンライン購入の容易性の高まりと考えられています。エンターテイメントと衝動的な購買習慣の組み合わせが、ソーシャルコマースの原動力となり続けています。ソーシャルコマースは、ブランドや小売業者にとって、価値創造のための大きな可能性を秘めた新たなメディアとなります。
インターネットを利用した広告活動が活発化したことで、様々な企業のビジネスモデルに変革が起こりました。さらに、インターネットは新たな収益源にもなっています。高速で手頃な価格のインターネット・サービスが簡単に利用できるようになったことで、マーケティング担当者はターゲット層にリーチするための新たなチャネルを手に入れることができました。その結果、インフルエンサーマーケティングの手法が台頭してきたのです。ブランドは、より個別化された広告キャンペーンを展開し、顧客体験を向上させています。彼らの商取引関係は、こうしたマーケティング手法を活用することで拡大を続けています。
インフルエンサーマーケティングハブが主催した調査では、参加企業の40%以上が、ソーシャルメディア企業の投稿やインフルエンサーのコンテンツをきっかけに、少なくとも1回は購入したことがあることが示唆されています。インフルエンサーは、エンゲージメント、売上、高品質のコンテンツ、ブランド認知度など、組織の主要なマーケティング目標の達成に役立つという事実が、インフルエンサーマーケティングの大きな需要を後押ししています。インフルエンサーマーケティングの盛り上がりに伴い、Instagramショッピングブランドは、製品やサービスの認知度と検証を作るためにこれらの個人を活用していると見られています。
さらに、ライブストリームショッピングのトレンドの人気の高まりは、予測期間中に市場の成長を促進することが期待されています。パンデミック以前は、「買い物動画」は中国でよく知られていました。さらに、COVID-19はライブコマース体験をもたらし、このショッピング方法の復活につながりました。ライブコマースは、対面でのショッピングに最も近い体験です。これを通じて、バイヤーは人々が製品を試す様子をリアルタイムで見ることができ、ブランドは即座にフィードバックを得ることができるのです。パンデミックは、ライブ・ストリーム・ショッピングの採用を加速させ、未開拓の市場に到達する十分な機会を与えているのです。
ソーシャルコマース市場のレポートハイライト
2022年はB2Cセグメントが市場を独占し、消費者マインドの変化とデジタル化の進展により、今後も支配が続くと予想される
パーソナル&ビューティーケア分野は、ソーシャルコマースプラットフォームによるキャッシュバック、割引、当日・翌日配送、EMIオプションなどの提供により、2022年に高い成長率が見込まれる
アジア太平洋地域は、予測期間中に33.1%の健全なCAGRで成長すると予測されています。この成長は、同地域におけるインターネットとスマートフォンの普及に起因しています。
目次
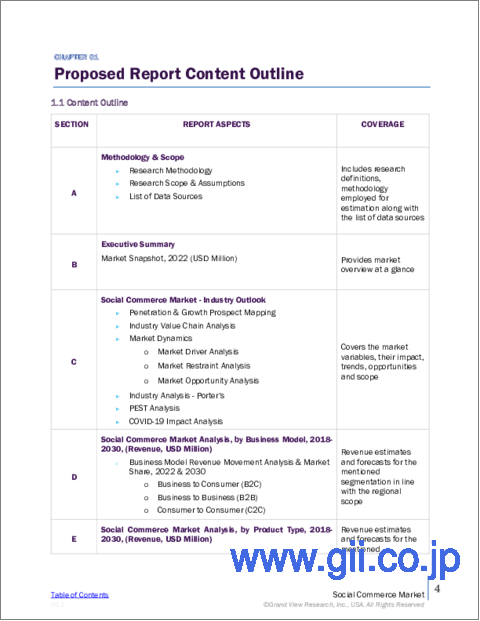
第1章 調査手法と範囲
- 市場セグメンテーションと範囲
- 情報調達
- 購入したデータベース
- Gvrの内部データベース
- 二次情報と第三者の視点
- 1次調査
- 情報分析
- データ分析モデル
- 市場形成とデータ可視化
- データの検証と公開
第2章 エグゼクティブサマリー
- エグゼクティブサマリー
- 市場の見通し
第3章 市場変数、動向、範囲
- ソーシャルコマース市場- 市場規模と成長見通し
- 業界バリューチェーン分析
- 市場促進要因分析
- ソーシャルメディアとeコマースの台頭
- 消費者マインドセットの変化
- 市場抑制要因分析
- 個人データの収集と使用に関するプライバシーの懸念
- 市場機会分析
- ソーシャルコマースにおけるビッグデータ分析とAIの出現
- 市場促進要因分析
- ソーシャルコマース市場への普及と成長見通しのマッピング(重要な機会の優先順位付け)
- ビジネス環境分析ツール
- 業界分析- ポーターの5つの力
- PEST分析
- 消費者行動分析:ソーシャルコマースが消費者行動に与える影響
- ソーシャルコマース市場におけるインフルエンサーの役割
第4章 ビジネスモデルの推定・動向分析
- 市場規模の推計・予測、およびトレンド分析、2018~2030年(10億米ドル)
- ビジネスモデル分析と市場シェア、2022年と2030年(10億米ドル)
- 企業から消費者へ(B2c)
- 企業間(B2b)
- 消費者から消費者へ(C2c)
第5章 製品タイプの推定・動向分析
- 市場規模の推計・予測、およびトレンド分析、2018~2030年(10億米ドル)
- 製品タイプの分析と市場シェア、2022年と2030年(10億米ドル)
- パーソナル&ビューティーケア
- 衣服
- 付属品
- ホーム製品
- 健康補助食品
- 飲食品
- その他
第5章 プラットフォーム/販売チャネルの推定・動向分析
- 市場規模の推計・予測、およびトレンド分析、2018~2030年(10億米ドル)
- プラットフォーム/販売チャネルの分析と市場シェア、2022年と2030年(10億米ドル)
- ビデオコマース(ライブストリーム+ 録画済み)
- ソーシャルネットワーク主導のコマース
- 社会的転売
- 共同購入
- 製品レビュープラットフォーム
第6章 地域推定・動向分析
- 地域の市場規模の推計・予測、2018~2030年(10億米ドル)
- 北米
- 欧州
- アジア太平洋地域
- ラテンアメリカ
- 中東とアフリカ
第7章 競合情勢
- 企業プロファイル
- Etsy, Inc.
- 会社概要
- 財務実績
- 製品のベンチマーク
- 最近の開発
- Fashnear Technologies Private Limited(Meesho)
- 会社概要
- 財務実績
- 製品のベンチマーク
- 最近の開発
- Pinduoduo Inc.
- 会社概要
- 財務実績
- 製品のベンチマーク
- 最近の開発
- Pinterest, Inc.
- 会社概要
- 財務実績
- 製品のベンチマーク
- 最近の開発
- Poshmark
- 会社概要
- 財務実績
- 製品のベンチマーク
- 最近の開発
- Roposo
- 会社概要
- 財務実績
- 製品のベンチマーク
- 最近の開発
- Snap, Inc.
- 会社概要
- 財務実績
- 製品のベンチマーク
- 最近の開発
- Taobao
- 会社概要
- 財務実績
- 製品のベンチマーク
- 最近の開発
- Tiktok(Douyin)
- 会社概要
- 財務実績
- 製品のベンチマーク
- 最近の開発
- Trell Shop
- 会社概要
- 財務実績
- 製品のベンチマーク
- Twitter, Inc.
- 会社概要
- 財務実績
- 製品のベンチマーク
- 最近の開発
- Wechat(Weixin)
- 会社概要
- 財務実績
- 製品のベンチマーク
- 最近の開発
- Xiaohongshu
- 会社概要
- 財務実績
- 製品のベンチマーク
- 最近の開発
- Yunji Sharing Technology Co., Ltd.
- 会社概要
- 財務実績
- 製品のベンチマーク
- 最近の開発
List of Tables
- Table 1 Social commerce market, 2018 - 2030 (USD Billion)
- Table 2 Social commerce market, by region, 2018 - 2030 (USD Billion)
- Table 3 Social commerce market, by business model, 2018 - 2030 (USD Billion)
- Table 4 Social commerce market, by product type, 2018 - 2030 (USD Billion)
- Table 5 Social commerce market, by platform/sales channel, 2018 - 2030 (USD Billion)
- Table 6 Most popular social networks & their active users worldwide, January 2021
- Table 7 Business to consumer (B2C) market, 2018 - 2030 (USD Billion)
- Table 8 Business to consumer (B2C) market, by region, 2018 - 2030 (USD Billion)
- Table 9 Business to Business (B2B) market, 2018 - 2030 (USD Billion)
- Table 10 Business to Business (B2B) market, by region, 2018 - 2030 (USD Billion)
- Table 11 Consumer to Consumer (C2C) market, 2018 - 2030 (USD Billion)
- Table 12 Consumer to Consumer (C2C) market, by region, 2018 - 2030 (USD Billion)
- Table 13 Personal & beauty care market, 2018 - 2030 (USD Billion)
- Table 14 Personal & beauty care market, by region, 2018 - 2030 (USD Billion)
- Table 15 Apparel market, 2018 - 2030 (USD Billion)
- Table 16 Apparel market, by region, 2018 - 2030 (USD Billion)
- Table 17 Accessories market, 2018 - 2030 (USD Billion)
- Table 18 Accessories market, by region, 2018 - 2030 (USD Billion)
- Table 19 Home products market, 2018 - 2030 (USD Billion)
- Table 20 Home products market, by region, 2018 - 2030 (USD Billion)
- Table 21 Health supplements market, 2018 - 2030 (USD Billion)
- Table 22 Health supplements market, by region, 2018 - 2030 (USD Billion)
- Table 23 Food & beverage market, 2018 - 2030 (USD Billion)
- Table 24 Food & beverage market, by region, 2018 - 2030 (USD Billion)
- Table 25 Others market, 2018 - 2030 (USD Billion)
- Table 26 Others market, by region, 2018 - 2030 (USD Billion)
- Table 27 Video Commerce (Live stream + Prerecorded) market, 2018 - 2030 (USD Billion)
- Table 28 Video Commerce (Live stream + Prerecorded) market, by region, 2018 - 2030 (USD Billion)
- Table 29 Social Network-led Commerce market, 2018 - 2030 (USD Billion)
- Table 30 Social Network-led Commerce market, by region, 2018 - 2030 (USD Billion)
- Table 31 Social Reselling market, 2018 - 2030 (USD Billion)
- Table 32 Social Reselling market, by region, 2018 - 2030 (USD Billion)
- Table 33 Group Buying market, 2018 - 2030 (USD Billion)
- Table 34 Group Buying market, by region, 2018 - 2030 (USD Billion)
- Table 35 Product Review Platforms market, 2018 - 2030 (USD Billion)
- Table 36 Product Review Platforms market, by region, 2018 - 2030 (USD Billion)
- Table 37 North America social commerce market, 2018 - 2030 (USD Billion)
- Table 38 North America social commerce market, by business model, 2018 - 2030 (USD Billion)
- Table 39 North America social commerce market, by product type, 2018 - 2030 (USD Billion)
- Table 40 North America social commerce market, by platform/sales channel, 2018 - 2030 (USD Billion)
- Table 41 U.S. social commerce market, 2018 - 2030 (USD Billion)
- Table 42 U.S. social commerce market, by business model, 2018 - 2030 (USD Billion)
- Table 43 U.S. social commerce market, by product type, 2018 - 2030 (USD Billion)
- Table 44 U.S. social commerce market, by platform/sales channel, 2018 - 2030 (USD Billion)
- Table 45 Canada social commerce market, 2018 - 2030 (USD Billion)
- Table 46 Canada social commerce market, by business model, 2018 - 2030 (USD Billion)
- Table 47 Canada social commerce market, by product type, 2018 - 2030 (USD Billion)
- Table 48 Canada social commerce market, by platform/sales channel, 2018 - 2030 (USD Billion)
- Table 49 Europe social commerce market, 2018 - 2030 (USD Billion)
- Table 50 Europe social commerce market, by business model, 2018 - 2030 (USD Billion)
- Table 51 Europe social commerce market, by product type, 2018 - 2030 (USD Billion)
- Table 52 Europe social commerce market, by platform/sales channel, 2018 - 2030 (USD Billion)
- Table 53 U.K. social commerce market, 2018 - 2030 (USD Billion)
- Table 54 U.K. social commerce market, by business model, 2018 - 2030 (USD Billion)
- Table 55 U.K. social commerce market, by product type, 2018 - 2030 (USD Billion)
- Table 56 U.K. social commerce market, by platform/sales channel, 2018 - 2030 (USD Billion)
- Table 57 Germany social commerce market, 2018 - 2030 (USD Billion)
- Table 58 Germany social commerce market, by business model, 2018 - 2030 (USD Billion)
- Table 59 Germany social commerce market, by product type, 2018 - 2030 (USD Billion)
- Table 60 Germany social commerce market, by platform/sales channel, 2018 - 2030 (USD Billion)
- Table 61 France social commerce market, 2018 - 2030 (USD Billion)
- Table 62 France social commerce market, by business model, 2018 - 2030 (USD Billion)
- Table 63 France social commerce market, by product type, 2018 - 2030 (USD Billion)
- Table 64 France social commerce market, by platform/sales channel, 2018 - 2030 (USD Billion)
- Table 65 Asia Pacific social commerce market, 2018 - 2030 (USD Billion)
- Table 66 Asia Pacific social commerce market, by business model, 2018 - 2030 (USD Billion)
- Table 67 Asia Pacific social commerce market, by product type, 2018 - 2030 (USD Billion)
- Table 68 Asia Pacific social commerce market, by platform/sales channel, 2018 - 2030 (USD Billion)
- Table 69 China social commerce market, 2018 - 2030 (USD Billion)
- Table 70 China social commerce market, by business model, 2018 - 2030 (USD Billion)
- Table 71 China social commerce market, by product type, 2018 - 2030 (USD Billion)
- Table 72 China social commerce market, by platform/sales channel, 2018 - 2030 (USD Billion
- Table 73 India social commerce market, 2018 - 2030 (USD Billion)
- Table 74 India social commerce market, by business model, 2018 - 2030 (USD Billion)
- Table 75 India social commerce market, by product type, 2018 - 2030 (USD Billion)
- Table 76 India social commerce market, by platform/sales channel, 2018 - 2030 (USD Billion)
- Table 77 Japan social commerce market, 2018 - 2030 (USD Billion)
- Table 78 Japan social commerce market, by business model, 2018 - 2030 (USD Billion)
- Table 79 Japan social commerce market, by product type, 2018 - 2030 (USD Billion)
- Table 80 Japan social commerce market, by platform/sales channel, 2018 - 2030 (USD Billion)
- Table 81 Australia social commerce market, 2018 - 2030 (USD Billion)
- Table 82 Australia social commerce market, by business model, 2018 - 2030 (USD Billion)
- Table 83 Australia social commerce market, by product type, 2018 - 2030 (USD Billion)
- Table 84 Australia social commerce market, by platform/sales channel, 2018 - 2030 (USD Billion)
- Table 85 Indonesia social commerce market, 2018 - 2030 (USD Billion)
- Table 86 Indonesia social commerce market, by business model, 2018 - 2030 (USD Billion)
- Table 87 Indonesia social commerce market, by product type, 2018 - 2030 (USD Billion)
- Table 88 Indonesia social commerce market, by platform/sales channel, 2018 - 2030 (USD Billion)
- Table 89 Singapore social commerce market, 2018 - 2030 (USD Billion)
- Table 90 Singapore social commerce market, by business model, 2018 - 2030 (USD Billion)
- Table 91 Singapore social commerce market, by product type, 2018 - 2030 (USD Billion)
- Table 92 Singapore social commerce market, by platform/sales channel, 2018 - 2030 (USD Billion)
- Table 93 South Korea social commerce market, 2018 - 2030 (USD Billion)
- Table 94 South Korea social commerce market, by business model, 2018 - 2030 (USD Billion)
- Table 95 South Korea social commerce market, by product type, 2018 - 2030 (USD Billion)
- Table 96 South Korea social commerce market, by platform/sales channel, 2018 - 2030 (USD Billion)
- Table 97 Thailand social commerce market, 2018 - 2030 (USD Billion)
- Table 98 Thailand social commerce market, by business model, 2018 - 2030 (USD Billion)
- Table 99 Thailand social commerce market, by product type, 2018 - 2030 (USD Billion)
- Table 100 Thailand social commerce market, by platform/sales channel, 2018 - 2030 (USD Billion)
- Table 101 Philippines social commerce market, 2018 - 2030 (USD Billion)
- Table 102 Philippines social commerce market, by business model, 2018 - 2030 (USD Billion)
- Table 103 Philippines social commerce market, by product type, 2018 - 2030 (USD Billion)
- Table 104 Philippines social commerce market, by platform/sales channel, 2018 - 2030 (USD Billion)
- Table 105 Vietnam social commerce market, 2018 - 2030 (USD Billion)
- Table 106 Vietnam social commerce market, by business model, 2018 - 2030 (USD Billion)
- Table 107 Vietnam social commerce market, by product type, 2018 - 2030 (USD Billion)
- Table 108 Vietnam social commerce market, by platform/sales channel, 2018 - 2030 (USD Billion)
- Table 109 Malaysia social commerce market, 2018 - 2030 (USD Billion)
- Table 110 Malaysia social commerce market, by business model, 2018 - 2030 (USD Billion)
- Table 111 Malaysia social commerce market, by product type, 2018 - 2030 (USD Billion)
- Table 112 Malaysia social commerce market, by platform/sales channel, 2018 - 2030 (USD Billion)
- Table 113 Latin America social commerce market, 2018 - 2030 (USD Billion)
- Table 114 Latin America social commerce market, by business model, 2018 - 2030 (USD Billion)
- Table 115 Latin America social commerce market, by product type, 2018 - 2030 (USD Billion)
- Table 116 Latin America social commerce market, by platform/sales channel, 2018 - 2030 (USD Billion)
- Table 117 Brazil social commerce market, 2018 - 2030 (USD Billion)
- Table 118 Brazil social commerce market, by business model, 2018 - 2030 (USD Billion)
- Table 119 Brazil social commerce market, by product type, 2018 - 2030 (USD Billion)
- Table 120 Brazil social commerce market, by platform/sales channel, 2018 - 2030 (USD Billion)
- Table 121 Mexico social commerce market, 2018 - 2030 (USD Billion)
- Table 122 Mexico social commerce market, by business model, 2018 - 2030 (USD Billion)
- Table 123 Mexico social commerce market, by product type, 2018 - 2030 (USD Billion)
- Table 124 Mexico social commerce market, by platform/sales channel, 2018 - 2030 (USD Billion)
- Table 125 Middle East & Africa social commerce market, 2018 - 2030 (USD Billion)
- Table 126 Middle East & Africa social commerce market, by business model, 2018 - 2030 (USD Billion)
- Table 127 Middle East & Africa social commerce market, by product type, 2018 - 2030 (USD Billion)
- Table 128 Middle East & Africa social commerce market, by platform/sales channel, 2018 - 2030 (USD Billion)
List of Figures
- Fig. 1 Market segmentation & scope
- Fig. 2 Information procurement
- Fig. 3 Primary research pattern
- Fig. 4 Primary research process
- Fig. 5 Market formulation and data visualization
- Fig. 6 Industry Snapshot
- Fig. 7 Social Commerce Market Size and Growth Prospects, 2018 - 2030 (USD Billion)
- Fig. 8 Social Commerce Market Value Chain Analysis
- Fig. 9 Global E-commerce Sales, 2021 to 2030 (USD Billion)
- Fig. 10 Social Commerce Market Penetration & Growth Prospect Mapping (Key Opportunity Prioritized)
- Fig. 11 Industry Analysis-Porter's Five Forces
- Fig. 12 PEST Analysis
- Fig. 13 Share of U.S. adults that have engaged in Social Commerce, by Age Group
- Fig. 14 Global Influencer Marketing Platform Market, 2021 to 2030 (USD Billion)
- Fig. 15 Social Commerce Market, by Business Model, Key Takeaways (USD Billion)
- Fig. 16 Business Model Analysis & Market Share, 2022 & 2030
- Fig. 17 Social Commerce Market, by Product Type, Key Takeaways (USD Billion)
- Fig. 18 Product Type Analysis & Market Share, 2022 & 2030
- Fig. 17 Social Commerce Market, by platform/sales channel, Key Takeaways (USD Billion)
- Fig. 18 Product Type Analysis & Market Share, 2022 & 2030
- Fig. 19 Regional market size estimates & forecasts, 2018 - 2030 (USD Billion)
- Fig. 20 North America Social Commerce Market Outlook and Market Share by Country, 2022 & 2030 (USD Billion)
- Fig. 21 Europe Social Commerce Market Outlook and Market Share by Country, 2022 & 2030 (USD Billion)
- Fig. 22 Asia Pacific Social Commerce Market Outlook and Market Share by Country, 2022 & 2030 (USD Billion)
- Fig. 23 Latin America Social Commerce Market Outlook and Market Share by Country, 2022 & 2030 (USD Billion)
- Fig. 24 Middle East & Africa Social Commerce Market Outlook and Market Share by Country, 2022 & 2030 (USD Billion)
Social Commerce Market Growth & Trends:
The global social commerce market size is anticipated to reach USD 6,243.94 billion by 2030, and it is set to expand at 31.6% CAGR from 2023 to 2030, according to a new study by Grand View Research, Inc. Growing ease of online purchases is considered the most significant factor driving social commerce demand. Combining entertainment with impulsive purchasing habits continues to drive social commerce. It provides brands, and retailers with a new medium, which holds enormous potential for value generation.
The growing use of the internet for advertising practices has revolutionized the business model of various companies. Moreover, it has also created alternate revenue streams. The easy availability of high-speed and affordable internet services for customers offers marketers a new channel to reach out to their target audience. This has led to the rise of influencer marketing practices. Brands have developed more individualized advertising campaigns, improving the client experience. Their commercial relationships continue to scale by utilizing these marketing techniques.
A survey organized by the influencer marketing hub suggested that more than 40% of the participants have made at least one purchase as a result of social media company postings or influencer content. The fact that influencers can help organizations achieve key marketing goals including engagement, sales, high-quality content, and brand awareness, which in turn drives the significant demand for influencer marketing.With the upsurge in influencer marketing, Instagram shopping brands are seen leveraging these individuals to create awareness and validation for their products and services.
Furthermore, the growing popularity of the live-stream shopping trend is expected to drive market growth during the forecast period. Before the pandemic, the 'shoppable video' was well-known in China. Furthermore, COVID-19 brought with it a live commerce experience that has led to a resurgence in this method of shopping. The live shopping experience most closely resembles in-person shopping. Through this, buyers can watch people try products in real-time, allowing the brand to get feedback instantly. The pandemic accelerated the adoption of live stream shopping, giving ample opportunity for it to reach the untapped markets.
Social Commerce Market Report Highlights:
- B2C segment dominated the market in 2022 and is expected to continue dominance with a shift in consumer mindset and rising digitization contribute
- The personal & beauty care segment is expected to grow at a high pace during 2022 due to offerings such as cashback, discounts, same-day or next-day deliveries, EMI options by social commerce platforms
- Asia Pacific is anticipated to grow at a healthy CAGR of 33.1% over the forecast period. This growth is attributable to the proliferation of the internet and smartphones in the region
Table of Contents
Chapter 1 Methodology and Scope
- 1.1 Market Segmentation & Scope
- 1.2 Information Procurement
- 1.2.1 Purchased Database
- 1.2.2 Gvr's Internal Database
- 1.2.3 Secondary Sources & Third-Party Perspective
- 1.2.4 Primary Research
- 1.3 Information Analysis
- 1.3.1 Data Analysis Models
- 1.4 Market Formulation And Data Visualization
- 1.5 Data Validation And Publishing
Chapter 2 Executive Summary
- 2.1 Executive Summary
- 2.2 Market Outlook
- 2.3 Social Commerce Market, 2018 - 2030
Chapter 3 Market Variables, Trends & Scope
- 3.1 Social Commerce Market - Market Size And Growth Prospects
- 3.2 Industry Value Chain Analysis
- 3.2.1 Market Driver Analysis
- 3.2.1.1 Rise Of Social Media And E-Commerce
- 3.2.1.2 Shift In Consumer Mindset
- 3.2.2 Market Restraint Analysis
- 3.2.2.1 Privacy Concerns Over Gathering And Using Personal Data
- 3.2.3 Market Opportunity Analysis
- 3.2.3.1 Emergence Of Big Data Analytics And Ai In Social Commerce
- 3.2.1 Market Driver Analysis
- 3.3 Social Commerce Market Penetration & Growth Prospect Mapping (Key Opportunity Prioritized)
- 3.4 Business Environmental Analysis Tools
- 3.4.1 Industry Analysis - Porter's Five Forces
- 3.4.2 Pest Analysis
- 3.5 Consumer Behavior Analysis: Effect Of Social Commerce On Consumer Behavior
- 3.6 Role Of Influencers In The Social Commerce Market
Chapter 4 Business Model Estimates And Trend Analysis
- 4.1 Market Size Estimates & Forecasts And Trend Analysis, 2018 - 2030 (USD Billion)
- 4.2 Business Model Analysis & Market Share, 2022 & 2030 (USD Billion)
- 4.3 Business To Consumer (B2c)
- 4.3.1 Business To Consumer (B2c) Market, 2018 - 2030
- 4.3.1.1 Business To Consumer (B2c) Market, By Region, 2018 - 2030
- 4.3.1 Business To Consumer (B2c) Market, 2018 - 2030
- 4.4 Business To Business (B2b)
- 4.4.1 Business To Business (B2b) Market, 2018 - 2030
- 4.4.1.1 Business To Business (B2b) Market, By Region, 2018 - 2030
- 4.4.1 Business To Business (B2b) Market, 2018 - 2030
- 4.5 Consumer To Consumer (C2c)
- 4.5.1 Consumer To Consumer (C2c) Market, 2018 - 2030
- 4.5.1.1 Consumer To Consumer (C2c) Market, By Region, 2018 - 2030
- 4.5.1 Consumer To Consumer (C2c) Market, 2018 - 2030
Chapter 5 Product Type Estimates And Trend Analysis
- 5.1 Market Size Estimates & Forecasts And Trend Analysis, 2018 - 2030 (USD Billion)
- 5.2 Product Type Analysis & Market Share, 2022 & 2030 (USD Billion)
- 5.3 Personal & Beauty Care
- 5.3.1 Personal & Beauty Care Market, 2018 - 2030
- 5.3.1.1 Personal & Beauty Care Market, By Region, 2018 - 2030
- 5.3.1 Personal & Beauty Care Market, 2018 - 2030
- 5.4 Apparel
- 5.4.1 Apparel Market, 2018 - 2030
- 5.4.1.1 Apparel Market, By Region, 2018 - 2030
- 5.4.1 Apparel Market, 2018 - 2030
- 5.5 Accessories
- 5.5.1 Accessories Market, 2018 - 2030
- 5.5.1.1 Accessories Market, By Region, 2018 - 2030
- 5.5.1 Accessories Market, 2018 - 2030
- 5.6 Home Products
- 5.6.1 Home Products Market, 2018 - 2030
- 5.6.1.1 Home Products Market, By Region, 2018 - 2030
- 5.6.1 Home Products Market, 2018 - 2030
- 5.7 Health Supplements
- 5.7.1 Health Supplements Market, 2018 - 2030
- 5.7.1.1 Health Supplements Market, By Region, 2018 - 2030
- 5.7.1 Health Supplements Market, 2018 - 2030
- 5.8 Food & Beverage
- 5.8.1 Food & Beverage Market, 2018 - 2030
- 5.8.1.1 Food & Beverage Market, By Region, 2018 - 2030
- 5.8.1 Food & Beverage Market, 2018 - 2030
- 5.9 Others
- 5.9.1 Others Market, 2018 - 2030
- 5.9.1.1 Others Market, By Region, 2018 - 2030
- 5.9.1 Others Market, 2018 - 2030
Chapter 5 Platform/Sales Channel Estimates And Trend Analysis
- 5.1 Market Size Estimates & Forecasts And Trend Analysis, 2018 - 2030 (USD Billion)
- 5.2 Platform/Sales Channel Analysis & Market Share, 2022 & 2030 (USD Billion)
- 5.3 Video Commerce (Live Stream + Prerecorded)
- 5.3.1 Video Commerce (Live Stream + Prerecorded) Market, 2018 - 2030
- 5.3.1.1 Video Commerce (Live Stream + Prerecorded) Market, By Region, 2018 - 2030
- 5.3.1 Video Commerce (Live Stream + Prerecorded) Market, 2018 - 2030
- 5.4 Social Network-Led Commerce
- 5.4.1 Social Network-Led Commerce Market, 2018 - 2030
- 5.4.1.1 Social Network-Led Commerce Market, By Region, 2018 - 2030
- 5.4.1 Social Network-Led Commerce Market, 2018 - 2030
- 5.5 Social Reselling
- 5.5.1 Social Reselling Market, 2018 - 2030
- 5.5.1.1 Social Reselling Market, By Region, 2018 - 2030
- 5.5.1 Social Reselling Market, 2018 - 2030
- 5.6 Group Buying
- 5.6.1 Group Buying Market, 2018 - 2030
- 5.6.1.1 Group Buying Market, By Region, 2018 - 2030
- 5.6.1 Group Buying Market, 2018 - 2030
- 5.7 Product Review Platforms
- 5.7.1 Product Review Platforms Market, 2018 - 2030
- 5.7.1.1 Product Review Platforms Market, By Region, 2018 - 2030
- 5.7.1 Product Review Platforms Market, 2018 - 2030
Chapter 6 Regional Estimates & Trend Analysis
- 6.1 Regional Market Size Estimates & Forecasts, 2018 - 2030 (USD Billion)
- 6.2 North America
- 6.2.1 North America Social Commerce Market, 2018 - 2030 (USD Billion)
- 6.2.2 North America Social Commerce Market, By Business Model, 2018 - 2030 (USD Billion)
- 6.2.3 North America Social Commerce Market, By Product Type, 2018 - 2030 (USD Billion)
- 6.2.4 U.S. Social Commerce Market, 2018 - 2030 (USD Billion)
- 6.2.5 U.S. Social Commerce Market, By Business Model, 2018 - 2030 (USD Billion)
- 6.2.6 U.S. Social Commerce Market, By Product Type, 2018 - 2030 (USD Billion)
- 6.2.7 U.S. Social Commerce Market, By Platform/Sales Channel, 2018 - 2030 (USD Billion)
- 6.2.8 Canada Social Commerce Market, 2018 - 2030 (USD Billion)
- 6.2.9 Canada Social Commerce Market, By Business Model, 2018 - 2030 (USD Billion)
- 6.2.10 Canada Social Commerce Market, By Product Type, 2018 - 2030 (USD Billion)
- 6.2.11 Canada Social Commerce Market, By Platform/Sales Channel, 2018 - 2030 (USD Billion)
- 6.3 Europe
- 6.3.1 Europe Social Commerce Market, 2018 - 2030 (USD Billion)
- 6.3.2 Europe Social Commerce Market, By Business Model, 2018 - 2030 (USD Billion)
- 6.3.3 Europe Social Commerce Market, By Product Type, 2018 - 2030 (USD Billion)
- 6.3.4 Europe Social Commerce Market, By Platform/Sales Channel, 2018 - 2030 (USD Billion)
- 6.3.5 U.K. Social Commerce Market, 2018 - 2030 (USD Billion)
- 6.3.6 U.K. Social Commerce Market, By Business Model, 2018 - 2030 (USD Billion)
- 6.3.7 U.K. Social Commerce Market, By Product Type, 2018 - 2030 (USD Billion)
- 6.3.8 U.K. Social Commerce Market, By Platform/Sales Channel, 2018 - 2030 (USD Billion)
- 6.3.9 Germany Social Commerce Market, 2018 - 2030 (USD Billion)
- 6.3.10 Germany Social Commerce Market, By Business Model, 2018 - 2030 (USD Billion)
- 6.3.11 Germany Social Commerce Market, By Product Type, 2018 - 2030 (USD Billion)
- 6.3.12 Germany Social Commerce Market, By Platform/Sales Channel, 2018 - 2030 (USD Billion)
- 6.3.13 France Social Commerce Market, 2018 - 2030 (USD Billion)
- 6.3.14 France Social Commerce Market, By Business Model, 2018 - 2030 (USD Billion)
- 6.3.15 France Social Commerce Market, By Product Type, 2018 - 2030 (USD Billion)
- 6.3.16 France Social Commerce Market, By Platform/Sales Channel, 2018 - 2030 (USD Billion)
- 6.4 Asia Pacific
- 6.4.1 Asia Pacific Social Commerce Market, 2018 - 2030 (USD Billion)
- 6.4.2 Asia Pacific Social Commerce Market, By Business Model, 2018 - 2030 (USD Billion)
- 6.4.3 Asia Pacific Social Commerce Market, By Product Type, 2018 - 2030 (USD Billion)
- 6.4.4 Asia Pacific Social Commerce Market, By Platform/Sales Channel, 2018 - 2030 (USD Billion)
- 6.4.5 China Social Commerce Market, 2018 - 2030 (USD Billion)
- 6.4.6 China Social Commerce Market, By Business Model, 2018 - 2030 (USD Billion)
- 6.4.7 China Social Commerce Market, By Product Type, 2018 - 2030 (USD Billion)
- 6.4.8 China Social Commerce Market, By Platform/Sales Channel, 2018 - 2030 (USD Billion)
- 6.4.9 India Social Commerce Market, 2018 - 2030 (USD Billion)
- 6.4.10 India Social Commerce Market, By Business Model, 2018 - 2030 (USD Billion)
- 6.4.11 India Social Commerce Market, By Product Type, 2018 - 2030 (USD Billion)
- 6.4.12 India Social Commerce Market, By Platform/Sales Channel, 2018 - 2030 (USD Billion)
- 6.4.13 Japan Social Commerce Market, 2018 - 2030 (USD Billion)
- 6.4.14 Japan Social Commerce Market, By Business Model, 2018 - 2030 (USD Billion)
- 6.4.15 Japan Social Commerce Market, By Product Type, 2018 - 2030 (USD Billion)
- 6.4.16 Japan Social Commerce Market, By Platform/Sales Channel, 2018 - 2030 (USD Billion)
- 6.4.17 Australia Social Commerce Market, 2018 - 2030 (USD Billion)
- 6.4.18 Australia Social Commerce Market, By Business Model, 2018 - 2030 (USD Billion)
- 6.4.19 Australia Social Commerce Market, By Product Type, 2018 - 2030 (USD Billion)
- 6.4.20 Australia Social Commerce Market, By Platform/Sales Channel, 2018 - 2030 (USD Billion)
- 6.4.21 Indonesia Social Commerce Market, 2018 - 2030 (USD Billion)
- 6.4.22 Indonesia Social Commerce Market, By Business Model, 2018 - 2030 (USD Billion)
- 6.4.23 Indonesia Social Commerce Market, By Product Type, 2018 - 2030 (USD Billion)
- 6.4.24 Indonesia Social Commerce Market, By Platform/Sales Channel, 2018 - 2030 (USD Billion)
- 6.4.25 Singapore Social Commerce Market, By Business Model, 2018 - 2030 (USD Billion)
- 6.4.26 Singapore Social Commerce Market, By Product Type, 2018 - 2030 (USD Billion)
- 6.4.27 Singapore Social Commerce Market, By Platform/Sales Channel, 2018 - 2030 (USD Billion)
- 6.4.28 South Korea Social Commerce Market, 2018 - 2030 (USD Billion)
- 6.4.29 South Korea Social Commerce Market, By Business Model, 2018 - 2030 (USD Billion)
- 6.4.30 South Korea Social Commerce Market, By Product Type, 2018 - 2030 (USD Billion)
- 6.4.31 South Korea Social Commerce Market, By Platform/Sales Channel, 2018 - 2030 (USD Billion)
- 6.4.32 Thailand Social Commerce Market, 2018 - 2030 (USD Billion)
- 6.4.33 Thailand Social Commerce Market, By Business Model, 2018 - 2030 (USD Billion)
- 6.4.34 Thailand Social Commerce Market, By Product Type, 2018 - 2030 (USD Billion)
- 6.4.35 Thailand Social Commerce Market, By Platform/Sales Channel, 2018 - 2030 (USD Billion)
- 6.4.36 Philippines Social Commerce Market, 2018 - 2030 (USD Billion)
- 6.4.37 Philippines Social Commerce Market, By Business Model, 2018 - 2030 (USD Billion)
- 6.4.38 Philippines Social Commerce Market, By Product Type, 2018 - 2030 (USD Billion)
- 6.4.39 Philippines Social Commerce Market, By Platform/Sales Channel, 2018 - 2030 (USD Billion)
- 6.4.41 Vietnam Social Commerce Market, 2018 - 2030 (USD Billion)
- 6.4.42 Vietnam Social Commerce Market, By Business Model, 2018 - 2030 (USD Billion)
- 6.4.43 Vietnam Social Commerce Market, By Product Type, 2018 - 2030 (USD Billion)
- 6.4.43 Vietnam Social Commerce Market, By Platform/Sales Channel, 2018 - 2030 (USD Billion)
- 6.4.44 Malaysia Social Commerce Market, 2018 - 2030 (USD Billion)
- 6.4.45 Malaysia Social Commerce Market, By Business Model, 2018 - 2030 (USD Billion)
- 6.4.46 Malaysia Social Commerce Market, By Product Type, 2018 - 2030 (USD Billion)
- 6.4.47 Malaysia Social Commerce Market, By Platform/Sales Channel, 2018 - 2030 (USD Billion)
- 6.5 Latin America
- 6.5.1 Latin America Social Commerce Market, 2018 - 2030 (USD Billion)
- 6.5.2 Latin America Social Commerce Market, By Business Model, 2018 - 2030 (USD Billion)
- 6.5.3 Latin America Social Commerce Market, By Product Type, 2018 - 2030 (USD Billion)
- 6.5.4 Latin America Social Commerce Market, By Platform/Sales Channel, 2018 - 2030 (USD Billion)
- 6.5.5 Brazil Social Commerce Market, 2018 - 2030 (USD Billion)
- 6.5.6 Brazil Social Commerce Market, By Business Model, 2018 - 2030 (USD Billion)
- 6.5.7 Brazil Social Commerce Market, By Product Type, 2018 - 2030 (USD Billion)
- 6.5.8 Brazil Social Commerce Market, By Platform/Sales Channel, 2018 - 2030 (USD Billion)
- 6.5.9 Mexico Social Commerce Market, 2018 - 2030 (USD Billion)
- 6.5.10 Mexico Social Commerce Market, By Business Model, 2018 - 2030 (USD Billion)
- 6.5.11 Mexico Social Commerce Market, By Product Type, 2018 - 2030 (USD Billion)
- 6.5.12 Mexico Social Commerce Market, By Platform/Sales Channel, 2018 - 2030 (USD Billion)
- 6.6 Middle East & Africa
- 6.6.1 Middle East & Africa Social Commerce Market, 2018 - 2030 (USD Billion)
- 6.6.2 Middle East & Africa Social Commerce Market, By Business Model, 2018 - 2030 (USD Billion)
- 6.6.3 Middle East & Africa Social Commerce Market, By Product Type, 2018 - 2030 (USD Billion)
- 6.6.4 Middle East & Africa Social Commerce Market, By Platform/Sales Channel, 2018 - 2030 (USD Billion)
Chapter 7 Competitive Landscape
- 7.1 Company Profiles
- 7.2 Etsy, Inc.
- 7.2.1 Company Overview
- 7.2.2 Financial Performance
- 7.2.3 Product Benchmarking
- 7.2.4 Recent Developments
- 7.3 Fashnear Technologies Private Limited (Meesho)
- 7.3.1 Company Overview
- 7.3.2 Financial Performance
- 7.3.3 Product Benchmarking
- 7.3.4 Recent Developments
- 7.4 Pinduoduo Inc.
- 7.4.1 Company Overview
- 7.4.2 Financial Performance
- 7.4.3 Product Benchmarking
- 7.4.4 Recent Developments
- 7.5 Pinterest, Inc.
- 7.5.1 Company Overview
- 7.5.2 Financial Performance
- 7.5.3 Product Benchmarking
- 7.5.4 Recent Developments
- 7.6 Poshmark
- 7.6.1 Company Overview
- 7.6.2 Financial Performance
- 7.6.3 Product Benchmarking
- 7.6.4 Recent Developments
- 7.7 Roposo
- 7.7.1 Company Overview
- 7.7.2 Financial Performance
- 7.7.3 Product Benchmarking
- 7.7.4 Recent Developments
- 7.8 Snap, Inc.
- 7.8.1 Company Overview
- 7.8.2 Financial Performance
- 7.8.3 Product Benchmarking
- 7.8.4 Recent Developments
- 7.9 Taobao
- 7.9.1 Company Overview
- 7.9.2 Financial Performance
- 7.9.3 Product Benchmarking
- 7.9.4 Recent Developments
- 7.10 Tiktok (Douyin)
- 7.10.1 Company Overview
- 7.10.2 Financial Performance
- 7.10.3 Product Benchmarking
- 7.10.4 Recent Developments
- 7.11 Trell Shop
- 7.11.1 Company Overview
- 7.11.2 Financial Performance
- 7.11.3 Product Benchmarking
- 7.12 Twitter, Inc.
- 7.12.1 Company Overview
- 7.12.2 Financial Performance
- 7.12.3 Product Benchmarking
- 7.12.4 Recent Developments
- 7.13 Wechat (Weixin)
- 7.13.1 Company Overview
- 7.13.2 Financial Performance
- 7.13.3 Product Benchmarking
- 7.13.4 Recent Developments
- 7.14 Xiaohongshu
- 7.14.1 Company Overview
- 7.14.2 Financial Performance
- 7.14.3 Product Benchmarking
- 7.14.4 Recent Developments
- 7.15 Yunji Sharing Technology Co., Ltd.
- 7.15.1 Company Overview
- 7.15.2 Financial Performance
- 7.15.3 Product Benchmarking
- 7.15.4 Recent Developments