|
|
市場調査レポート
商品コード
1114160
アドベンチャーツーリズムの市場規模、シェア、動向分析レポート:アクティビティタイプ別(ハード、ソフト)、グループ別(ソロ、カップル、ファミリー、グループ)、予約モード別、年齢層別、地域別、セグメント別予測、2022年~2030年Adventure Tourism Market Size, Share & Trends Analysis Report By Activity Type (Hard, Soft), By Group (Solo, Couples, Family, Groups), By Booking Mode, By Age Group, By Region, And Segment Forecasts, 2022 - 2030 |
||||||
|
|
|||||||
|
● お客様のご希望に応じて、既存データの加工や未掲載情報(例:国別セグメント)の追加などの対応が可能です。 詳細はお問い合わせください。 |
|||||||


| アドベンチャーツーリズムの市場規模、シェア、動向分析レポート:アクティビティタイプ別(ハード、ソフト)、グループ別(ソロ、カップル、ファミリー、グループ)、予約モード別、年齢層別、地域別、セグメント別予測、2022年~2030年 |
|
出版日: 2022年07月12日
発行: Grand View Research
ページ情報: 英文 80 Pages
納期: 2~10営業日
|
- 全表示
- 概要
- 図表
- 目次
アドベンチャー・ツーリズムの市場成長と動向
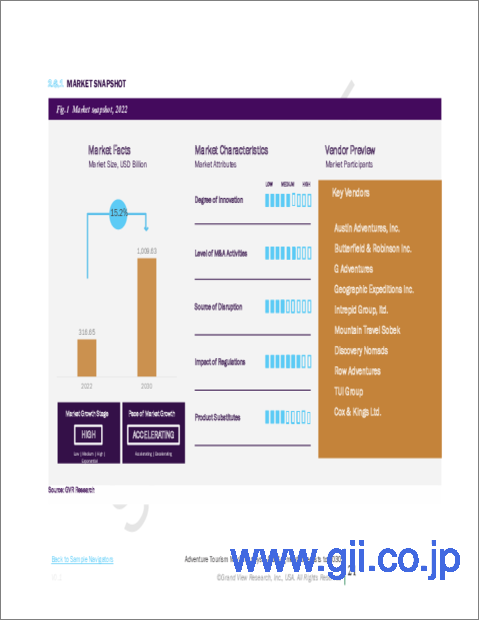
グランドビューリサーチ社の最新レポートによると、世界のアドベンチャーツーリズム市場規模は、2030年までに1兆96億米ドルに達すると推定されています。
同市場は2022年から2030年にかけてCAGR15.2%で拡大すると予測されています。旅行関連コストの低下、所得の増加、可能な観光アクティビティの多様化により、世界のアドベンチャーツーリズム事業は急速に拡大し、関連支出および訪問者数は近年劇的に増加しています。アドベンチャー・ツーリズムとは、ラフティング、トレッキング、サイクリング、ケイビングなど、様々な冒険的活動を行い、アウトドアや異文化に触れる国内外旅行を指します。アドベンチャー・ツーリズムは、その多様性、経済支援能力、持続可能な実践の促進から、世界中で従来のマスツーリズムよりもますます成長し、人気を集めています。
急速な都市化、可処分所得の増加、ソーシャルメディアの影響、手頃な価格の航空券などにより、本格的で個性的な旅行体験へのニーズが高まっていることが、市場拡大の主な要因となっています。また、旅行会社は、スマートフォンからアクセスできるスピーディーでユーザーフレンドリーなモバイルウェブサイトを導入しています。アドベンチャーツーリズムの需要は世界的に高まっています。これは、主要な業界参加者がマーケティング会社と協力し、オンラインマーケティングを通じて高価値の顧客を獲得しているためです。また、アドベンチャーツーリズムは雇用機会を創出し、地域の発展に寄与することから、各国の政府機関も推進しています。このような背景から、近い将来、アドベンチャーツーリズムの市場規模が拡大することが予想されます。しかし、常に進化する人口統計、悪天候、航空交通の制限につながる地政学的緊張は、市場成長の妨げになると予想されます。
COVID-19の流行は、冒険旅行と観光産業に大きな世界的影響を及ぼしました。ウイルスの蔓延を阻止するためにとられた大規模な封じ込めと緩和措置は、旅行と観光に大きな悪影響を及ぼしました。航空旅行、ビザ、検疫の規則が急速に変更され、特に高齢者や裕福な旅行者の間で信頼性に長期的な影響が及ぶリスクはまだかなり残っています。これは、各国政府が徐々に制約を緩和する方向に向かっているにもかかわらず、言えることです。ワールド・ツーリズム・バロメーターのデータによると、今年上半期の海外からの旅行者数は65%減少しました。
アドベンチャー・ツーリズムは、世界的に最も急速に成長している観光分野の一つであり、予測期間中に世界中で利益を生む成長を遂げると予想されます。今回の震災では、多くの人が健康やサイクリング、ウォーキング、トレッキング、水泳などのアウトドア活動を優先させたことから、アドベンチャー・ツーリズムは国内市場の潜在的な成長分野として認識されています。2021年の売上シェアは、ソフトアドベンチャーツーリズム部門が約65.0%と最も大きいです。このセグメントの成長は、トレッキング、ハイキング、キャンプ、サイクリングなどのソフトアドベンチャー活動の採用が増加していることを理由としています。高齢者層は、ソフトアドベンチャー旅行を選択する主な年齢層の1つとなっています。また、さまざまな国のさまざまな都市でソフトアドベンチャーを楽しむことができ、魅力的な景観があることから、ソフトアドベンチャー観光に大きな影響を与えることが予想されます。
グループ別では、カップルセグメントが市場を独占し、2021年には40.0%超の最大の収益シェアを獲得しました。同セグメントは近い将来、顕著な成長を示すと予想されます。この成長は主に、可処分所得の増加や文化的・屋外活動への欲求の高まりによるものです。カップル旅行は、海外旅行の利便性の向上や、カップルをターゲットにしたパッケージ旅行の増加により、過去100年にわたり増加し続けています。この市場セグメントの拡大は、この年齢層の人々が経済的に安定しており、さまざまな冒険的な活動や体験に参加する熱意を持っていることに起因しています。
2021年には、直接予約モードセグメントが約65.0%のシェアを占めています。カスタマイズされた体験と容易さのために、冒険旅行者や旅行者の数は、これらのチャネルを介して直接ツアーやパッケージを予約することを選択し、それによってセグメントの発展を推進しています。また、オンラインキャンペーンやソーシャルメディア広告など、市場参加者による重要なアクションが潜在顧客を引き付け、直接予約チャネルを通じてツアーパッケージを予約するよう促すと予想されます。51~60歳の年齢層セグメントは市場を独占し、2021年には25.0%超の収益シェアを獲得しました。この年齢層の冒険旅行者の数が徐々に増加していることが、このセグメントの成長を促進する主な要因です。ソフトアドベンチャーに対する消費者の需要や、旅行や観光にお金をかける準備ができていることから、この分野も近い将来に成長すると予測されています。さらに、ソーシャルメディアは、観光客にさまざまな場所を訪れ、より頻繁に旅行するよう促すことができるため、この業界は恩恵を受けると予想されます。
欧州は、同地域の経済環境の強化、同地域の所得水準の向上、旅行・観光を促進する政府プログラムなどにより、2021年の市場シェアが最も高いものとなっています。CBI外務省によると、年間、欧州では1億件の旅行が記録されています。欧州の人々は新しい場所を発見する感覚を好むため、アドベンチャー・ツーリズムは高い需要があります。
アジア太平洋地域では、市場は観光客全体の冒険旅行の意識の高まり、観光を促進するために民間および公共の関係のために政府のイニシアチブの数の上昇、および地域の市場プレーヤーによって取られた主要なイニシアチブによって、予測期間にわたって16.4%のCAGRを示すと予想されています。数多くの国内外の冒険旅行者は、レジャーや冒険活動の様々なために地域に存在する冒険的な場所に駆動されています。ソーシャルメディア・ネットワーキングの増加、旅行ブログとビデオ撮影の受け入れ拡大が、地域市場に対する旅行者の関心をさらに高めると予想されます。
アドベンチャーツーリズム市場のレポートハイライト
ソフトアドベンチャー観光分野が市場を独占し、2021年には約65.0%のシェアを占めました。
単独アドベンチャー旅行者セグメントは、予測期間中に15.2%のCAGRを記録すると予想されます。これは、主要な市場プレーヤーによって取られた主要なイニシアチブに起因することができます。
ダイレクトブッキングセグメントは、没入型体験、次回予約時のオファー、効果的なツアー体験など、企業が提供する主要な利点により、2021年には約65.0%の最大の収益シェアを獲得しました。
経済環境の強化、地域の所得水準の向上、旅行・観光を促進するための政府の施策により、2021年の市場シェアは欧州が約40.0%と最大となった
目次
第1章 調査手法と範囲
- 市場セグメンテーションと範囲
- 市場の定義
- 情報調達
- 購入したデータベース
- GVRの内部データベース
- 二次活動の種類と第三者の視点
- 1次調査
- 情報分析
- データ分析モデル
- 市場形成とデータ可視化
- データの検証と公開
第2章 エグゼクティブサマリー
- 市場の見通し
- 活動の種類見通し
- グループの見通し
- 予約モードの見通し
- 年齢層の見通し
- 地域の見通し
第3章 アドベンチャーツーリズム市場の変数、動向、範囲
- 市場系列の見通し
- 浸透と成長の見通しのマッピング
- バリューチェーン分析
- 技術概要
- 規制の枠組み
- 市場力学
- 市場促進要因分析
- 市場抑制分析
- 業界の課題
- 事業環境分析
- ポーターの分析
- 新規参入業者の脅威
- 供給企業の交渉力
- 買い手の交渉力
- 代替品の脅威
- 競争企業間の敵対関係
- PESTLE分析
- 政治情勢
- 環境情勢
- 社会情勢
- テクノロジー情勢
- 経済情勢
- 法的情勢
- 主要取引と戦略的提携分析
- ポーターの分析
- 市場参入戦略
- COVID-19影響分析
第4章 消費者行動分析
- 人口統計分析
- 消費者の動向と好み
- 購入決定に影響を与える要因
- 消費者活動タイプの採用
- 所見と推奨事項
第5章 アドベンチャーツーリズム市場:アクティビティタイプの推定・動向分析
- 活動タイプの変動分析と市場シェア、2021年と2030年
- 難しい
- 柔らかい
- その他
第6章 アドベンチャーツーリズム市場:グループの推定・動向分析
- グループの変動分析と市場シェア、2021年と2030年
- ソロ
- カップル
- 家族
- グループ
第7章 アドベンチャーツーリズム市場:予約モードの推定・動向分析
- 予約モードの変動分析と市場シェア、2021年と2030年
- 直接
- 旅行代理店
- マーケットプレース予約
第8章 アドベンチャーツーリズム市場:年齢層の推定・動向分析
- 年齢層の変動分析と市場シェア、2021年と2030年
- 28歳以下
- 29-40
- 41-50
- 51-60
- 61-70
- 71歳以上
第9章 アドベンチャーツーリズム市場:地域推定・動向分析
- 地域別変動分析と市場シェア、2021年と2030年
- 北米
- 米国
- カナダ
- メキシコ
- 欧州
- 英国
- ドイツ
- フランス
- イタリア
- スペイン
- アジア太平洋地域
- 中国
- インド
- 日本
- 韓国
- オーストラリア
- 中南米
- ブラジル
- 中東とアフリカ
- 南アフリカ
第10章 競合分析
- 主なプレーヤーの最近の展開とその影響
- COVID-19パンデミック時に主要企業が採用した戦略
- ベンダー情勢
- 公開会社
- 会社の市況分析
- プライベートカンパニー
- 主要な新興企業/テクノロジーディスラプター/イノベーターのリスト
第11章 企業プロファイル
- Austin Adventures, Inc.
- 会社概要
- 財務実績
- 活動タイプのベンチマーク
- 戦略的イニシアチブ
- Butterfield &Robinson Inc.
- 会社概要
- 財務実績
- 活動タイプのベンチマーク
- 戦略的イニシアチブ
- G Adventures
- 会社概要
- 財務実績
- 活動タイプのベンチマーク
- 戦略的イニシアチブ
- Geographic Expeditions Inc.
- 会社概要
- 財務実績
- 活動タイプのベンチマーク
- 戦略的イニシアチブ
- Intrepid Group, ltd
- 会社概要
- 財務実績
- 活動タイプのベンチマーク
- 戦略的イニシアチブ
- Mountain Travel Sobek
- 会社概要
- 財務実績
- 活動タイプのベンチマーク
- 戦略的イニシアチブ
- Discovery Nomads
- 会社概要
- 財務実績
- 活動タイプのベンチマーク
- 戦略的イニシアチブ
- Row Adventures
- 会社概要
- 財務実績
- 活動タイプのベンチマーク
- 戦略的イニシアチブ
- Tui Group
- 会社概要
- 財務実績
- 活動タイプのベンチマーク
- 戦略的イニシアチブ
- Cox &Kings Ltd.
- 会社概要
- 財務実績
- 活動タイプのベンチマーク
- 戦略的イニシアチブ
List of Tables
- 1. Adventure Tourism Market - Key Market Driver Analysis
- 2. Adventure Tourism Market - Key Market Restraint Analysis
- 3. Global Adventure Tourism Market Estimates And Forecast By Activity Type, 2017 - 2030 (USD Billion)
- 4. Global Adventure Tourism Market Estimates And Forecast By Group, 2017 - 2030 (USD Billion)
- 5. Global Adventure Tourism Market Estimates And Forecast By Booking Mode, 2017 - 2030 (USD Billion)
- 6. Global Adventure Tourism Market Estimates And Forecast By Age Group, 2017 - 2030 (USD Billion)
- 7. Global Adventure Tourism Market Estimates And Forecast By Hard, from 2017 - 2030 (USD Billion)
- 8. Global Adventure Tourism Market Estimates And Forecast By Soft, from 2017 - 2030 (USD Billion)
- 9. Global Adventure Tourism Market Estimates And Forecast By Others, from 2017 - 2030 (USD Billion)
- 10. Global Adventure Tourism Market Estimates And Forecast By Solo, from 2017 - 2030 (USD Billion)
- 11. Global Adventure Tourism Market Estimates And Forecast By Couples, from 2017 - 2030 (USD Billion)
- 12. Global Adventure Tourism Market Estimates And Forecast By Family, from 2017 - 2030 (USD Billion)
- 13. Global Adventure Tourism Market Estimates And Forecast By Groups, from 2017 - 2030 (USD Billion)
- 14. Global Adventure Tourism Market Estimates And Forecast By Direct, from 2017 - 2030 (USD Billion)
- 15. Global Adventure Tourism Market Estimates And Forecast By Travel Agent, from 2017 - 2030 (USD Billion)
- 16. Global Adventure Tourism Market Estimates And Forecast By Marketplace Booking, from 2017 - 2030 (USD Billion)
- 17. Global Adventure Tourism Market Estimates And Forecast By 28 and Under, from 2017 - 2030 (USD Billion)
- 18. Global Adventure Tourism Market Estimates And Forecast By 29-40, from 2017 - 2030 (USD Billion)
- 19. Global Adventure Tourism Market Estimates And Forecast By 41-50, from 2017 - 2030 (USD Billion)
- 20. Global Adventure Tourism Market Estimates And Forecast By 51-60, from 2017 - 2030 (USD Billion)
- 21. Global Adventure Tourism Market Estimates And Forecast By 61-70, from 2017 - 2030 (USD Billion)
- 22. Global Adventure Tourism Market Estimates And Forecast By 71 and Over, from 2017 - 2030 (USD Billion)
- 23. Global Adventure Tourism Market Estimates And Forecast, By Region 2017 - 2030 (USD Billion)
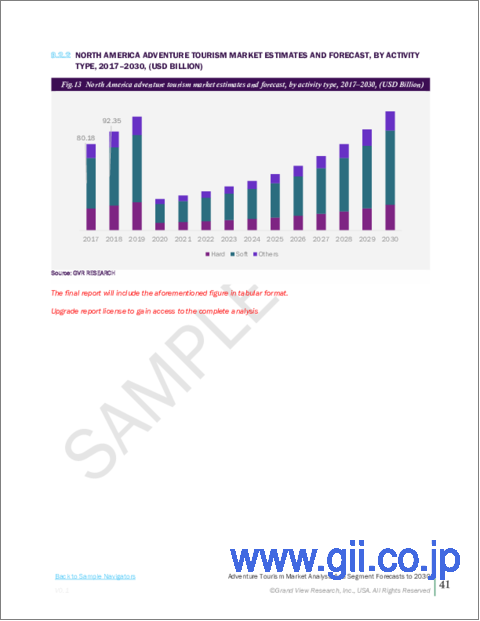
- 24. North America Adventure Tourism Market Estimates And Forecast, 2017 - 2030 (USD Billion)
- 25. North America Adventure Tourism Market Estimates And Forecast, By Activity Type, 2017 - 2030 (USD Billion)
- 26. North America Adventure Tourism Market Estimates And Forecast, By Group, 2017 - 2030 (USD Billion)
- 27. North America Adventure Tourism Market Estimates And Forecast, By Booking Mode, 2017 - 2030 (USD Billion)
- 28. North America Adventure Tourism Market Estimates And Forecast, By Age Group, 2017 - 2030 (USD Billion)
- 29. U.S. Adventure Tourism Market Estimates And Forecast, 2017 - 2030 (USD Billion)
- 30. U.S. Adventure Tourism Market Estimates And Forecast By Activity Type, 2017 - 2030 (USD Billion)
- 31. U.S. Adventure Tourism Market Estimates And Forecast By Group, 2017 - 2030 (USD Billion)
- 32. U.S. Adventure Tourism Market Estimates And Forecast By Booking Mode, 2017 - 2030 (USD Billion)
- 33. U.S. Adventure Tourism Market Estimates And Forecast By Age Group, 2017 - 2030 (USD Billion)
- 34. Canada Adventure Tourism Market Estimates And Forecast, 2017 - 2030 (USD Billion)
- 35. Canada Adventure Tourism Market Estimates And Forecast By Activity Type, 2017 - 2030 (USD Billion)
- 36. Canada Adventure Tourism Market Estimates And Forecast By Group, 2017 - 2030 (USD Billion)
- 37. Canada Adventure Tourism Market Estimates And Forecast By Booking Mode, 2017 - 2030 (USD Billion)
- 38. Canada Adventure Tourism Market Estimates And Forecast By Age Group, 2017 - 2030 (USD Billion)
- 39. Mexico Adventure Tourism Market Estimates And Forecast, 2017 - 2030 (USD Billion)
- 40. Mexico Adventure Tourism Market Estimates And Forecast By Activity Type, 2017 - 2030 (USD Billion)
- 41. Mexico Adventure Tourism Market Estimates And Forecast By Group, 2017 - 2030 (USD Billion)
- 42. Mexico Adventure Tourism Market Estimates And Forecast By Booking Mode, 2017 - 2030 (USD Billion)
- 43. Mexico Adventure Tourism Market Estimates And Forecast By Age Group, 2017 - 2030 (USD Billion)
- 44. Europe Adventure Tourism Market Estimates And Forecast, 2017 - 2030 (USD Billion)
- 45. Europe Adventure Tourism Market Estimates And Forecast By Activity Type, 2017 - 2030 (USD Billion)
- 46. Europe Adventure Tourism Market Estimates And Forecast By Group, 2017 - 2030 (USD Billion)
- 47. Europe Adventure Tourism Market Estimates And Forecast By Booking Mode, 2017 - 2030 (USD Billion)
- 48. Europe Adventure Tourism Market Estimates And Forecast By Age Group, 2017 - 2030 (USD Billion)
- 49. U.K. Adventure Tourism Market Estimates And Forecast, 2017 - 2030 (USD Billion)
- 50. U.K. Adventure Tourism Market Estimates And Forecast By Activity Type, 2017 - 2030 (USD Billion)
- 51. U.K. Adventure Tourism Market Estimates And Forecast By Group, 2017 - 2030 (USD Billion)
- 52. U.K. Adventure Tourism Market Estimates And Forecast By Booking Mode, 2017 - 2030 (USD Billion)
- 53. U.K. Adventure Tourism Market Estimates And Forecast By Age Group, 2017 - 2030 (USD Billion)
- 54. Germany Adventure Tourism Market Estimates And Forecast, 2017 - 2030 (USD Billion)
- 55. Germany Adventure Tourism Market Estimates And Forecast By Activity Type, 2017 - 2030 (USD Billion)
- 56. Germany Adventure Tourism Market Estimates And Forecast By Group, 2017 - 2030 (USD Billion)
- 57. Germany Adventure Tourism Market Estimates And Forecast By Booking Mode, 2017 - 2030 (USD Billion)
- 58. Germany Adventure Tourism Market Estimates And Forecast By Age Group, 2017 - 2030 (USD Billion)
- 59. France Adventure Tourism Market Estimates And Forecast, 2017 - 2030 (USD Billion)
- 60. France Adventure Tourism Market Estimates And Forecast By Activity Type, 2017 - 2030 (USD Billion)
- 61. France Adventure Tourism Market Estimates And Forecast By Group, 2017 - 2030 (USD Billion)
- 62. France Adventure Tourism Market Estimates And Forecast By Booking Mode, 2017 - 2030 (USD Billion)
- 63. France Adventure Tourism Market Estimates And Forecast By Age Group, 2017 - 2030 (USD Billion)
- 64. Italy Adventure Tourism Market Estimates And Forecast, 2017 - 2030 (USD Billion)
- 65. Italy Adventure Tourism Market Estimates And Forecast By Activity Type, 2017 - 2030 (USD Billion)
- 66. Italy Adventure Tourism Market Estimates And Forecast By Group, 2017 - 2030 (USD Billion)
- 67. Italy Adventure Tourism Market Estimates And Forecast By Booking Mode, 2017 - 2030 (USD Billion)
- 68. Italy Adventure Tourism Market Estimates And Forecast By Age Group, 2017 - 2030 (USD Billion)
- 69. Spain Adventure Tourism Market Estimates And Forecast, 2017 - 2030 (USD Billion)
- 70. Spain Adventure Tourism Market Estimates And Forecast By Activity Type, 2017 - 2030 (USD Billion)
- 71. Spain Adventure Tourism Market Estimates And Forecast By Group, 2017 - 2030 (USD Billion)
- 72. Spain Adventure Tourism Market Estimates And Forecast By Booking Mode, 2017 - 2030 (USD Billion)
- 73. Spain Adventure Tourism Market Estimates And Forecast By Age Group, 2017 - 2030 (USD Billion)
- 74. Asia Pacific Adventure Tourism Market Estimates And Forecast, 2017 - 2030 (USD Billion)
- 75. Asia Pacific Adventure Tourism Market Estimates And Forecast By Activity Type, 2017 - 2030 (USD Billion)
- 76. Asia Pacific Adventure Tourism Market Estimates And Forecast By Group, 2017 - 2030 (USD Billion)
- 77. Asia Pacific Adventure Tourism Market Estimates And Forecast By Booking Mode, 2017 - 2030 (USD Billion)
- 78. Asia Pacific Adventure Tourism Market Estimates And Forecast By Age Group, 2017 - 2030 (USD Billion)
- 79. China Adventure Tourism Market Estimates And Forecast, 2017 - 2030 (USD Billion)
- 80. China Adventure Tourism Market Estimates And Forecast By Activity Type, 2017 - 2030 (USD Billion)
- 81. China Adventure Tourism Market Estimates And Forecast By Group, 2017 - 2030 (USD Billion)
- 82. China Adventure Tourism Market Estimates And Forecast By Booking Mode, 2017 - 2030 (USD Billion)
- 83. China Adventure Tourism Market Estimates And Forecast By Age Group, 2017 - 2030 (USD Billion)
- 84. India Adventure Tourism Market Estimates And Forecast, 2017 - 2030 (USD Billion)
- 85. India Adventure Tourism Market Estimates And Forecast By Activity Type, 2017 - 2030 (USD Billion)
- 86. India Adventure Tourism Market Estimates And Forecast By Group, 2017 - 2030 (USD Billion)
- 87. India Adventure Tourism Market Estimates And Forecast By Booking Mode, 2017 - 2030 (USD Billion)
- 88. India Adventure Tourism Market Estimates And Forecast By Age Group, 2017 - 2030 (USD Billion)
- 89. Japan Adventure Tourism Market Estimates And Forecast, 2017 - 2030 (USD Billion)
- 90. Japan Adventure Tourism Market Estimates And Forecast By Activity Type, 2017 - 2030 (USD Billion)
- 91. Japan Adventure Tourism Market Estimates And Forecast By Group, 2017 - 2030 (USD Billion)
- 92. Japan Adventure Tourism Market Estimates And Forecast By Booking Mode, 2017 - 2030 (USD Billion)
- 93. Japan Adventure Tourism Market Estimates And Forecast By Age Group, 2017 - 2030 (USD Billion)
- 94. Australia Adventure Tourism Market Estimates And Forecast, 2017 - 2030 (USD Billion)
- 95. Australia Adventure Tourism Market Estimates And Forecast By Activity Type, 2017 - 2030 (USD Billion)
- 96. Australia Adventure Tourism Market Estimates And Forecast By Group, 2017 - 2030 (USD Billion)
- 97. Australia Adventure Tourism Market Estimates And Forecast By Booking Mode, 2017 - 2030 (USD Billion)
- 98. Australia Adventure Tourism Market Estimates And Forecast By Age Group, 2017 - 2030 (USD Billion)
- 99. South Korea Adventure Tourism Market Estimates And Forecast, 2017 - 2030 (USD Billion)
- 100. South Korea Adventure Tourism Market Estimates And Forecast By Activity Type, 2017 - 2030 (USD Billion)
- 101. South Korea Adventure Tourism Market Estimates And Forecast By Group, 2017 - 2030 (USD Billion)
- 102. South Korea Adventure Tourism Market Estimates And Forecast By Booking Mode, 2017 - 2030 (USD Billion)
- 103. South Korea Adventure Tourism Market Estimates And Forecast By Age Group, 2017 - 2030 (USD Billion)
- 104. Central & South America Adventure Tourism Market Estimates And Forecast, 2017 - 2030 (USD Billion)
- 105. Central & South America Adventure Tourism Market Estimates And Forecast By Activity Type, 2017 - 2030 (USD Billion)
- 106. Central & South America Adventure Tourism Market Estimates And Forecast By Group, 2017 - 2030 (USD Billion)
- 107. Central & South America Adventure Tourism Market Estimates And Forecast By Booking Mode, 2017 - 2030 (USD Billion)
- 108. Central & South America Adventure Tourism Market Estimates And Forecast By Age Group, 2017 - 2030 (USD Billion)
- 109. Brazil Adventure Tourism Market Estimates And Forecast, 2017 - 2030 (USD Billion)
- 110. Brazil Adventure Tourism Market Estimates And Forecast By Activity Type, 2017 - 2030 (USD Billion)
- 111. Brazil Adventure Tourism Market Estimates And Forecast By Group, 2017 - 2030 (USD Billion)
- 112. Brazil Adventure Tourism Market Estimates And Forecast By Booking Mode, 2017 - 2030 (USD Billion)
- 113. Brazil Adventure Tourism Market Estimates And Forecast By Age Group, 2017 - 2030 (USD Billion)
- 114. Middle East & Africa Adventure Tourism Market Estimates And Forecast, 2017 - 2030 (USD Billion)
- 115. Middle East & Africa Adventure Tourism Market Estimates And Forecast By Activity Type, 2017 - 2030 (USD Billion)
- 116. Middle East & Africa Adventure Tourism Market Estimates And Forecast By Group, 2017 - 2030 (USD Billion)
- 117. Middle East & Africa Adventure Tourism Market Estimates And Forecast By Booking Mode, 2017 - 2030 (USD Billion)
- 118. Middle East & Africa Adventure Tourism Market Estimates And Forecast By Age Group, 2017 - 2030 (USD Billion)
- 119. South Africa Adventure Tourism Market Estimates And Forecast, 2017 - 2030 (USD Billion)
- 120. South Africa Adventure Tourism Market Estimates And Forecast By Activity Type, 2017 - 2030 (USD Billion)
- 121. South Africa Adventure Tourism Market Estimates And Forecast By Group, 2017 - 2030 (USD Billion)
- 122. South Africa Adventure Tourism Market Estimates And Forecast By Booking Mode, 2017 - 2030 (USD Billion)
- 123. South Africa Adventure Tourism Market Estimates And Forecast By Age Group, 2017 - 2030 (USD Billion)
- 124. Vendor landscape
List of Figures
- 1. Adventure Tourism Market Snapshot
- 2. Adventure Tourism Market Segmentation & Scope
- 3. Adventure Tourism Market Penetration & Growth Prospect Mapping
- 4. Adventure Tourism Market Value Chain Analysis
- 5. Adventure Tourism Market Dynamics
- 6. Adventure Tourism Market Porter's Analysis
- 7. Adventure Tourism Market: Activity Type Movement Analysis
- 8. Adventure Tourism Market: Group Movement Analysis
- 9. Adventure Tourism Market: Booking Mode Movement Analysis
- 10. Adventure Tourism Market: Age Group Movement Analysis
- 11. Adventure Tourism Market: Regional Movement Analysis
Adventure Tourism Market Growth & Trends:
The global adventure tourism market size is estimated to reach USD 1,009.6 billion by 2030, according to a new report by Grand View Research, Inc. The market is expected to expand at a CAGR of 15.2% from 2022 to 2030. Due to declining travel-related costs, growing incomes, and a wider variety of possible tourist activities, the global adventure tourism business has experienced rapid expansion, with associated expenditure and visitor numbers rising dramatically in recent years. Adventure tourism covers domestic and international travel that includes a range of adventurous activities including rafting, trekking, cycling, and caving, among others, as well as exposure to the outdoors and different cultures. Adventure tourism is increasingly growing more and gaining popularity than traditional mass tourism all over the world because of its versatility, capacity to assist economies, and promotion of sustainable practices.
The growing need for an authentic and personalized travel experience, which is being driven by quick urbanization, rising disposable incomes, the influence of social media, and affordable airline tickets, are the key factors driving market expansion. Additionally, travel companies are introducing speedy, user-friendly mobile websites that are accessible on smartphones. The demand for adventure tourism is rising globally as a result of major industry participants collaborating with marketing companies to attract high-value clientele through online marketing. Government agencies in several countries are also promoting adventure tourism since it creates employment opportunities and benefits local development. This is further expected to drive the marker growth in near future. However, constantly evolving demographics, adverse weather conditions, and geopolitical tensions resulting in limited air traffic is expected to hinder the market growth.
The COVID-19 epidemic has had a significant global impact on the adventure travel and tourism industry. The extensive containment and mitigation measures taken to stop the virus's spread had a significant negative impact on travel and tourism. There is still a considerable risk of rapid changes to air travel, visa, and quarantine rules, as well as long-lasting confidence implications, especially among older and more wealthy visitors. This is true even though governments are increasingly moving toward a graduated relaxing of constraints. According to the World Tourism Barometer data, international visitor arrivals declined by 65% in the first half of the year.
The worldwide adventure tourism business is anticipated to become one of the fastest expanding tourist sectors, demonstrating profitable growth all over the world, during the course of the projection period. Given that many people prioritized their health and outdoor activities like cycling, walking, trekking and swimming during and after the lockdown, adventure tourism has been identified as a potential area for growth in the domestic market. The soft adventure tourism segment held the largest revenue share of around 65.0% in 2021. The growth of the segment is driven on account of rise in the adoption of soft adventure activities such as trekking, hiking, camping, and cycling among others. The older age group has become one of the main age groups choosing soft adventure travel. Additionally, large variety of soft adventure activities within different cities of countries and presence of attractive landscape is expected to have profound impact on the soft adventure tourism.
Based on group, the couples segment dominated the market and captured the largest revenue share of over 40.0% in 2021. The segment is expected to show prominent growth in near future. The growth is mainly driven due to increased disposable income and a growing desire for cultural and outdoor activities. Couple vacations have increased over the past century as a result of expanding international travel accessibility and the creation of package holidays targeted at couples. The expansion of this market segment is attributed to the fact that people in this age group are financially stable and have enthusiasm to partake in a variety of adventurous activities and experiences.
In 2021, the direct booking mode segment accounted for around 65.0% share in 2021. Due to the customized experience and ease, an increasing number of adventure visitors and travelers are choosing to book their tours and packages directly through these channels thereby driving the segment's development. Additionally, significant actions taken by market participants, including online campaigns and social media advertising, are anticipated to draw potential clients and encourage them to book their tour packages through direct booking channel. The 51-60 age group segment dominated the market and captured revenue share of over 25.0% in 2021. The progressive rise in the number of adventure travelers from this age range is the key factor fueling segment's growth. Due to consumer demand for soft adventures and readiness to spend money on travel and tourism, the sector is also projected to grow in the near future. Furthermore, the industry is anticipated to benefit from social media's ability to inspire tourists to visit a variety of locations and travel more frequently.
Europe accounted for the highest market share in 2021, due to a strengthening economic climate in the area, growing income levels regionally, and government programs to promote travel and tourism. Annually, 100 million travels are recorded in Europe, according to the CBI Ministry of Foreign Affairs. Since, Europeans like the feeling of discovering new places, adventure tourism is in high demand.
In Asia Pacific, the market is expected to witness a CAGR of 16.4% over the forecast period, driven by increasing awareness of adventure tourism across tourists, rise in the number of government initiatives to for private and public relationships to promote tourism, and key initiatives taken by regional market players. Numerous domestic and international adventure travelers are driven to adventurous places present in the region due to a variety of leisure and adventure activities. Increase in social media networking and growing acceptance of travel blogging and videography is further expected to pique the traveler's interest towards regional market.
Adventure Tourism Market Report Highlights:
- The soft adventure tourism segment dominated the market and accounted for around 65.0% share in 2021 driven by rising tourist inclination towards less or no risk adventure activities and rising inclination among elder age group
- The solo adventure travelers segment is expected to witness a CAGR of 15.2% over the forecast period. This can be attributed to key initiatives taken by leading market players
- The direct booking segment captured the largest revenue share of around 65.0% in 2021 on account of key benefits offered by companies such as immersive experience, offers on next bookings, and effective tour experience
- Due to a strengthening economic climate, growing income levels in the area, and government measures to promote travel and tourism, Europe accounted for the largest market share of around 40.0% in 2021
Table of Contents
Chapter 1. Methodology and Scope
- 1.1. Market Segmentation & Scope
- 1.2. Market Definition
- 1.3. Information Procurement
- 1.3.1. Purchased Database
- 1.3.2. GVR's Internal Database
- 1.3.3. Secondary Activity Types & Third-Party Perspectives
- 1.3.4. Primary Research
- 1.4. Information Analysis
- 1.4.1. Data Analysis Models
- 1.5. Market Formulation & Data Visualization
- 1.6. Data Validation & Publishing
Chapter 2. Executive Summary
- 2.1. Market Outlook
- 2.2. Activity Type Outlook
- 2.3. Group Outlook
- 2.4. Booking Mode Outlook
- 2.5. Age Group Outlook
- 2.6. Regional Outlook
Chapter 3. Adventure Tourism Market Variables, Trends & Scope
- 3.1 Market Lineage Outlook
- 3.2 Penetration & Growth Prospect Mapping
- 3.3 Value Chain Analysis
- 3.4 Technology Overview
- 3.5 Regulatory Framework
- 3.6 Market Dynamics
- 3.6.1 Market Driver Analysis
- 3.6.2 Market restraint Analysis
- 3.6.3 Industry challenges
- 3.7 Business Environment Analysis
- 3.7.1 Porter's Analysis
- 3.7.1.1 Threat of new entrants
- 3.7.1.2 Bargaining power of suppliers
- 3.7.1.3 Bargaining power of buyers
- 3.7.1.4 Threat of substitutes
- 3.7.1.5 Competitive rivalry
- 3.7.2 PESTLE Analysis
- 3.7.2.1 Political Landscape
- 3.7.2.2 Environmental Landscape
- 3.7.2.3 Social Landscape
- 3.7.2.4 Technology Landscape
- 3.7.2.5 Economic Landscape
- 3.7.2.6 Legal Landscape
- 3.7.3 Major Deals & Strategic Alliances Analysis
- 3.7.1 Porter's Analysis
- 3.8 Market Entry Strategy
- 3.9 COVID-19 Impact Analysis
Chapter 4. Consumer Behavior Analysis
- 4.1. Demographic Analysis
- 4.2. Consumer Trends and Preferences
- 4.3. Factors Affecting Buying Decision
- 4.4. Consumer Activity Type Adoption
- 4.5. Observations & Recommendations
Chapter 5. Adventure Tourism Market: Activity Type Estimates & Trend Analysis
- 5.1. Activity Type Movement Analysis & Market Share, 2021 & 2030
- 5.2. Hard
- 5.2.1. Market Estimates And Forecast, 2017 - 2030 (USD Billion)
- 5.3. Soft
- 5.3.1. Market Estimates And Forecast, 2017 - 2030 (USD Billion)
- 5.4. Others
- 5.4.1. Market Estimates And Forecast, 2017 - 2030 (USD Billion)
Chapter 6. Adventure Tourism Market: Group Estimates & Trend Analysis
- 6.1. Group Movement Analysis & Market Share, 2021 & 2030
- 6.2. Solo
- 6.2.1. Market Estimates And Forecast, 2017 - 2030 (USD Billion)
- 6.3. Couples
- 6.3.1. Market Estimates And Forecast, 2017 - 2030 (USD Billion)
- 6.4. Family
- 6.4.1. Market Estimates And Forecast, 2017 - 2030 (USD Billion)
- 6.5. Groups
- 6.5.1. Market Estimates And Forecast, 2017 - 2030 (USD Billion)
Chapter 7. Adventure Tourism Market: Booking Mode Estimates & Trend Analysis
- 7.1. Booking Mode Movement Analysis & Market Share, 2021 & 2030
- 7.2. Direct
- 7.2.1. Market Estimates And Forecast, 2017 - 2030 (USD Billion)
- 7.3. Travel Agent
- 7.3.1. Market Estimates And Forecast, 2017 - 2030 (USD Billion)
- 7.4. Marketplace Booking
- 7.4.1. Market Estimates And Forecast, 2017 - 2030 (USD Billion)
Chapter 8. Adventure Tourism Market: Age Group Estimates & Trend Analysis
- 8.1. Age Group Movement Analysis & Market Share, 2021 & 2030
- 8.2. 28 and Under
- 8.2.1. Market Estimates And Forecast, 2017 - 2030 (USD Billion)
- 8.3. 29-40
- 8.3.1. Market Estimates And Forecast, 2017 - 2030 (USD Billion)
- 8.4. 41-50
- 8.4.1. Market Estimates And Forecast, 2017 - 2030 (USD Billion)
- 8.5. 51-60
- 8.5.1. Market Estimates And Forecast, 2017 - 2030 (USD Billion)
- 8.6. 61-70
- 8.6.1. Market Estimates And Forecast, 2017 - 2030 (USD Billion)
- 8.7. 71 and Over
- 8.7.1. Market Estimates And Forecast, 2017 - 2030 (USD Billion)
Chapter 9. Adventure Tourism Market: Regional Estimates & Trend Analysis
- 9.1. Regional Movement Analysis & Market Share, 2021 & 2030
- 9.2. North America
- 9.2.1. Market Estimates And Forecast, 2017 - 2030 (USD Billion)
- 9.2.2. Market Estimates And Forecast, By Activity Type, 2017 - 2030 (USD Billion)
- 9.2.3. Market Estimates And Forecast, By Group, 2017 - 2030 (USD Billion)
- 9.2.4. Market Estimates And Forecast, By Booking Mode, 2017 - 2030 (USD Billion)
- 9.2.5. Market Estimates And Forecast, By Age Group, 2017 - 2030 (USD Billion)
- 9.2.6. U.S.
- 9.2.6.1. Market Estimates And Forecast, 2017 - 2030 (USD Billion)
- 9.2.6.2. Market Estimates And Forecast, By Activity Type, 2017 - 2030 (USD Billion)
- 9.2.6.3. Market Estimates And Forecast, By Group, 2017 - 2030 (USD Billion)
- 9.2.6.4. Market Estimates And Forecast, By Booking Mode, 2017 - 2030 (USD Billion)
- 9.2.6.5. Market Estimates And Forecast, By Age Group, 2017 - 2030 (USD Billion)
- 9.2.7. Canada
- 9.2.7.1. Market Estimates And Forecast, 2017 - 2030 (USD Billion)
- 9.2.7.2. Market Estimates And Forecast, By Activity Type, 2017 - 2030 (USD Billion)
- 9.2.7.3. Market Estimates And Forecast, By Group, 2017 - 2030 (USD Billion)
- 9.2.7.4. Market Estimates And Forecast, By Booking Mode, 2017 - 2030 (USD Billion)
- 9.2.7.5. Market Estimates And Forecast, By Age Group, 2017 - 2030 (USD Billion)
- 9.2.8. Mexico
- 9.2.8.1. Market Estimates And Forecast, 2017 - 2030 (USD Billion)
- 9.2.8.2. Market Estimates And Forecast, By Activity Type, 2017 - 2030 (USD Billion)
- 9.2.8.3. Market Estimates And Forecast, By Group, 2017 - 2030 (USD Billion)
- 9.2.8.4. Market Estimates And Forecast, By Booking Mode, 2017 - 2030 (USD Billion)
- 9.2.8.5. Market Estimates And Forecast, By Age Group, 2017 - 2030 (USD Billion)
- 9.3. Europe
- 9.3.1. Market Estimates And Forecast, 2017 - 2030 (USD Billion)
- 9.3.2. Market Estimates And Forecast, By Activity Type, 2017 - 2030 (USD Billion)
- 9.3.3. Market Estimates And Forecast, By Group, 2017 - 2030 (USD Billion)
- 9.3.4. Market Estimates And Forecast, By Booking Mode, 2017 - 2030 (USD Billion)
- 9.3.5. Market Estimates And Forecast, By Age Group, 2017 - 2030 (USD Billion)
- 9.3.6. U.K.
- 9.3.6.1. Market Estimates And Forecast, 2017 - 2030 (USD Billion)
- 9.3.6.2. Market Estimates And Forecast, By Activity Type, 2017 - 2030 (USD Billion)
- 9.3.6.3. Market Estimates And Forecast, By Group, 2017 - 2030 (USD Billion)
- 9.3.6.4. Market Estimates And Forecast, By Booking Mode, 2017 - 2030 (USD Billion)
- 9.3.6.5. Market Estimates And Forecast, By Age Group, 2017 - 2030 (USD Billion)
- 9.3.7. Germany
- 9.3.7.1. Market Estimates And Forecast, 2017 - 2030 (USD Billion)
- 9.3.7.2. Market Estimates And Forecast, By Activity Type, 2017 - 2030 (USD Billion)
- 9.3.7.3. Market Estimates And Forecast, By Group, 2017 - 2030 (USD Billion)
- 9.3.7.4. Market Estimates And Forecast, By Booking Mode, 2017 - 2030 (USD Billion)
- 9.3.7.5. Market Estimates And Forecast, By Age Group, 2017 - 2030 (USD Billion)
- 9.3.8. France
- 9.3.8.1. Market Estimates And Forecast, 2017 - 2030 (USD Billion)
- 9.3.8.2. Market Estimates And Forecast, By Activity Type, 2017 - 2030 (USD Billion)
- 9.3.8.3. Market Estimates And Forecast, By Group, 2017 - 2030 (USD Billion)
- 9.3.8.4. Market Estimates And Forecast, By Booking Mode, 2017 - 2030 (USD Billion)
- 9.3.8.5. Market Estimates And Forecast, By Age Group, 2017 - 2030 (USD Billion)
- 9.3.9. Italy
- 9.3.9.1. Market Estimates And Forecast, 2017 - 2030 (USD Billion)
- 9.3.9.2. Market Estimates And Forecast, By Activity Type, 2017 - 2030 (USD Billion)
- 9.3.9.3. Market Estimates And Forecast, By Group, 2017 - 2030 (USD Billion)
- 9.3.9.4. Market Estimates And Forecast, By Booking Mode, 2017 - 2030 (USD Billion)
- 9.3.9.5. Market Estimates And Forecast, By Age Group, 2017 - 2030 (USD Billion)
- 9.3.10. Spain
- 9.3.10.1. Market Estimates And Forecast, 2017 - 2030 (USD Billion)
- 9.3.10.2. Market Estimates And Forecast, By Activity Type, 2017 - 2030 (USD Billion)
- 9.3.10.3. Market Estimates And Forecast, By Group, 2017 - 2030 (USD Billion)
- 9.3.10.4. Market Estimates And Forecast, By Booking Mode, 2017 - 2030 (USD Billion)
- 9.3.10.5. Market Estimates And Forecast, By Age Group, 2017 - 2030 (USD Billion)
- 9.4. Asia Pacific
- 9.4.1. Market Estimates And Forecast, 2017 - 2030 (USD Billion)
- 9.4.2. Market Estimates And Forecast, By Activity Type, 2017 - 2030 (USD Billion)
- 9.4.3. Market Estimates And Forecast, By Group, 2017 - 2030 (USD Billion)
- 9.4.4. Market Estimates And Forecast, By Booking Mode, 2017 - 2030 (USD Billion)
- 9.4.5. Market Estimates And Forecast, By Age Group, 2017 - 2030 (USD Billion)
- 9.4.6. China
- 9.4.6.1. Market Estimates And Forecast, 2017 - 2030 (USD Billion)
- 9.4.6.2. Market Estimates And Forecast, By Activity Type, 2017 - 2030 (USD Billion)
- 9.4.6.3. Market Estimates And Forecast, By Group, 2017 - 2030 (USD Billion)
- 9.4.6.4. Market Estimates And Forecast, By Booking Mode, 2017 - 2030 (USD Billion)
- 9.4.6.5. Market Estimates And Forecast, By Age Group, 2017 - 2030 (USD Billion)
- 9.4.7. India
- 9.4.7.1. Market Estimates And Forecast, 2017 - 2030 (USD Billion)
- 9.4.7.2. Market Estimates And Forecast, By Activity Type, 2017 - 2030 (USD Billion)
- 9.4.7.3. Market Estimates And Forecast, By Group, 2017 - 2030 (USD Billion)
- 9.4.7.4. Market Estimates And Forecast, By Booking Mode, 2017 - 2030 (USD Billion)
- 9.4.7.5. Market Estimates And Forecast, By Age Group, 2017 - 2030 (USD Billion)
- 9.4.8. Japan
- 9.4.8.1. Market Estimates And Forecast, 2017 - 2030 (USD Billion)
- 9.4.8.2. Market Estimates And Forecast, By Activity Type, 2017 - 2030 (USD Billion)
- 9.4.8.3. Market Estimates And Forecast, By Group, 2017 - 2030 (USD Billion)
- 9.4.8.4. Market Estimates And Forecast, By Booking Mode, 2017 - 2030 (USD Billion)
- 9.4.8.5. Market Estimates And Forecast, By Age Group, 2017 - 2030 (USD Billion)
- 9.4.9. South Korea
- 9.4.9.1. Market Estimates And Forecast, 2017 - 2030 (USD Billion)
- 9.4.9.2. Market Estimates And Forecast, By Activity Type, 2017 - 2030 (USD Billion)
- 9.4.9.3. Market Estimates And Forecast, By Group, 2017 - 2030 (USD Billion)
- 9.4.9.4. Market Estimates And Forecast, By Booking Mode, 2017 - 2030 (USD Billion)
- 9.4.9.5. Market Estimates And Forecast, By Age Group, 2017 - 2030 (USD Billion)
- 9.4.10. Australia
- 9.4.10.1. Market Estimates And Forecast, 2017 - 2030 (USD Billion)
- 9.4.10.2. Market Estimates And Forecast, By Activity Type, 2017 - 2030 (USD Billion)
- 9.4.10.3. Market Estimates And Forecast, By Group, 2017 - 2030 (USD Billion)
- 9.4.10.4. Market Estimates And Forecast, By Booking Mode, 2017 - 2030 (USD Billion)
- 9.4.10.5. Market Estimates And Forecast, By Age Group, 2017 - 2030 (USD Billion)
- 9.5. Central & South America
- 9.5.1. Market Estimates And Forecast, 2017 - 2030 (USD Billion)
- 9.5.2. Market Estimates And Forecast, By Activity Type, 2017 - 2030 (USD Billion)
- 9.5.3. Market Estimates And Forecast, By Group, 2017 - 2030 (USD Billion)
- 9.5.4. Market Estimates And Forecast, By Booking Mode, 2017 - 2030 (USD Billion)
- 9.5.5. Market Estimates And Forecast, By Age Group, 2017 - 2030 (USD Billion)
- 9.5.6. Brazil
- 9.5.6.1. Market Estimates And Forecast, 2017 - 2030 (USD Billion)
- 9.5.6.2. Market Estimates And Forecast, By Activity Type, 2017 - 2030 (USD Billion)
- 9.5.6.3. Market Estimates And Forecast, By Group, 2017 - 2030 (USD Billion)
- 9.5.6.4. Market Estimates And Forecast, By Booking Mode, 2017 - 2030 (USD Billion)
- 9.5.6.5. Market Estimates And Forecast, By Age Group, 2017 - 2030 (USD Billion)
- 9.6. Middle East & Africa
- 9.6.1. Market Estimates And Forecast, 2017 - 2030 (USD Billion)
- 9.6.2. Market Estimates And Forecast, By Activity Type, 2017 - 2030 (USD Billion)
- 9.6.3. Market Estimates And Forecast, By Group, 2017 - 2030 (USD Billion)
- 9.6.4. Market Estimates And Forecast, By Booking Mode, 2017 - 2030 (USD Billion)
- 9.6.5. Market Estimates And Forecast, By Age Group, 2017 - 2030 (USD Billion)
- 9.6.6. South Africa
- 9.6.6.1. Market Estimates And Forecast, 2017 - 2030 (USD Billion)
- 9.6.6.2. Market Estimates And Forecast, By Activity Type, 2017 - 2030 (USD Billion)
- 9.6.6.3. Market Estimates And Forecast, By Group, 2017 - 2030 (USD Billion)
- 9.6.6.4. Market Estimates And Forecast, By Booking Mode, 2017 - 2030 (USD Billion)
- 9.6.6.5. Market Estimates And Forecast, By Age Group, 2017 - 2030 (USD Billion)
Chapter 10. Competitive Analysis
- 10.1 Key Players' Recent Developments & Their Impact
- 10.2 Strategies Adopted By Major Players During COVID-19 Pandemic
- 10.3 Vendor Landscape
- 10.4 Public Companies
- 10.4.1 Company Market Position Analysis
- 10.5 Private Companies
- 10.5.1 List of Key Emerging Companies/Technology Disruptors/Innovators
Chapter 11. Company Profiles
- 11.1. Austin Adventures, Inc.
- 11.1.1. Company Overview
- 11.1.2. Financial Performance
- 11.1.3. Activity Type Benchmarking
- 11.1.4. Strategic Initiatives
- 11.2. Butterfield & Robinson Inc.
- 11.2.1. Company Overview
- 11.2.2. Financial Performance
- 11.2.3. Activity Type Benchmarking
- 11.2.4. Strategic Initiatives
- 11.3. G Adventures
- 11.3.1. Company Overview
- 11.3.2. Financial Performance
- 11.3.3. Activity Type Benchmarking
- 11.3.4. Strategic Initiatives
- 11.4. Geographic Expeditions Inc.
- 11.4.1. Company Overview
- 11.4.2. Financial Performance
- 11.4.3. Activity Type Benchmarking
- 11.4.4. Strategic Initiatives
- 11.5. Intrepid Group, ltd
- 11.5.1. Company Overview
- 11.5.2. Financial Performance
- 11.5.3. Activity Type Benchmarking
- 11.5.4. Strategic Initiatives
- 11.6. Mountain Travel Sobek
- 11.6.1. Company Overview
- 11.6.2. Financial Performance
- 11.6.3. Activity Type Benchmarking
- 11.6.4. Strategic Initiatives
- 11.7. Discovery Nomads
- 11.7.1. Company Overview
- 11.7.2. Financial Performance
- 11.7.3. Activity Type Benchmarking
- 11.7.4. Strategic Initiatives
- 11.8. Row Adventures
- 11.8.1. Company Overview
- 11.8.2. Financial Performance
- 11.8.3. Activity Type Benchmarking
- 11.8.4. Strategic Initiatives
- 11.9. Tui Group
- 11.9.1. Company Overview
- 11.9.2. Financial Performance
- 11.9.3. Activity Type Benchmarking
- 11.9.4. Strategic Initiatives
- 11.10. Cox & Kings Ltd.
- 11.10.1. Company Overview
- 11.10.2. Financial Performance
- 11.10.3. Activity Type Benchmarking
- 11.10.4. Strategic Initiatives