
モバイルAR(拡張現実)市場の機会、成長促進要因、産業動向分析、2025年~2034年の予測
Mobile Augmented Reality (AR) Market Opportunity, Growth Drivers, Industry Trend Analysis, and Forecast 2025 - 2034- 発行日
- ページ情報
- 英文 190 Pages
- 納期
- 2~3営業日
- 商品コード
- 1797710
- カスタマイズ可能 お客様のご希望に応じて、既存データの加工や未掲載情報(例:国別セグメント)の追加などの対応が可能です。詳細はお問い合わせください。
- 翻訳ツール提供対象 PDF対応AI翻訳ツールの無料貸し出しサービスのご利用が可能です
概要
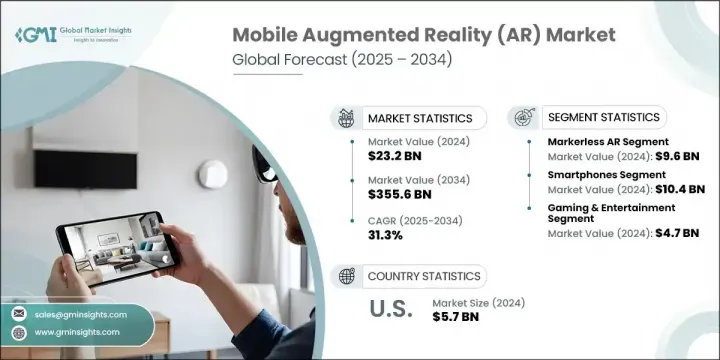
世界のモバイルAR(拡張現実)市場は、2024年に232億米ドルと評価され、CAGR 31.3%で成長し、2034年には3,556億米ドルに達すると推定されています。
この力強い成長の背景には、AR対応スマートフォンの普及、没入型デジタル体験に対する消費者の関心の高まり、小売、エンターテインメント、ヘルスケア、教育などの分野にわたるアプリケーションの拡大があります。高性能プロセッサー、高度なセンサー、マルチレンズカメラなどの技術的進歩により、世界市場でより広範な採用が可能になりました。さらに、5Gの展開とエッジコンピューティングの進歩により、以前はネットワークの制約によって制限されていた低レイテンシーでリアルタイムのARインタラクションがサポートされています。AR開発ツールのエコシステムが拡大することで、企業やクリエイターがインタラクティブなモバイルARアプリケーションを提供できるようになり、eコマースやモバイルゲームプラットフォームが消費者の需要を刺激し続けています。
モバイルAR(拡張現実)はまた、業務効率とユーザーエンゲージメントの測定可能な向上をもたらします。例えば、トレーニングのワークフローにARを活用している企業では、学習効率が90%以上向上したと報告されています。これらのテクノロジーは、従来の指示をリアルタイムのビジュアルガイドに置き換え、ミスを減らし、トレーニング時間を大幅に短縮しています。eコマースでは、モバイルARが小売業者にバーチャルな商品プレビューを提供し、購入者の信頼を高め、返品を減らすのに役立っています。さまざまな分野の企業がモバイルARを活用し、体験のパーソナライゼーションを向上させ、ブランドとの相互作用を高め、消費者がモバイルデバイスから直接、情報に基づいた意思決定を行えるようにしています。
| 市場範囲 | |
|---|---|
| 開始年 | 2024 |
| 予測年 | 2025-2034 |
| 開始金額 | 232億米ドル |
| 予測金額 | 3,556億米ドル |
| CAGR | 31.3% |
マーカーレスARセグメントは、2024年に96億米ドルを生み出しました。このアプローチは、物理的なマーカーに依存せず、代わりにGPS、SLAM、慣性センサーの組み合わせを使用して、現実世界の環境内にデジタルコンテンツを固定するため、広く支持を集めています。小売、教育、エンターテイメントなどの業界は、どこにでも展開できるインタラクティブな体験のためにこの技術を採用しています。マーカーレスARは、リアルタイムナビゲーション、没入型ゲーム、遠隔学習などのアプリケーションをサポートしており、これが急成長の要因となっています。
スマートフォン分野は2024年に104億米ドルを生み出しました。このセグメントの成長は、高解像度カメラ、高度なモーショントラッキング、専用AIチップなど、スマートフォン技術の急速な進化に起因します。これらのコンポーネントは総体としてスムーズなAR体験を提供し、ユーザーが仮想要素とシームレスに相互作用できるようにします。LiDARスキャナとアップグレードされたGPUがミッドレンジのデバイスにも搭載されるようになったことで、モバイルARのアクセシビリティはあらゆる層で拡大しており、スマートフォンは世界的に消費者向けARコンテンツの主要な原動力となっています。
米国のモバイルAR(拡張現実)(AR)市場は、2024年に57億米ドルとなり、2034年までに29.4%のCAGRで成長すると予測されています。この地域の開発を支えているのは、AR対応モバイル機器の普及、没入型コンテンツに対する消費者の需要、大手ハイテク企業による開発者の強力なサポートです。5G配備の継続的な進展とデジタルインフラ強化のための国家的取り組みも採用を強化しています。企業が成功するためには、軽量SDKの提供、次世代ネットワーク向けのソフトウェアの最適化、コンテンツ制作者、ブランド、サービスプロバイダーとのパートナーシップの確立に注力する必要があります。直感的なUX、プライバシー保護、シームレスな空間統合を優先することで、ユーザーのエンゲージメントと信頼はさらに高まると思われます。
モバイルAR(拡張現実)(AR)市場で活躍する著名企業には、MAXST Co.Ltd.、Talespin Reality Labs, Inc.、Wikitude GmbH、Samsung Electronics Co.Ltd.、Magic Leap, Inc.、Appentus Technologies Private Limited、Groove Jones, LLC、PTC Inc.、Apple Inc.、Blippar.com Limited、8ninths Inc.(Valence)、BidOn Games Studio, LLC、Niantic, Inc.、Google LLCなどがあります。市場プレゼンスを強化するため、モバイルARのプレーヤーはクロスプラットフォーム開発ツール、ARエンジン性能の強化、AI主導のパーソナライゼーション機能の統合に注力しています。多くの企業が、小売業者、ゲームスタジオ、技術開発者との買収や戦略的提携を通じて、ARコンテンツのポートフォリオを拡大しています。ハイエンドと中級のスマートフォンの両方でAR体験を利用できるようにすることに重点を置いています。
目次
第1章 調査手法と範囲
第2章 エグゼクティブサマリー
第3章 業界考察
- エコシステム分析
- サプライヤーの情勢
- 利益率
- コスト構造
- 各段階での付加価値
- バリューチェーンに影響を与える要因
- ディスラプション
- 業界への影響要因
- 促進要因
- AR機能搭載のスマートフォン普及率の上昇
- 小売業とeコマースの需要急増
- 5Gとエッジコンピューティングの拡大
- モバイルゲームやエンターテインメントにおける採用の増加
- サポート力のあるエコシステムと開発者ツール
- 業界の潜在的リスク&課題
- デバイスの制限と断片化
- プライバシーとセキュリティに関する懸念
- 市場機会
- 促進要因
- 成長可能性分析
- 規制情勢
- 北米
- 欧州
- アジア太平洋地域
- ラテンアメリカ
- 中東・アフリカ
- ポーター分析
- PESTEL分析
- 技術とイノベーションの情勢
- 現在の技術動向
- 新興技術
- 価格動向
- 地域別
- 製品別
- 価格戦略
- 新たなビジネスモデル
- コンプライアンス要件
- 持続可能性対策
- 消費者感情分析
- 特許および知的財産分析
- 地政学と貿易のダイナミクス
第4章 競合情勢
- イントロダクション企業の市場シェア分析
- 企業の市場シェア分析
- 地域別
- 市場集中分析
- 主要プレーヤーの競合ベンチマーキング
- 財務実績の比較
- 製品ポートフォリオの比較
- 地理的プレゼンスの比較
- 競合ポジショニングマトリックス
- 戦略的展望マトリックス
- 主な発展, 2021-2024
- 合併と買収
- パートナーシップとコラボレーション
- 技術的進歩
- 拡大と投資戦略
- 持続可能性への取り組み
- デジタル変革イニシアチブ
- 新興企業/スタートアップ企業の競合情勢
第5章 市場推計・予測:技術タイプ別、2021年~2034年
- マーカーベースのAR
- マーカーレスAR
- 投影ベースのAR
- 重ね合わせベースのAR
第6章 市場推計・予測:デバイスタイプ別、2021年~2034年
- スマートフォン
- タブレット
- ウェアラブル
- ハンドヘルドゲーム機
第7章 市場推計・予測:用途別、2021年~2034年
- ゲームとエンターテイメント
- 小売・Eコマース
- 教育とトレーニング
- ヘルスケア
- 軍事・防衛
- 旅行と観光
- 不動産・建築
- その他
第8章 市場推計・予測:地域別、2021年~2034年
- 主要動向
- 北米
- 米国
- カナダ
- 欧州
- ドイツ
- 英国
- フランス
- スペイン
- 卵
- アジア太平洋地域
- 中国
- インド
- 日本
- 韓国
- オーストラリア
- アジア太平洋地域
- ラテンアメリカ
- 中東・アフリカ
- アラブ首長国連邦
- サウジアラビア
- 南アフリカ
- ロメア
第9章 企業プロファイル
- 8ninths Inc.(Valence)
- Appentus Technologies Private Limited
- Apple Inc.
- APX Labs, Inc.
- Atheer, Inc.
- Augment Inc.
- BidOn Games Studio, LLC
- Blippar.com Limited
- EON Reality, Inc.
- Google LLC
- Groove Jones, LLC
- HQSoftware OU
- INDE Appshaker Ltd.
- Magic Leap, Inc.
- MAXST Co., Ltd.
- NEXT/NOW, LLC
- Niantic, Inc.
- PTC Inc.(formerly Parametric)
- Samsung Electronics Co., Ltd.
- Scanta Inc.
- Scope Technologies US Inc.
- Talespin Reality Labs, Inc.
- VironIT LLC
- Wikitude GmbH
- Zappar Ltd.(UK)
目次
The Global Mobile Augmented Reality Market was valued at USD 23.2 billion in 2024 and is estimated to grow at a CAGR of 31.3% to reach USD 355.6 billion by 2034. This robust growth is driven by the widespread use of AR-enabled smartphones, increasing consumer interest in immersive digital experiences, and expanding applications across sectors such as retail, entertainment, healthcare, and education. Technological advances such as high-performance processors, advanced sensors, and multi-lens cameras have enabled broader adoption across global markets. Additionally, the rollout of 5G and progress in edge computing are supporting low-latency, real-time AR interactions that were previously limited by network constraints. The growing ecosystem of AR development tools is also empowering businesses and creators to deliver interactive mobile AR applications, while e-commerce and mobile gaming platforms continue to fuel consumer demand.
Mobile AR also delivers measurable gains in operational efficiency and user engagement. For example, companies utilizing AR in training workflows have reported over 90% improvement in learning efficiency. These technologies are replacing traditional instructions with real-time visual guides, reducing errors and compressing training time significantly. In e-commerce, mobile AR is helping retailers offer virtual product previews, increasing buyer confidence and reducing product returns. Businesses across sectors are turning to mobile AR to improve experience personalization, elevate brand interaction, and enable informed decision-making by consumers directly from their mobile devices.
| Market Scope | |
|---|---|
| Start Year | 2024 |
| Forecast Year | 2025-2034 |
| Start Value | $23.2 billion |
| Forecast Value | $355.6 billion |
| CAGR | 31.3% |
The markerless AR segment generated USD 9.6 billion in 2024. This approach is gaining widespread traction as it does not rely on physical markers but instead uses a combination of GPS, SLAM, and inertial sensors to anchor digital content within real-world environments. Industries such as retail, education, and entertainment are embracing this technology for interactive experiences that can be deployed anywhere. Markerless AR supports applications such as real-time navigation, immersive gaming, and remote learning, which has contributed to its rapid growth.
The smartphones segment generated USD 10.4 billion in 2024. The growth of this segment is attributed to the rapid evolution of smartphone technology, including high-resolution cameras, advanced motion tracking, and dedicated AI chips. These components collectively provide a smooth AR experience, enabling users to interact with virtual elements seamlessly. With LiDAR scanners and upgraded GPUs now available in even mid-range devices, the accessibility of mobile AR is expanding across demographics, making smartphones the primary driver of consumer-facing AR content globally.
United States Mobile Augmented Reality (AR) Market was USD 5.7 billion in 2024 and is forecast to grow at a CAGR of 29.4% by 2034. Growth in this region is supported by the widespread adoption of AR-ready mobile devices, consumer demand for immersive content, and strong developer support from leading tech firms. Continued progress in 5G deployment and national efforts to enhance digital infrastructure are also reinforcing adoption. For businesses to succeed, they must focus on delivering lightweight SDKs, optimizing software for next-gen networks, and establishing partnerships with content producers, brands, and service providers. Prioritizing intuitive UX, privacy safeguards, and seamless spatial integration will further increase user engagement and trust.
Prominent companies active in the Mobile Augmented Reality (AR) Market include MAXST Co., Ltd., Talespin Reality Labs, Inc., Wikitude GmbH, Samsung Electronics Co., Ltd., Magic Leap, Inc., Appentus Technologies Private Limited, Groove Jones, LLC, PTC Inc., Apple Inc., Blippar.com Limited, 8ninths Inc. (Valence), BidOn Games Studio, LLC, Niantic, Inc., and Google LLC. To strengthen their market presence, players in the mobile AR landscape are focusing on cross-platform development tools, enhancing AR engine performance, and integrating AI-driven personalization features. Many companies are expanding their AR content portfolios through acquisitions and strategic alliances with retailers, game studios, and tech developers. There is a strong emphasis on making AR experiences accessible on both high-end and mid-tier smartphones.
Table of Contents
Chapter 1 Methodology and Scope
- 1.1 Market scope and definition
- 1.2 Research design
- 1.2.1 Research approach
- 1.2.2 Data collection methods
- 1.3 Data mining sources
- 1.3.1 Global
- 1.3.2 Regional/Country
- 1.4 Base estimates and calculations
- 1.4.1 Base year calculation
- 1.4.2 Key trends for market estimation
- 1.5 Primary research and validation
- 1.5.1 Primary sources
- 1.6 Forecast model
- 1.7 Research assumptions and limitations
Chapter 2 Executive Summary
- 2.1 Industry 3600 synopsis
- 2.2 Key market trends
2.2.1. Technology type
- 2.2.2 Device type
- 2.2.3 Application
- 2.2.5 North America
- 2.2.6 Europe
- 2.2.7 Asia Pacific
- 2.2.8 Latin America
- 2.2.9 Middle East & Africa
- 2.3 TAM Analysis, 2025-2034 (USD Million)
- 2.4 CXO perspectives: Strategic imperatives
- 2.5 Executive decision points
- 2.6 Critical Success Factors
- 2.7 Future Outlook and Strategic Recommendations
Chapter 3 Industry Insights
- 3.1 Industry ecosystem analysis
- 3.1.1 Supplier Landscape
- 3.1.2 Profit Margin
- 3.1.3 Cost structure
- 3.1.4 Value addition at each stage
- 3.1.5 Factor affecting the value chain
- 3.1.6 Disruptions
- 3.2 Industry impact forces
- 3.2.1 Growth drivers
- 3.2.1.1 Rising smartphone penetration with AR capabilities
- 3.2.1.2 Surging demand in retail and e-commerce
- 3.2.1.3 Expansion of 5g and edge computing
- 3.2.1.4 Increased adoption in mobile gaming and entertainment
- 3.2.1.5 Supportive ecosystem and developer tools
- 3.2.2 Industry pitfalls and challenges
- 3.2.2.1 Device Limitations and Fragmentation
- 3.2.2.2 Privacy and Security Concerns
- 3.2.3 Market Opportunities
- 3.2.1 Growth drivers
- 3.3 Growth potential analysis
- 3.4 Regulatory landscape
- 3.4.1 North America
- 3.4.2 Europe
- 3.4.3 Asia Pacific
- 3.4.4 Latin America
- 3.4.5 Middle East & Africa
- 3.5 Porter's analysis
- 3.6 PESTEL analysis
- 3.7 Technological and Innovation landscape
- 3.7.1 Current technological trends
- 3.7.2 Emerging technologies
- 3.8 Price Trends
- 3.8.1 By region
- 3.8.2 By product
- 3.9 Pricing strategies
- 3.10 Emerging business models
- 3.11 Compliance requirements
- 3.12 Sustainability measures
- 3.13 Consumer sentiment analysis
- 3.14 Patent and IP analysis
- 3.15 Geopolitical and trade dynamics
Chapter 4 Competitive Landscape, 2024
- 4.1 Introduction Company market share analysis
- 4.2 Company market share analysis
- 4.2.1 By region
4.2.1. North America
4.2.2. Europe
4.2.3. Asia Pacific
- 4.2.2 Market concentration analysis
- 4.3 Competitive Benchmarking of key Players
- 4.3.1 Financial Performance Comparison
4.3.1.1. Revenue
4.3.1.2. Profit Margin
4.3.1.3. R&D
- 4.3.2 Product Portfolio Comparison
4.3.2.1. Product Range Breadth
4.3.2.2. Technology
4.3.2.3. Innovation
- 4.3.3 Geographic Presence Comparison
4.3.3.1. Global Footprint Analysis
4.3.3.2. Service Network Coverage
4.3.3.3. Market Penetration by Region
- 4.3.4 Competitive Positioning Matrix
4.3.4.1. Leaders
4.3.4.2. Challengers
4.3.4.3. Followers
4.3.4.4. Niche Players
- 4.3.5 Strategic outlook matrix
- 4.4 Key developments, 2021-2024
- 4.4.1 Mergers and Acquisitions
- 4.4.2 Partnerships and Collaborations
- 4.4.3 Technological Advancements
- 4.4.4 Expansion and Investment Strategies
- 4.4.5 Sustainability Initiatives
- 4.4.6 Digital Transformation Initiatives
- 4.5 Emerging/ Startup Competitors Landscape
Chapter 5 Market Estimates & Forecast, By Technology Type, 2021 - 2034 (USD Billion)
- 5.1 Marker-based AR
- 5.2 Markerless AR
- 5.3 Projection-based AR
- 5.4 Superimposition-based AR
Chapter 6 Market estimates & forecast, By Device Type, 2021 - 2034 (USD Billion)
- 6.1 Smartphones
- 6.2 Tablets
- 6.3 Wearables
- 6.4 Handheld Consoles
Chapter 7 Market estimates & forecast, By Application, 2021 - 2034 (USD Billion)
- 7.1 Gaming & Entertainment
- 7.2 Retail & E-commerce
- 7.3 Education & Training
- 7.4 Healthcare
- 7.5 Military & Defense
- 7.6 Travel & Tourism
- 7.7 Real Estate & Architecture
- 7.8 Others
Chapter 8 Market Estimates and Forecast, By Region, 2021 - 2034 (USD Million)
- 8.1 Key trends
- 8.2 North America
- 8.2.1 U.S.
- 8.2.2 Canada
- 8.3 Europe
- 8.3.1 Germany
- 8.3.2 U.K.
- 8.3.3 France
- 8.3.4 Spain
- 8.3.5 ROE
- 8.4 Asia Pacific
- 8.4.1 China
- 8.4.2 India
- 8.4.3 Japan
- 8.4.4 South Korea
- 8.4.5 Australia
- 8.4.6 RoAPAC
- 8.5 Latin America
- 8.6 Middle East & Africa
- 8.6.1 UAE
- 8.6.2 Saudi Arabia
- 8.6.3 South Africa
- 8.6.4 RoMEA
Chapter 9 Company Profile
- 9.1 8ninths Inc. (Valence)
- 9.2 Appentus Technologies Private Limited
- 9.3 Apple Inc.
- 9.4 APX Labs, Inc.
- 9.5 Atheer, Inc.
- 9.6 Augment Inc.
- 9.7 BidOn Games Studio, LLC
- 9.8 Blippar.com Limited
- 9.9 EON Reality, Inc.
- 9.10 Google LLC
- 9.11 Groove Jones, LLC
- 9.12 HQSoftware OU
- 9.13 INDE Appshaker Ltd.
- 9.14 Magic Leap, Inc.
- 9.15 MAXST Co., Ltd.
- 9.16 NEXT/NOW, LLC
- 9.17 Niantic, Inc.
- 9.18 PTC Inc. (formerly Parametric)
- 9.19 Samsung Electronics Co., Ltd.
- 9.20 Scanta Inc.
- 9.21 Scope Technologies US Inc.
- 9.22 Talespin Reality Labs, Inc.
- 9.23 VironIT LLC
- 9.24 Wikitude GmbH
- 9.25 Zappar Ltd. (UK)
- 発行日
- 発行
- Global Market Insights Inc.
- ページ情報
- 英文 190 Pages
- 納期
- 2~3営業日


