
|
市場調査レポート
商品コード
1684581
ソフトドリンク包装の市場機会、成長促進要因、産業動向分析、2025年~2034年予測Soft Drinks Packaging Market Opportunity, Growth Drivers, Industry Trend Analysis, and Forecast 2025-2034 |
||||||
カスタマイズ可能
|
|||||||
| ソフトドリンク包装の市場機会、成長促進要因、産業動向分析、2025年~2034年予測 |
|
出版日: 2025年01月06日
発行: Global Market Insights Inc.
ページ情報: 英文 240 Pages
納期: 2~3営業日
|

全表示
- 概要
- 目次
世界のソフトドリンク包装市場は2024年に870億米ドルに達し、2025年から2034年にかけてCAGR3.4%で成長すると予測されています。
この着実な成長は、消費者の選好の変化や規制の圧力、特に持続可能な包装ソリューションに対する需要の高まりに対するこの分野のダイナミックな対応を反映しています。環境問題への意識が高まるにつれて、ブランドと消費者は同様に環境に優しい代替包装に引き寄せられ、業界の変革的な変化を示しています。こうした代替品の中でも、紙をベースとした包装は、リサイクル可能で環境フットプリントが少ないため、プラスチックに代わる実行可能な代替品として注目されています。廃棄物の最小化を目指す世界の取り組みが浸透する中、紙製包装の採用は今後10年間の市場拡大において極めて重要な役割を果たすと予想されます。さらに、技術の先進化と革新的な包装デザインは、持続可能性へのコミットメントを維持しながら、ブランドが市場でのアピールを強化する新たな機会を生み出しています。
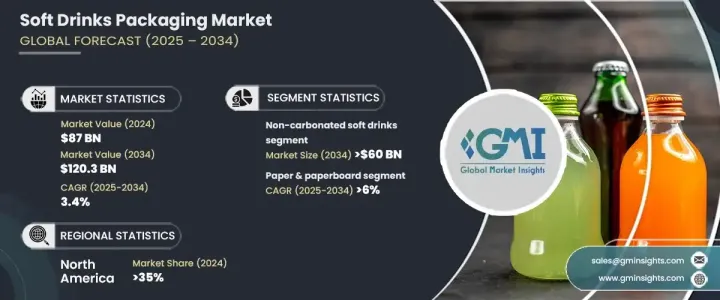
市場は飲料タイプによって炭酸飲料と非炭酸飲料に区分されます。非炭酸ソフトドリンク分野は、より健康的で自然な飲料オプションに対する需要の高まりにより、2034年までに600億米ドルを創出すると予測されています。フルーツジュース、アイスティー、ボトル入り飲料水、スポーツドリンクなどの非炭酸飲料は、高い糖分と人工成分を含むことが多い炭酸飲料の優れた代替品とみなされています。このような自然で健康志向の飲料への消費者のシフトは、市場の状況を変化させ、革新的で持続可能な包装ソリューションの需要をさらに押し上げています。
| 市場範囲 | |
|---|---|
| 開始年 | 2024年 |
| 予測年 | 2025年~2034年 |
| 開始金額 | 870億米ドル |
| 予測金額 | 1,203億米ドル |
| CAGR | 3.4% |
材料別では、ガラス、金属、紙・板紙、プラスチック、その他の材料があります。紙・板紙分野は、2025年から2034年にかけてCAGR6%という力強い成長が見込まれており、最も急成長しているカテゴリーです。持続可能な選択肢を求める需要により、使い捨てプラスチックから、生分解性があり、より環境に配慮した紙ベースのソリューションへの移行が加速しています。プラスチック廃棄物に関する世界の規制が強化され、環境に対する意識が高まるにつれ、ブランドは消費者の期待や規制基準を満たすために紙パッケージを選ぶようになっています。
2024年には、北米が世界のソフトドリンク包装市場の35%のシェアを占め、米国がこの地域の成長の先頭に立ちます。米国市場を牽引しているのは、利便性と環境に優しい包装に対する消費者の選好の高まりです。レディ・トゥ・ドリンク飲料が引き続き棚を席巻しているため、メーカーはリサイクル可能で最小限のパッケージデザインに投資するよう促しています。さらに、政府の厳しい政策と持続可能性に対する消費者の意識の高まりが、各ブランドに環境に配慮した慣行の採用を促しており、この分野の継続的な成長と技術革新を確実なものにしています。
目次
第1章 調査手法と調査範囲
- 市場範囲と定義
- 基本推定と計算
- 予測計算
- データソース
- 一次
- 二次
- 有料ソース
- 公的ソース
第2章 エグゼクティブサマリー
第3章 業界洞察
- エコシステム分析
- バリューチェーンに影響を与える要因
- 利益率分析
- 変革
- 将来の展望
- メーカー
- 流通業者
- 主要ニュースと取り組み
- 規制状況
- 影響要因
- 成長促進要因
- 紙製包装の使用の増加
- 持続可能性に対する消費者の需要の高まり
- 新興市場の成長
- 機能性飲料とプレミアム飲料の革新
- 利便性包装の需要増加
- 業界の潜在的リスク・課題
- 代替包装材料との競合
- 原材料コストの上昇
- 成長促進要因
- 成長可能性分析
- ポーター分析
- PESTEL分析
第4章 競合情勢
- イントロダクション
- 企業市場シェア分析
- 競合のポジショニングマトリックス
- 戦略展望マトリックス
第5章 市場推計・予測:材料別、2021年~2034年
- 主要動向
- プラスチック
- ガラス
- 金属
- 紙・板紙
- その他
第6章 市場推計・予測:製品タイプ別、2021年~2034年
- 主要動向
- ボトル
- 缶
- カートン
- パウチ
- その他
第7章 市場推計・予測:容量別、2021年~2034年
- 主要動向
- 小容量包装(250 ml以下)
- 中容量包装(251 ml~1 liter)
- 大容量包装(1 liter以上)
第8章 市場推計・予測:ソフトドリンクタイプ別、2021年~2034年
- 主要動向
- 炭酸ソフトドリンク
- 非炭酸ソフトドリンク
第9章 市場推計・予測:地域別、2021年~2034年
- 主要動向
- 北米
- 米国
- カナダ
- 欧州
- 英国
- ドイツ
- フランス
- イタリア
- スペイン
- ロシア
- アジア太平洋
- 中国
- インド
- 日本
- 韓国
- オーストラリア
- ラテンアメリカ
- ブラジル
- メキシコ
- 中東・アフリカ
- 南アフリカ
- サウジアラビア
- アラブ首長国連邦
第10章 企業プロファイル
- Amcor
- AptarGroup
- Ardagh Group
- Ball Corporation
- Berry Global Group
- CAN-PACK
- CPMC Holdings
- Crown Holdings
- Graham Packaging
- Graphic Packaging International
- Novelis
- Plastipak Holdings
- SIG
- Silgan Holdings
- Smurfit Kappa
- Tetra Pak
- Visy Industries
- WestRock
The Global Soft Drinks Packaging Market reached USD 87 billion in 2024 and is projected to grow at a CAGR of 3.4% from 2025 to 2034. This steady growth reflects the sector's dynamic response to shifting consumer preferences and regulatory pressures, particularly the heightened demand for sustainable packaging solutions. As awareness of environmental issues rises, brands and consumers alike are gravitating towards eco-friendly packaging alternatives, signaling a transformative shift in the industry. Among these alternatives, paper-based packaging is emerging as a frontrunner, offering a viable substitute for plastic due to its recyclability and reduced environmental footprint. With global initiatives aimed at minimizing waste gaining traction, the adoption of paper packaging is expected to play a pivotal role in the market's expansion over the next decade. Furthermore, technological advancements and innovative packaging designs are creating new opportunities for brands to enhance their market appeal while maintaining a commitment to sustainability.
The market is segmented by type of drink into carbonated soft drinks and non-carbonated soft drinks. The non-carbonated soft drinks segment is projected to generate USD 60 billion by 2034, driven by an increasing demand for healthier, more natural beverage options. Non-carbonated drinks, such as fruit juices, iced teas, bottled water, and sports drinks, are viewed as superior alternatives to carbonated soft drinks, which often contain high sugar content and artificial ingredients. This consumer shift towards natural and health-oriented beverages is reshaping the market landscape, further boosting the demand for innovative and sustainable packaging solutions.
| Market Scope | |
|---|---|
| Start Year | 2024 |
| Forecast Year | 2025-2034 |
| Start Value | $ 87 Billion |
| Forecast Value | $120.3 Billion |
| CAGR | 3.4% |
By material, the market encompasses glass, metal, paper and paperboard, plastic, and other materials. The paper and paperboard segment is poised to grow at a robust CAGR of 6% between 2025 and 2034, making it the fastest-growing category. The demand for sustainable options is accelerating the shift from single-use plastics to paper-based solutions, which are seen as biodegradable and more environmentally responsible. As global regulations tighten around plastic waste and environmental awareness intensifies, brands are increasingly opting for paper packaging to meet consumer expectations and regulatory standards.
In 2024, North America held a 35% share of the global soft drinks packaging market, with the United States spearheading regional growth. The US market is driven by rising consumer preferences for convenience and eco-friendly packaging. Ready-to-drink beverages continue to dominate the shelves, prompting manufacturers to invest in recyclable and minimalist packaging designs. Furthermore, stringent government policies and growing consumer consciousness about sustainability are compelling brands to adopt greener practices, ensuring continued growth and innovation in this segment.
Table of Contents
Chapter 1 Methodology & Scope
- 1.1 Market scope & definitions
- 1.2 Base estimates & calculations
- 1.3 Forecast calculations
- 1.4 Data sources
- 1.4.1 Primary
- 1.4.2 Secondary
- 1.4.2.1 Paid sources
- 1.4.2.2 Public sources
Chapter 2 Executive Summary
- 2.1 Industry synopsis, 2022-2034
Chapter 3 Industry Insights
- 3.1 Industry ecosystem analysis
- 3.1.1 Factor affecting the value chain
- 3.1.2 Profit margin analysis
- 3.1.3 Disruptions
- 3.1.4 Future outlook
- 3.1.5 Manufacturers
- 3.1.6 Distributors
- 3.2 Key news & initiatives
- 3.3 Regulatory landscape
- 3.4 Impact forces
- 3.4.1 Growth drivers
- 3.4.1.1 Increasing use of paper packaging
- 3.4.1.2 Rising consumer demand for sustainability
- 3.4.1.3 Growth of emerging markets
- 3.4.1.4 Innovation in functional and premium beverages
- 3.4.1.5 Increasing demand for convenience packaging
- 3.4.2 Industry pitfalls & challenges
- 3.4.2.1 Competition from alternative packaging materials
- 3.4.2.2 Rising raw material costs
- 3.4.1 Growth drivers
- 3.5 Growth potential analysis
- 3.6 Porter's analysis
- 3.7 PESTEL analysis
Chapter 4 Competitive Landscape, 2024
- 4.1 Introduction
- 4.2 Company market share analysis
- 4.3 Competitive positioning matrix
- 4.4 Strategic outlook matrix
Chapter 5 Market Estimates & Forecast, By Material, 2021-2034 (USD Billion & Kilo Tons)
- 5.1 Key trends
- 5.2 Plastic
- 5.3 Glass
- 5.4 Metal
- 5.5 Paper & paperboard
- 5.6 Others
Chapter 6 Market Estimates & Forecast, By Product Type, 2021-2034 (USD Billion & Kilo Tons)
- 6.1 Key trends
- 6.2 Bottles
- 6.3 Cans
- 6.4 Cartons
- 6.5 Pouches
- 6.6 Others
Chapter 7 Market Estimates & Forecast, By Capacity, 2021-2034 (USD Billion & Kilo Tons)
- 7.1 Key trends
- 7.2 Small packaging (Up to 250 ml)
- 7.3 Medium packaging (251 ml to 1 liter)
- 7.4 Large packaging (Above 1 liter)
Chapter 8 Market Estimates & Forecast, By Soft Drink Type, 2021-2034 (USD Billion & Kilo Tons)
- 8.1 Key trends
- 8.2 Carbonated soft drinks
- 8.3 Non-carbonated soft drinks
Chapter 9 Market Estimates & Forecast, By Region, 2021-2034 (USD Billion & Kilo Tons)
- 9.1 Key trends
- 9.2 North America
- 9.2.1 U.S.
- 9.2.2 Canada
- 9.3 Europe
- 9.3.1 UK
- 9.3.2 Germany
- 9.3.3 France
- 9.3.4 Italy
- 9.3.5 Spain
- 9.3.6 Russia
- 9.4 Asia Pacific
- 9.4.1 China
- 9.4.2 India
- 9.4.3 Japan
- 9.4.4 South Korea
- 9.4.5 Australia
- 9.5 Latin America
- 9.5.1 Brazil
- 9.5.2 Mexico
- 9.6 MEA
- 9.6.1 South Africa
- 9.6.2 Saudi Arabia
- 9.6.3 UAE
Chapter 10 Company Profiles
- 10.1 Amcor
- 10.2 AptarGroup
- 10.3 Ardagh Group
- 10.4 Ball Corporation
- 10.5 Berry Global Group
- 10.6 CAN-PACK
- 10.7 CPMC Holdings
- 10.8 Crown Holdings
- 10.9 Graham Packaging
- 10.10 Graphic Packaging International
- 10.11 Novelis
- 10.12 Plastipak Holdings
- 10.13 SIG
- 10.14 Silgan Holdings
- 10.15 Smurfit Kappa
- 10.16 Tetra Pak
- 10.17 Visy Industries
- 10.18 WestRock
