
電気バン市場の機会、成長促進要因、産業動向分析、2025~2034年の予測
Electric Vans Market Opportunity, Growth Drivers, Industry Trend Analysis, and Forecast 2025 - 2034- 発行日
- ページ情報
- 英文 180 Pages
- 納期
- 2~3営業日
- 商品コード
- 1667003
- カスタマイズ可能 お客様のご希望に応じて、既存データの加工や未掲載情報(例:国別セグメント)の追加などの対応が可能です。詳細はお問い合わせください。
- 翻訳ツール提供対象 PDF対応AI翻訳ツールの無料貸し出しサービスのご利用が可能です
概要
世界の電気バン市場は、2024年に163億米ドルと評価され、2025年から2034年にかけてCAGR 15.5%で拡大すると予測されています。 この成長は、排出ガスに関する政府の規制強化とともに、気候変動対策と大気汚染削減への世界の取り組みが増加していることに起因しています。
世界各国の政府は、電気自動車の導入を促進するインセンティブを導入し、環境に優しい車両への移行を企業に促しています。従来のディーゼル車に代わるゼロ・エミッションを提供する電気バンは、こうした規制の枠組みや企業の持続可能性目標に合致しています。バッテリー技術の向上も、航続距離の延長と製造コストの削減によって電気バンの実現可能性を高めています。このような進歩は、環境意識と規制支援と相まって、特に配送とロジスティクスの分野で、業界全体の需要を牽引しています。
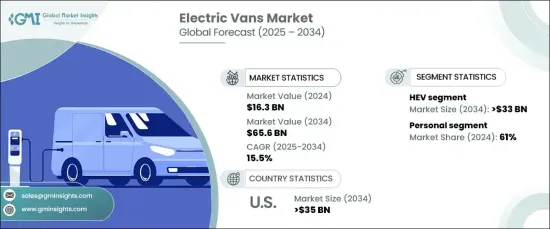
電気バン市場は、車両タイプ別に商業用と個人用に区分されます。2024年に大きなシェアを占める個人向けセグメントは、環境にやさしくコスト効率の高い車両に対する消費者の嗜好が原動力となっています。しかし、業務用セグメントは、企業が運営コストを削減し、持続可能性目標を達成するために電気バンを採用するため、成長においてこれを上回ると予想されます。充電インフラの拡大や政府のインセンティブといった要因が電気バンの商業的採用をさらに後押しし、物流や配送フリートにとって実用的なソリューションとなっています。
| 市場範囲 | |
|---|---|
| 開始年 | 2024 |
| 予測年 | 2025-2034 |
| 開始金額 | 163億米ドル |
| 予測金額 | 656億米ドル |
| CAGR | 15.5% |
推進力別に見ると、市場はバッテリー電気自動車(BEV)とハイブリッド電気自動車(HEV)に分けられます。2024年時点では、充電インフラのみに依存しないため、燃費効率と利便性のバランスからHEVが圧倒的なシェアを占めています。にもかかわらず、BEVはバッテリー技術の進歩により、航続距離の向上と充電時間の短縮を実現し、人気を集めています。価格の上昇と充電ネットワークの拡大により、BEVは個人消費者と企業の両方にとってより魅力的な選択肢となっています。このような改良が進むにつれて、BEVは今後大きな成長を遂げ、市場シェアを拡大すると予想されます。
米国は電気バン市場の主要プレーヤーであり、2024年には収益のかなりのシェアを占め、2034年には350億米ドルを超えると予測されています。この成長は、電気自動車の導入を促進することを目的とした有利な政府政策、税制優遇措置、助成金によって支えられています。大手電気自動車メーカーの存在と先端技術への投資が、技術革新と生産をさらに促進しています。さらに、同国の充電インフラの拡充は、EV普及の実現可能性を高め、持続可能な輸送ソリューションに対する需要の高まりに応えています。米国市場は、よりクリーンな商用輸送への移行をリードする好位置にあり、電動モビリティへの幅広い世界的シフトを反映しています。
目次
第1章 調査手法と調査範囲
- 調査デザイン
- 調査アプローチ
- データ収集方法
- 基本推定と計算
- 基準年の算出
- 市場推計の主要動向
- 予測モデル
- 1次調査と検証
- 一次情報
- データマイニングソース
- 市場定義
第2章 エグゼクティブサマリー
第3章 業界洞察
- エコシステム分析
- サプライヤーの状況
- 電気バンメーカー
- 販売業者
- 最終用途
- 利益率分析
- 価格分析
- 特許情勢
- コスト内訳
- 特許の情勢
- テクノロジーとイノベーションの展望
- 主要ニュース&イニシアチブ
- 規制状況
- 影響要因
- 促進要因
- 環境問題に対する意識の高まりと温室効果ガス排出量削減の必要性
- 自動車の電動化に向けた政府の取り組み
- 企業や車両運行会社は持続可能性の目標を設定し、電気自動車を導入しています。
- 効率向上のためのスマート技術の統合
- 業界の潜在的リスク&課題
- 初期初期費用が高い
- 限られた充電インフラ
- 促進要因
- 成長可能性分析
- ポーターの分析
- PESTEL分析
第4章 競合情勢
- イントロダクション
- 企業シェア分析
- 競合のポジショニング・マトリックス
- 戦略展望マトリックス
第5章 市場推計・予測:推進力別、2021年~2034年
- 主要動向
- BEV
- HEV
- FCEV
- PHEV
第6章 市場推計・予測:レンジ別、2021年~2034年
- 主要動向
- 100マイル未満
- 100~200マイル
- 200マイル以上
第7章 市場推計・予測:自動車別、2021年~2034年
- 主要動向
- 乗用車
- 商用車
第8章 市場推計・予測:電池別、2021年~2034年
- 主要動向
- 密閉型鉛蓄電池
- ニッケル水素(NiMH)
- リチウムイオン
第9章 市場推計・予測:地域別、2021年~2034年
- 主要動向
- 北米
- 米国
- カナダ
- 欧州
- 英国
- ドイツ
- フランス
- スペイン
- イタリア
- ロシア
- 北欧
- アジア太平洋
- 中国
- インド
- 日本
- 韓国
- ニュージーランド
- 東南アジア
- ラテンアメリカ
- ブラジル
- メキシコ
- アルゼンチン
- 中東・アフリカ
- UAE
- 南アフリカ
- サウジアラビア
第10章 企業プロファイル
- Ashok Leyland
- Ford Motor
- General Motors
- Hyundai
- Isuzu
- IVECO
- JAC Motors
- Mahindra
- Maxus
- Mercedes-Benz Group
- Nissan Motor
- Renault
- Stellantis
- TOYOTA MOTOR
- Volkswagen
- Arrival
- Canoo
- Bollinger Motors
- Rivian Automotive
- Workhorse Group
目次
The Global Electric Vans Market, valued at USD 16.3 billion in 2024, is projected to expand at a CAGR of 15.5% between 2025 and 2034. This growth stems from increasing global efforts to combat climate change and reduce air pollution, alongside stricter government regulations on emissions. Governments worldwide are introducing incentives to promote electric vehicle adoption, encouraging businesses to transition to eco-friendly fleets. Electric vans, offering zero-emission alternatives to conventional diesel-powered vehicles, align with these regulatory frameworks and corporate sustainability goals. Improvements in battery technology are also enhancing the viability of electric vans by increasing range and decreasing production costs. These advancements, combined with environmental awareness and regulatory support, are driving demand across industries, particularly in the delivery and logistics sectors.
The electric vans market is segmented by vehicle type into commercial and personal categories. The personal segment, which held a significant share in 2024, is driven by consumer preferences for eco-friendly and cost-efficient vehicles. However, the commercial segment is anticipated to outpace it in growth as businesses adopt electric vans to reduce operating costs and meet sustainability targets. Factors such as expanded charging infrastructure and government incentives further bolster the commercial adoption of electric vans, making them a practical solution for logistics and delivery fleets.
| Market Scope | |
|---|---|
| Start Year | 2024 |
| Forecast Year | 2025-2034 |
| Start Value | $16.3 Billion |
| Forecast Value | $65.6 Billion |
| CAGR | 15.5% |
By propulsion, the market is divided into battery electric vehicles (BEVs) and hybrid electric vehicles (HEVs). In 2024, HEVs held a dominant share of the market due to their balance of fuel efficiency and convenience, as they do not solely rely on electric charging infrastructure. Despite this, BEVs are gaining traction due to advancements in battery technology, which improve range and decrease charging times. Increasing affordability and expanding charging networks are making BEVs a more attractive choice for both individual consumers and businesses. As these improvements continue, BEVs are expected to experience significant growth and capture more market share in the future.
The US is a key player in the electric vans market, accounting for a substantial share of revenue in 2024, and is projected to exceed USD 35 billion by 2034. This growth is supported by favorable government policies, tax incentives, and grants aimed at promoting electric vehicle adoption. The presence of major EV manufacturers and investments in advanced technologies further drive innovation and production. Additionally, the expansion of the country's charging infrastructure enhances the feasibility of widespread EV adoption, meeting the rising demand for sustainable transportation solutions. The US market is well-positioned to lead the transition toward cleaner commercial transportation, reflecting the broader global shift toward electric mobility.
Table of Contents
Chapter 1 Methodology & Scope
- 1.1 Research design
- 1.1.1 Research approach
- 1.1.2 Data collection methods
- 1.2 Base estimates and calculations
- 1.2.1 Base year calculation
- 1.2.2 Key trends for market estimates
- 1.3 Forecast model
- 1.4 Primary research & validation
- 1.4.1 Primary sources
- 1.4.2 Data mining sources
- 1.5 Market definitions
Chapter 2 Executive Summary
- 2.1 Industry 3600 synopsis, 2021 - 2034
Chapter 3 Industry Insights
- 3.1 Industry ecosystem analysis
- 3.2 Supplier landscape
- 3.2.1 Electric van manufacturers
- 3.2.2 Distributors
- 3.2.3 End use
- 3.3 Profit margin analysis
- 3.4 Pricing analysis
- 3.5 Patent Landscape
- 3.6 Cost Breakdown
- 3.7 Patent Landscape
- 3.8 Technology & innovation landscape
- 3.9 Key news & initiatives
- 3.10 Regulatory landscape
- 3.11 Impact forces
- 3.11.1 Growth drivers
- 3.11.1.1 Increasing awareness about environmental issues and the need to reduce greenhouse gas emissions
- 3.11.1.2 Government initiatives towards electrification of vehicles
- 3.11.1.3 Businesses and fleet operators are setting sustainability goals and incorporating electric vehicles
- 3.11.1.4 Integration of smart technologies for enhanced efficiency
- 3.11.2 Industry pitfalls & challenges
- 3.11.2.1 High initial upfront costs
- 3.11.2.2 Limited charging infrastructure
- 3.11.1 Growth drivers
- 3.12 Growth potential analysis
- 3.13 Porter’s analysis
- 3.14 PESTEL analysis
Chapter 4 Competitive Landscape, 2024
- 4.1 Introduction
- 4.2 Company market share analysis
- 4.3 Competitive positioning matrix
- 4.4 Strategic outlook matrix
Chapter 5 Market Estimates & Forecast, By Propulsion, 2021 - 2034 ($Bn, Units)
- 5.1 Key trends
- 5.2 BEV
- 5.3 HEV
- 5.3.1 FCEV
- 5.3.2 PHEV
Chapter 6 Market Estimates & Forecast, By Range, 2021 - 2034 ($Bn, Units)
- 6.1 Key trends
- 6.2 Upto 100 miles
- 6.3 100 to 200 miles
- 6.4 Above 200 miles
Chapter 7 Market Estimates & Forecast, By Vehicle, 2021 - 2034 ($Bn, Units)
- 7.1 Key trends
- 7.2 Passenger vehicle
- 7.3 Commercial vehicle
Chapter 8 Market Estimates & Forecast, By Battery, 2021 - 2034 ($Bn, Units)
- 8.1 Key trends
- 8.2 Sealed lead acid
- 8.3 Nickel Metal Hydride (NiMH)
- 8.4 Lithium Ion
Chapter 9 Market Estimates & Forecast, By Region, 2021 - 2034 ($Bn, Units)
- 9.1 Key trends
- 9.2 North America
- 9.2.1 U.S.
- 9.2.2 Canada
- 9.3 Europe
- 9.3.1 UK
- 9.3.2 Germany
- 9.3.3 France
- 9.3.4 Spain
- 9.3.5 Italy
- 9.3.6 Russia
- 9.3.7 Nordics
- 9.4 Asia Pacific
- 9.4.1 China
- 9.4.2 India
- 9.4.3 Japan
- 9.4.4 South Korea
- 9.4.5 ANZ
- 9.4.6 Southeast Asia
- 9.5 Latin America
- 9.5.1 Brazil
- 9.5.2 Mexico
- 9.5.3 Argentina
- 9.6 MEA
- 9.6.1 UAE
- 9.6.2 South Africa
- 9.6.3 Saudi Arabia
Chapter 10 Company Profiles
- 10.1 Ashok Leyland
- 10.2 Ford Motor
- 10.3 General Motors
- 10.4 Hyundai
- 10.5 Isuzu
- 10.6 IVECO
- 10.7 JAC Motors
- 10.8 Mahindra
- 10.9 Maxus
- 10.10 Mercedes-Benz Group
- 10.11 Nissan Motor
- 10.12 Renault
- 10.13 Stellantis
- 10.14 TOYOTA MOTOR
- 10.15 Volkswagen
- 10.16 Arrival
- 10.17 Canoo
- 10.18 Bollinger Motors
- 10.19 Rivian Automotive
- 10.20 Workhorse Group
- 発行日
- 発行
- Global Market Insights Inc.
- ページ情報
- 英文 180 Pages
- 納期
- 2~3営業日