
|
市場調査レポート
商品コード
1892874
バン市場の機会、成長要因、業界動向分析、および2026年から2035年までの予測Vans Market Opportunity, Growth Drivers, Industry Trend Analysis, and Forecast 2026 - 2035 |
||||||
カスタマイズ可能
|
|||||||
| バン市場の機会、成長要因、業界動向分析、および2026年から2035年までの予測 |
|
出版日: 2025年12月10日
発行: Global Market Insights Inc.
ページ情報: 英文 225 Pages
納期: 2~3営業日
|

概要
世界のバン市場は2025年に3,253億米ドルと評価され、2035年までにCAGR7.3%で成長し、6,501億米ドルに達すると予測されています。
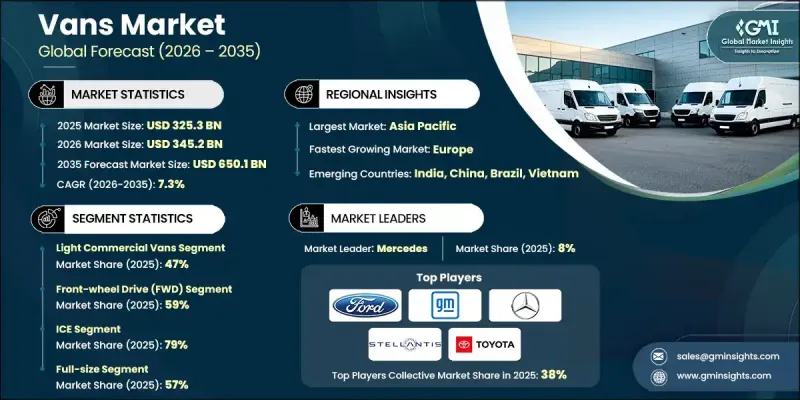
本市場には、物流、医療、ホスピタリティ、政府業務、電子商取引など幅広い活動を支える小型商用車、貨物バン、乗用バンが含まれます。企業は柔軟かつコスト効率の高い移動手段としてこれらの車両に依存しており、フリートテレマティクス、接続性、データ駆動型管理システムの進歩が業務パフォーマンスを変革しています。電気バンは初期投資額が高いもの、エネルギーコストとメンテナンスコストが低いため、フリートにとってますます有利な選択肢となりつつあります。市場の進化は、規制圧力、変化する顧客の期待、車両技術の進歩によって形作られています。急速な電動化、自律走行システムとコネクティッドシステムの統合拡大、ラストマイル配送ネットワークの変革といった動向が、製品開発やフリート戦略に大きく影響しています。持続可能性目標、政府のインセンティブ、運用効率への重点化が、世界市場における電気式バンプラットフォームへの移行を加速し続けています。
| 市場範囲 | |
|---|---|
| 開始年 | 2025年 |
| 予測年度 | 2026-2035 |
| 開始時価値 | 3,253億米ドル |
| 予測金額 | 6,501億米ドル |
| CAGR | 7.3% |
小型商用バンカテゴリーは2025年に47%のシェアを占め、2026年から2035年にかけてCAGR 7.6%で成長すると予測されています。これらのバンは通常、総重量(GVWR)が6,000~1万ポンドの範囲にあり、燃費効率、積載能力、操作性の実用的なバランスを提供し、密集した都市部での走行に適しています。リビアン、フォード・モーター、メルセデス、GMなどの主要メーカーは、配送やサービス用途に特化した新型電気自動車を相次いで投入しており、このセグメントの電動化への強い移行を後押ししています。
前輪駆動(FWD)車両セグメントは2025年に59%のシェアを占め、2035年まで年率7.2%の成長が見込まれています。その魅力は、製造コストの削減、燃費効率の向上、舗装道路でのトラクション強化、利用可能な貨物スペースを拡大する最適化された室内レイアウトなどの利点に由来します。こうした利点により、FWD構成は特に、都市部や郊外でのコスト管理と効率的な移動を重視する配送フリートやサービス事業者にとって最適な選択肢となります。
中国のバン市場は2025年に39%のシェアを占め、増加するフリート需要、広範な国内生産能力、電気式小型商用車の普及加速に支えられています。同国の物流、サービス、配送セクターは、小規模事業者から大規模フリート事業者までを対象とした多目的バンモデルの普及を推進しています。クリーンな車両を促進する政策措置、充電ネットワークへの投資、排出ガス基準の厳格化により、フリートの電動化が加速し、企業が低排出バンへの更新を推進する動機付けとなっています。
よくあるご質問
目次
第1章 調査手法
第2章 エグゼクティブサマリー
第3章 業界考察
- エコシステム分析
- サプライヤーの情勢
- 利益率分析
- コスト構造
- 各段階における付加価値
- バリューチェーンに影響を与える要因
- ディスラプション
- 業界への影響要因
- 促進要因
- 電子商取引の拡大とラストマイル配送需要の増加
- 都市化とインフラ整備の進展
- 電気自動車および低排出ガスバンへの移行
- 中小企業の成長
- フリート管理と安全性の技術的進歩
- 業界の潜在的リスク&課題
- 電気自動車および先進型バンにおける初期費用の高さ
- 地域ごとの複雑な規制
- 市場機会
- 電気バンの普及拡大
- 電子商取引配送における需要の増加
- 新興市場における拡大
- スマートな車両管理技術の導入
- 成長可能性分析
- 規制情勢
- 北米
- 米国:連邦自動車安全基準(FMVSS)
- カナダ:カナダ自動車安全基準(CMVSS)
- 欧州
- ドイツ:EU型式承認規則(EU)2018/858
- 英国:GB型式認証(ブレグジット後のUNECE規制)
- フランス:EUバン向けCO2排出性能基準(EU規則)2019/631
- イタリア:EU完成車型式認証(WVTA)枠組み
- アジア太平洋地域
- 中国:中国強制性製品安全監督管理制度(CCC)-GB規格
- インド:バーラトステージ(BS)VI排出ガス規制
- 日本:国土交通省(MLIT)型式認定
- 韓国:韓国自動車安全基準(KMVSS)
- ラテンアメリカ
- ブラジル:CONTRAN車両認証(環境・技術分析)
- メキシコ:NOM(Norma Oficial Mexicana)安全・排出基準
- 中東・アフリカ地域
- サウジアラビア:SASO(サウジ規格・計量・品質機構)技術規制
- 北米
- ポーター分析
- PESTEL分析
- 技術とイノベーションの動向
- 現在の技術動向
- 新興技術
- 価格動向
- 地域別
- 製品別
- 生産統計
- 生産拠点
- 消費拠点
- 輸出入
- コスト内訳分析
- 製造コスト構造
- 研究開発費の分析
- 規制遵守コスト
- 流通・物流コスト
- マーケティング・販売コスト
- 特許分析
- 持続可能性と環境面
- 持続可能な取り組み
- 廃棄物削減戦略
- 生産におけるエネルギー効率
- 環境に配慮した取り組み
- カーボンフットプリントに関する考慮事項
- 将来展望と機会
第4章 競合情勢
- イントロダクション
- 企業の市場シェア分析
- 北米
- 欧州
- アジア太平洋地域
- ラテンアメリカ
- 中東・アフリカ地域
- 主要市場企業の競合分析
- 競合ポジショニングマトリックス
- 戦略的展望マトリックス
- 主な発展
- 合併・買収
- 提携・協業
- 新製品の発売
- 事業拡大計画と資金調達
第5章 市場推計・予測:車種別2022 2035
- 小型商用バン
- 乗用バン
- 貨物バン
第6章 市場推計・予測:推進力別、2022-2035
- 内燃機関(ICE)
- 電気式
- ハイブリッド
第7章 市場推計・予測:規模別、2022-2035
- コンパクト
- ミドルサイズ
- フルサイズ
第8章 市場推計・予測:駆動別、2022-2035
- 前輪駆動(FWD)
- 後輪駆動(RWD)
- 全輪駆動(AWD)/4輪駆動(4x4)
第9章 市場推計・予測:最終用途別、2022-2035
- 物流・輸送
- 電子商取引および小売
- 公共部門
- ヘルスケア
- ホスピタリティ
- その他
第10章 市場推計・予測:地域別、2022-2035
- 北米
- 米国
- カナダ
- 欧州
- ドイツ
- 英国
- フランス
- イタリア
- スペイン
- ロシア
- 北欧諸国
- ベネルクス
- アジア太平洋地域
- 中国
- インド
- 日本
- オーストラリア
- 韓国
- シンガポール
- タイ
- インドネシア
- ベトナム
- ラテンアメリカ
- ブラジル
- メキシコ
- アルゼンチン
- コロンビア
- 中東・アフリカ地域
- 南アフリカ
- サウジアラビア
- アラブ首長国連邦
第11章 企業プロファイル
- 世界企業
- Ford Motor
- General Motors
- Hyundai Motor Company
- Mercedes-Benz
- Nissan
- Renault
- SAIC Motor
- Stellantis
- Tata Motors
- Toyota Motor
- 地域企業
- Ashok Leyland
- Foton Motor
- Isuzu
- Iveco
- JMC
- Mahindra &Mahindra
- Maxus
- Rivian
- 新興企業
- Arrival
- BYD
- Canoo
- Wuling Motors

