
|
市場調査レポート
商品コード
1664838
小売自動販売機の市場機会、成長促進要因、産業動向分析、2024年~2032年予測Retail Vending Machine Market Opportunity, Growth Drivers, Industry Trend Analysis, and Forecast 2024 - 2032 |
||||||
カスタマイズ可能
|
|||||||
| 小売自動販売機の市場機会、成長促進要因、産業動向分析、2024年~2032年予測 |
|
出版日: 2024年12月02日
発行: Global Market Insights Inc.
ページ情報: 英文 180 Pages
納期: 2~3営業日
|

全表示
- 概要
- 目次
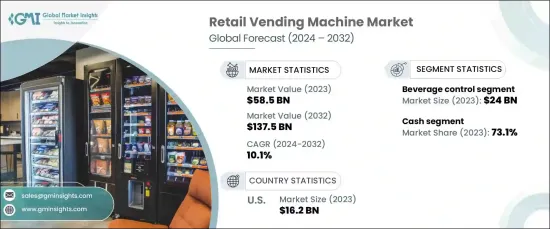
世界の小売自動販売機市場は、2023年に585億米ドルとなり、2024年から2032年にかけてCAGR10.1%で成長する見通しです。
この成長の原動力は、消費者の選好の変化とテクノロジーの進歩です。現代の消費者は利便性と商品への即時アクセスを優先するため、自動販売機は進化し、従来のスナックや飲料だけでなく多様な商品を提供するようになりました。
キャッシュレス決済システムやスマートテクノロジーのようなイノベーションは、シームレスな取引を可能にし、ユーザーエクスペリエンスを向上させることで、自動販売機の魅力を高めています。小売業者は、人通りの多い戦略的な場所に自動販売機を設置する傾向が強まっています。このシフトは、近年注目されている非接触で効率的なショッピングを目指す幅広い動向を反映しています。ショッピング行動が進化し続ける中、自動販売機は小売業界においてより大きな役割を果たすと予想されます。
| 市場範囲 | |
|---|---|
| 開始年 | 2023年 |
| 予測年 | 2024年~2032年 |
| 開始金額 | 585億米ドル |
| 予測金額 | 1,375億米ドル |
| CAGR | 10.1% |
市場はタイプ別に、食品、飲料、ゲーム、タバコ、キャンディ、美容製品、チケットなどのカテゴリーに区分されます。2023年の飲料部門の売上は約240億米ドルで、2032年までのCAGRは10.6%と予測されます。このセグメントの拡大は、都市化と多忙なライフスタイルに後押しされた、RTDオプションに対する需要の高まりが原動力となっています。リアルタイムの在庫追跡を含む自動販売機機能の強化が、この成長にさらに寄与しています。さらに、より健康的な飲料の追加は、オーガニックや低糖質オプションへの選好の高まりと一致し、このセグメントの業績を強化しています。
支払い方法は現金とキャッシュレスに分かれます。現金ベースの自動販売機は2023年に市場シェアの73.1%を占め、2024年から2032年にかけてCAGR9.5%で成長すると予測されます。一方、キャッシュレスシステムは同期間に11.4%という高い成長率で成長すると予測されています。現金取引は、接続が限られた地域での信頼性と、企業にとって手頃な価格であることから、依然として人気が高いです。これらの機械はメンテナンスも最小限で済むため、中小企業にとっては魅力的です。
北米市場では、米国が2023年に162億米ドルの評価額でリードし、2032年までのCAGRは10.5%と予測されました。技術の進歩、より健康的な製品の取り込み、データ主導による製品提供の最適化などの要因が成長を促進しています。小売業者は、迅速でアクセスしやすく、健康志向のショッピングソリューションを求める消費者の進化する需要に対応し、市場は拡大を続けています。
目次
第1章 調査手法と調査範囲
- 市場範囲と定義
- 基本推定と計算
- 予測計算
- データソース
- 一次
- 二次
- 有料情報源
- 公的情報源
第2章 エグゼクティブサマリー
第3章 業界洞察
- 業界エコシステム分析
- バリューチェーンに影響を与える要因
- 利益率分析
- 変革
- 将来の展望
- メーカー
- 流通業者
- サプライヤーの状況
- 利益率分析
- 技術概要
- 主なニュースと取り組み
- 規制状況
- 技術概要
- 影響要因
- 成長促進要因
- 非接触型決済オプションへの需要の高まり
- 外出先での間食傾向の高まり
- 自動販売機機能の技術的進歩
- 業界の潜在的リスク・課題
- 消費者の購買における価格感度
- 従来の小売店との競合
- 成長促進要因
- 成長可能性分析
- ポーター分析
- PESTEL分析
第4章 競合情勢
- イントロダクション
- 企業シェア分析
- 競合のポジショニングマトリックス
- 戦略展望マトリックス
第5章 市場推計・予測:タイプ別、2021年~2032年
- 主要動向
- 食品
- 飲料
- ゲーム/アミューズメント
- タバコ
- 菓子類
- 美容・パーソナルケア
- チケット
- その他
第6章 市場推計・予測:用途別、2021年~2032年
- 主要動向
- 商業施設
- オフィス
- 公共施設
- その他
第7章 市場推計・予測:決済モード別、2021年~2032年
- 主要動向
- 現金
- キャッシュレス
第8章 市場推計・予測:地域別、2021年~2032年
- 主要動向
- 北米
- 米国
- カナダ
- 欧州
- 英国
- ドイツ
- フランス
- イタリア
- スペイン
- アジア太平洋
- 中国
- 日本
- インド
- 韓国
- オーストラリア
- マレーシア
- インドネシア
- ラテンアメリカ
- ブラジル
- メキシコ
- 中東・アフリカ
- UAE
- サウジアラビア
- 南アフリカ
第9章 企業プロファイル
- Azkoyen Group
- Bulk Vending Systems
- Cantaloupe Systems
- Continental Vending Inc.
- Crane Merchandising Systems
- Fast Vending Machines LLC
- Fuji Electric Co., Ltd.
- Glory Ltd.
- Orasesta S.p.A.
- R.S. Hughes
- Royal Vendors, Inc.
- Sanden Holding Corp.
- Seaga Manufacturing Inc.
- Sellmat S.r.l.
- Westomatic Vending Services Limited
The Global Retail Vending Machine Market, valued at USD 58.5 billion in 2023, is poised to grow at a CAGR of 10.1% from 2024 to 2032. This growth is fueled by shifting consumer preferences and advancements in technology. Modern consumers prioritize convenience and instant access to products, leading vending machines to evolve and offer a diverse array of items beyond traditional snacks and drinks.
Innovations like cashless payment systems and smart technology have enhanced the appeal of vending machines by enabling seamless transactions and improving user experience. Retailers are increasingly adopting vending machines in strategic locations to capitalize on high foot traffic. This shift reflects a broader trend toward contactless and efficient shopping, which has gained prominence in recent years. As shopping behaviors continue to evolve, vending machines are expected to play a larger role in the retail landscape.
| Market Scope | |
|---|---|
| Start Year | 2023 |
| Forecast Year | 2024-2032 |
| Start Value | $58.5 Billion |
| Forecast Value | $137.5 Billion |
| CAGR | 10.1% |
The market is segmented by type into categories such as food, beverages, games, tobacco, candy, beauty products, tickets, and more. In 2023, the beverage segment generated approximately USD 24 billion in revenue and is projected to grow at a CAGR of 10.6% through 2032. The segment's expansion is driven by the rising demand for ready-to-drink options, fueled by urbanization and busy lifestyles. Enhanced vending machine features, including real-time inventory tracking, have further contributed to this growth. Additionally, the inclusion of healthier beverages aligns with the increasing preference for organic and low-sugar options, strengthening the segment's performance.
Payment methods are divided into cash and cashless transactions. Cash-based vending machines held 73.1% of the market share in 2023 and are expected to grow at a CAGR of 9.5% from 2024 to 2032. Meanwhile, cashless systems are predicted to grow at a higher rate of 11.4% during the same period. Cash transactions remain popular due to their reliability in areas with limited connectivity and their affordability for businesses. These machines also require minimal maintenance, making them attractive for smaller enterprises.
In the North American market, the United States led with a valuation of USD 16.2 billion in 2023 and a projected CAGR of 10.5% through 2032. Factors such as technological advancements, the inclusion of healthier products, and data-driven optimization of product offerings are driving growth. The market continues to expand as retailers address evolving consumer demands for quick, accessible, and health-conscious shopping solutions.
Table of Contents
Chapter 1 Methodology & Scope
- 1.1 Market scope & definitions
- 1.2 Base estimates & calculations
- 1.3 Forecast calculations
- 1.4 Data sources
- 1.4.1 Primary
- 1.4.2 Secondary
- 1.4.2.1 Paid sources
- 1.4.2.2 Public sources
Chapter 2 Executive Summary
- 2.1 Industry synopsis, 2021-2032
Chapter 3 Industry Insights
- 3.1 Industry ecosystem analysis
- 3.1.1 Factor affecting the value chain
- 3.1.2 Profit margin analysis
- 3.1.3 Disruptions
- 3.1.4 Future outlook
- 3.1.5 Manufacturers
- 3.1.6 Distributors
- 3.2 Supplier landscape
- 3.3 Profit margin analysis
- 3.4 Technological overview
- 3.5 Key news & initiatives
- 3.6 Regulatory landscape
- 3.7 Technological overview
- 3.8 Impact forces
- 3.8.1 Growth drivers
- 3.8.1.1 Increasing demand for contactless payment options
- 3.8.1.2 Rising trend of on-the-go snacking
- 3.8.1.3 Technological advancements in vending machine features
- 3.8.2 Industry pitfalls & challenges
- 3.8.2.1 Price sensitivity in consumer purchases
- 3.8.2.2 Competition from traditional retail outlets
- 3.8.1 Growth drivers
- 3.9 Growth potential analysis
- 3.10 Porter’s analysis
- 3.11 PESTEL analysis
Chapter 4 Competitive Landscape, 2023
- 4.1 Introduction
- 4.2 Company market share analysis
- 4.3 Competitive positioning matrix
- 4.4 Strategic outlook matrix
Chapter 5 Market Estimates & Forecast, By Type, 2021-2032 (USD Billion) (Thousand Units)
- 5.1 Key trends
- 5.2 Food
- 5.3 Beverage
- 5.4 Games/Amusement
- 5.5 Tobacco
- 5.6 Candy & confectionery
- 5.7 Beauty & personal care
- 5.8 Ticket
- 5.9 Others
Chapter 6 Market Estimates & Forecast, By Application, 2021-2032 (USD Billion) (Thousand Units)
- 6.1 Key trends
- 6.2 Commercial places
- 6.3 Offices
- 6.4 Public places
- 6.5 Others
Chapter 7 Market Estimates & Forecast, By Payment Mode, 2021-2032 (USD Billion) (Thousand Units)
- 7.1 Key trends
- 7.2 Cash
- 7.3 Cashless
Chapter 8 Market Estimates & Forecast, By Region, 2021-2032 (USD Billion) (Thousand Units)
- 8.1 Key trends
- 8.2 North America
- 8.2.1 U.S.
- 8.2.2 Canada
- 8.3 Europe
- 8.3.1 UK
- 8.3.2 Germany
- 8.3.3 France
- 8.3.4 Italy
- 8.3.5 Spain
- 8.4 Asia Pacific
- 8.4.1 China
- 8.4.2 Japan
- 8.4.3 India
- 8.4.4 South Korea
- 8.4.5 Australia
- 8.4.6 Malaysia
- 8.4.7 Indonesia
- 8.5 Latin America
- 8.5.1 Brazil
- 8.5.2 Mexico
- 8.6 MEA
- 8.6.1 UAE
- 8.6.2 Saudi Arabia
- 8.6.3 South Africa
Chapter 9 Company Profiles
- 9.1 Azkoyen Group
- 9.2 Bulk Vending Systems
- 9.3 Cantaloupe Systems
- 9.4 Continental Vending Inc.
- 9.5 Crane Merchandising Systems
- 9.6 Fast Vending Machines LLC
- 9.7 Fuji Electric Co., Ltd.
- 9.8 Glory Ltd.
- 9.9 Orasesta S.p.A.
- 9.10 R.S. Hughes
- 9.11 Royal Vendors, Inc.
- 9.12 Sanden Holding Corp.
- 9.13 Seaga Manufacturing Inc.
- 9.14 Sellmat S.r.l.
- 9.15 Westomatic Vending Services Limited

