
|
市場調査レポート
商品コード
1666972
持続可能な航空燃料市場の機会、成長促進要因、産業動向分析、2025~2034年の予測Sustainable Aviation Fuel Market Opportunity, Growth Drivers, Industry Trend Analysis, and Forecast 2025 - 2034 |
||||||
カスタマイズ可能
|
|||||||
| 持続可能な航空燃料市場の機会、成長促進要因、産業動向分析、2025~2034年の予測 |
|
出版日: 2024年12月04日
発行: Global Market Insights Inc.
ページ情報: 英文 240 Pages
納期: 2~3営業日
|

全表示
- 概要
- 目次
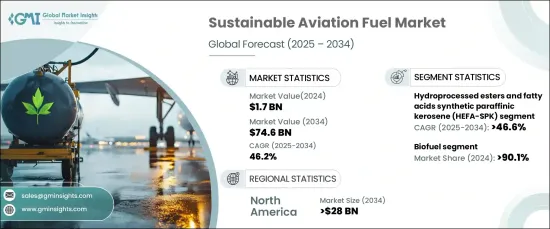
世界の持続可能な航空燃料市場は、2024年に17億米ドルと評価され、2025年から2034年にかけて46.2%のCAGRで著しい成長を遂げると予測されています。
航空セクターが環境フットプリントを最小限に抑えるという圧力の高まりに直面する中、SAFは不可欠なソリューションとして台頭してきています。これらの燃料は、バイオマス、農業残渣、廃油などの再生可能な資源に由来しており、従来のジェット燃料に比べて二酸化炭素排出量を大幅に削減できます。
環境問題に対する意識の高まりから、航空会社や乗客はより環境に優しい代替燃料を好むようになっています。SAFは、航空会社が持続可能性の目標を達成し、環境評価を高め、国際的な二酸化炭素削減義務に沿うことを支援します。このシフトは、SAFの生産とグリーン航空技術への投資を促進すると予想されます。需要の増加は生産能力と技術革新を後押しし、航空業界の変革におけるSAFの役割をさらに強固なものにすると思われます。
| 市場範囲 | |
|---|---|
| 開始年 | 2024 |
| 予測年 | 2025-2034 |
| 開始金額 | 17億米ドル |
| 予測金額 | 746億米ドル |
| CAGR | 46.2% |
世界各国の政府は、航空が環境に与える影響を軽減するための戦略を実施しています。SAFの生産、採用、技術革新を促進することを目的とした政策が広まりつつあり、この分野の成長を加速させています。税制優遇措置、補助金、その他の資金提供プログラムは、持続可能な航空技術の進歩を促進しながら、世界の気候変動目標の達成を支援しています。
燃料の種類から見ると、SAF市場はバイオ燃料、水素燃料、液体燃料、ガス液化燃料に区分されます。バイオ燃料は2024年のシェア90.1%以上で市場を独占しています。植物油や農業残渣のような生物学的材料から製造されるバイオ燃料は、従来のジェット燃料に代わるよりクリーンな燃料です。これらの燃料は、既存の航空機エンジンに大きな変更を加えることなく、従来のジェット燃料と混合することができるため、航空分野における排出量削減のための現実的な選択肢となっています。その開発は、多様な原料の選択肢と生産技術の進歩によって支えられています。
技術的には、水添エステル・脂肪酸合成パラフィンケロシン(HEFA-SPK)、フィッシャー・トロプシュ合成パラフィンケロシン(FT-SPK)、アルコール-ジェット合成パラフィンケロシン(ATJ-SPK)、およびその他の方法が市場に含まれます。HEFA-SPKは、廃油や油脂などの原料を使用して高品質のドロップイン燃料を製造する高い適合性と拡張性でリードしています。HEFA-SPKは汎用性が高く、既存の航空インフラとの整合性が高いため、持続可能性の目標達成に大きく貢献します。
北米はSAF市場を独占し、2034年までに280億米ドル以上に達すると予想されています。堅調な政策、技術進歩、投資が、特に米国を中心にこの地域の成長を牽引しています。同地域のSAF開発におけるリーダーシップは、排出量削減とグリーン航空技術の進歩に対する広範なコミットメントを反映しています。
目次
第1章 調査手法と調査範囲
- 市場範囲と定義
- 基本推定と計算
- 予測計算
- データソース
- 1次データ
- 2次データ
- 有料情報源
- 公的情報源
第2章 エグゼクティブサマリー
第3章 業界洞察
- エコシステム分析
- バリューチェーンに影響を与える要因
- 利益率分析
- 破壊
- 将来の展望
- メーカー
- 流通業者
- サプライヤーの状況
- 利益率分析
- 主要ニュース
- 規制状況
- 影響要因
- 促進要因
- 持続可能な航空燃料ソリューションに対する需要の増加
- 世界のグリーン航空イニシアティブを支援する政府政策
- SAF製造技術と効率の向上
- 再生可能エネルギーおよび航空分野への投資の増加
- 環境に優しい航空旅行に対する消費者の嗜好の高まり
- 業界の潜在的リスク&課題
- 持続可能な航空燃料の高い製造コスト
- SAF生産に利用可能な原料が限られていること
- 促進要因
- 成長可能性分析
- ポーターの分析
- PESTEL分析
第4章 競合情勢
- イントロダクション
- 企業シェア分析
- 競合のポジショニング・マトリックス
- 戦略展望マトリックス
第5章 市場推計・予測:燃料タイプ別、2021年~2034年
- 主要動向
- バイオ燃料
- 水素燃料
- パワー・ツー・リキッド
- ガス・ツー・リキッド
第6章 市場推計・予測:技術別、2021年~2034年
- 主要動向
- 水素化エステル・脂肪酸合成パラフィン灯油(HEFA-SPK)
- フィッシャー・トロプシュ合成パラフィン灯油(FT-SPK)
- 発酵水添糖からの合成イソパラフィン(HFS-SIP)
- アルコール-ジェット合成パラフィン灯油(ATJ-SPK)
- 触媒的加水分解ジェット(CHJ)
第7章 市場推計・予測:ブレンド容量別、2021~2034年
- 主要動向
- 30%未満
- 30%~50%未満
- 50%以上
第8章 市場推計・予測:最終用途別、2021-2034年
- 主要動向
- 航空会社
- 大手航空会社
- 中堅航空会社
- 小規模航空会社
- 非定期運航航空会社
- 政府/軍事
第9章 市場推計・予測:地域別、2021年~2034年
- 主要動向
- 北米
- 米国
- カナダ
- 欧州
- 英国
- ドイツ
- フランス
- イタリア
- スペイン
- ロシア
- アジア太平洋
- 中国
- インド
- 日本
- 韓国
- オーストラリア
- ラテンアメリカ
- ブラジル
- メキシコ
- 中東・アフリカ
- 南アフリカ
- サウジアラビア
- アラブ首長国連邦
第10章 企業プロファイル
- Aemetis, Inc.
- Alder Energy, LLC
- Amyris
- BP Plc
- Cemvita
- DG Fuels
- Fulcrum BioEnergy Inc.
- Gevo Inc.
- LanzaJet
- Neste
- Northwest Advanced Bio-Fuels, LLC
- OMV Aktiengesellschaft
- Preem AB
- Red Rock Biofuels
- SAF Plus International Group
- Sasol Corporation
- Shell
- SkyNRG BV
- TotalEnergies SE
- USA BioEnergy
- WasteFuel
- World Energy
The Global Sustainable Aviation Fuel Market was valued at USD 1.7 billion in 2024 and is projected to grow at a remarkable CAGR of 46.2% from 2025 to 2034. As the aviation sector faces mounting pressure to minimize its environmental footprint, SAF is emerging as a vital solution. These fuels are derived from renewable sources such as biomass, agricultural residues, and waste oils, offering a significantly reduced carbon footprint compared to traditional jet fuels.
Growing awareness of environmental issues has prompted airlines and passengers alike to favor greener alternatives. SAF supports airlines in meeting sustainability objectives, enhancing environmental ratings, and aligning with international carbon-reduction mandates. This shift is expected to drive investments in SAF production and green aviation technologies. Increasing demand will likely boost production capacity and innovation, further solidifying SAF's role in transforming the aviation industry.
| Market Scope | |
|---|---|
| Start Year | 2024 |
| Forecast Year | 2025-2034 |
| Start Value | $1.7 Billion |
| Forecast Value | $74.6 Billion |
| CAGR | 46.2% |
Governments around the world are implementing strategies to mitigate the environmental impact of aviation. Policies aimed at promoting SAF production, adoption, and innovation are becoming widespread, accelerating the sector's growth. Tax incentives, subsidies, and other funding programs are helping to achieve global climate targets while fostering advancements in sustainable aviation technologies.
In terms of fuel types, the SAF market is segmented into biofuels, hydrogen fuel, power-to-liquid, and gas-to-liquid. Biofuels dominate the market with over 90.1% of the share in 2024. Produced from biological materials like plant oils and agricultural residues, biofuels represent a cleaner alternative to conventional jet fuels. These fuels can be blended with traditional jet fuels without significant changes to existing aircraft engines, making them a practical choice for reducing emissions in the aviation sector. Their development is supported by diverse feedstock options and advancements in production techniques.
Technologically, the market includes hydroprocessed esters and fatty acids synthetic paraffinic kerosene (HEFA-SPK), Fischer-Tropsch synthetic paraffinic kerosene (FT-SPK), alcohol-to-jet synthetic paraffinic kerosene (ATJ-SPK), and other methods. HEFA-SPK leads with its high compatibility and scalability, using feedstocks such as waste oils and fats to produce a high-quality, drop-in fuel. Its versatility and alignment with existing aviation infrastructure make it a key contributor to sustainability goals.
North America is anticipated to dominate the SAF market, reaching over USD 28 billion by 2034. Robust policies, technological advancements, and investments are driving regional growth, particularly in the US. The region's leadership in SAF development reflects a broader commitment to reducing emissions and advancing green aviation technologies.
Table of Contents
Chapter 1 Methodology & Scope
- 1.1 Market scope & definitions
- 1.2 Base estimates & calculations
- 1.3 Forecast calculations
- 1.4 Data sources
- 1.4.1 Primary
- 1.4.2 Secondary
- 1.4.2.1 Paid sources
- 1.4.2.2 Public sources
Chapter 2 Executive Summary
- 2.1 Industry synopsis, 2021-2034
Chapter 3 Industry Insights
- 3.1 Industry ecosystem analysis
- 3.1.1 Factor affecting the value chain
- 3.1.2 Profit margin analysis
- 3.1.3 Disruptions
- 3.1.4 Future outlook
- 3.1.5 Manufacturers
- 3.1.6 Distributors
- 3.2 Supplier landscape
- 3.3 Profit margin analysis
- 3.4 Key news & initiatives
- 3.5 Regulatory landscape
- 3.6 Impact forces
- 3.6.1 Growth drivers
- 3.6.1.1 Increasing demand for sustainable aviation fuel solutions
- 3.6.1.2 Government policies supporting green aviation initiatives globally
- 3.6.1.3 Advancements in SAF production technology and efficiency
- 3.6.1.4 Rising investments in renewable energy and aviation sectors
- 3.6.1.5 Growing consumer preference for eco-friendly air travel
- 3.6.2 Industry pitfalls & challenges
- 3.6.2.1 High production costs of sustainable aviation fuels
- 3.6.2.2 Limited availability of feedstock for SAF production
- 3.6.1 Growth drivers
- 3.7 Growth potential analysis
- 3.8 Porter’s analysis
- 3.9 PESTEL analysis
Chapter 4 Competitive Landscape, 2024
- 4.1 Introduction
- 4.2 Company market share analysis
- 4.3 Competitive positioning matrix
- 4.4 Strategic outlook matrix
Chapter 5 Market Estimates & Forecast, By Fuel Type, 2021-2034 (USD Million & Gallons)
- 5.1 Key trends
- 5.2 Biofuel
- 5.3 Hydrogen fuel
- 5.4 Power-to-Liquid
- 5.5 Gas-to-Liquid
Chapter 6 Market Estimates & Forecast, By Technology, 2021-2034 (USD Million & Gallons)
- 6.1 Key trends
- 6.2 Hydroprocessed Esters and Fatty Acids Synthetic Paraffinic Kerosene (HEFA-SPK)
- 6.3 Fischer-Tropsch Synthetic Paraffinic Kerosene (FT-SPK)
- 6.4 Synthetic Iso-Paraffins from Fermented Hydroprocessed Sugar (HFS-SIP)
- 6.5 Alcohol-to-Jet Synthetic Paraffinic Kerosene (ATJ-SPK)
- 6.6 Catalytic Hydrothermolysis Jet (CHJ)
Chapter 7 Market Estimates & Forecast, By Blending Capacity, 2021-2034 (USD Million & Gallons)
- 7.1 Key trends
- 7.2 Below 30%
- 7.3 30% to 50%
- 7.4 Above 50%
Chapter 8 Market Estimates & Forecast, By End Use, 2021-2034 (USD Million & Gallons)
- 8.1 Key trends
- 8.2 Airline
- 8.2.1 Large airline
- 8.2.2 Medium airline
- 8.2.3 Small airline
- 8.3 Non-scheduled operator
- 8.4 Government/military
Chapter 9 Market Estimates & Forecast, By Region, 2021-2034 (USD Million & Gallons)
- 9.1 Key trends
- 9.2 North America
- 9.2.1 U.S.
- 9.2.2 Canada
- 9.3 Europe
- 9.3.1 UK
- 9.3.2 Germany
- 9.3.3 France
- 9.3.4 Italy
- 9.3.5 Spain
- 9.3.6 Russia
- 9.4 Asia Pacific
- 9.4.1 China
- 9.4.2 India
- 9.4.3 Japan
- 9.4.4 South Korea
- 9.4.5 Australia
- 9.5 Latin America
- 9.5.1 Brazil
- 9.5.2 Mexico
- 9.6 MEA
- 9.6.1 South Africa
- 9.6.2 Saudi Arabia
- 9.6.3 UAE
Chapter 10 Company Profiles
- 10.1 Aemetis, Inc.
- 10.2 Alder Energy, LLC
- 10.3 Amyris
- 10.4 BP Plc
- 10.5 Cemvita
- 10.6 DG Fuels
- 10.7 Fulcrum BioEnergy Inc.
- 10.8 Gevo Inc.
- 10.9 LanzaJet
- 10.10 Neste
- 10.11 Northwest Advanced Bio-Fuels, LLC
- 10.12 OMV Aktiengesellschaft
- 10.13 Preem AB
- 10.14 Red Rock Biofuels
- 10.15 SAF Plus International Group
- 10.16 Sasol Corporation
- 10.17 Shell
- 10.18 SkyNRG BV
- 10.19 TotalEnergies SE
- 10.20 USA BioEnergy
- 10.21 WasteFuel
- 10.22 World Energy

