
|
市場調査レポート
商品コード
1667156
植物性天然繊維の市場機会、成長促進要因、産業動向分析、2025年~2034年予測Vegetal Natural Fiber Market Opportunity, Growth Drivers, Industry Trend Analysis, and Forecast 2025 - 2034 |
||||||
カスタマイズ可能
|
|||||||
| 植物性天然繊維の市場機会、成長促進要因、産業動向分析、2025年~2034年予測 |
|
出版日: 2024年12月27日
発行: Global Market Insights Inc.
ページ情報: 英文 200 Pages
納期: 2~3営業日
|

全表示
- 概要
- 目次
世界の植物性天然繊維市場は、2024年に55億米ドルとなり、2025年から2034年までのCAGRは7.2%と予測されています。
綿、ジュート、麻、亜麻、サイザル麻、ココナッツなどの植物由来のこれらの繊維は、合成材料に代わる環境意識の高い代替品を提供します。強度、汎用性、生分解性で知られるこれらの繊維は、持続可能な慣行の導入を目指す産業界でますます求められています。環境意識が高まるにつれ、繊維製品、自動車部品、建材における天然繊維の需要も高まっています。消費者は、その有機的特性と環境への影響の少なさから、天然繊維を使用した製品を好んでいます。この動向は、様々な用途で環境に優しいソリューションや持続可能な素材を採用する方向への幅広いシフトを反映しています。
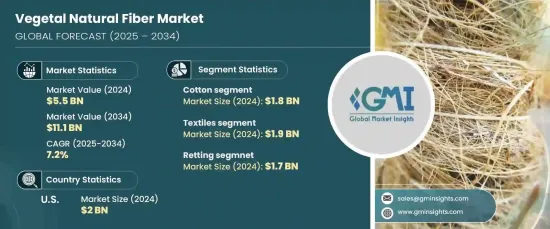
綿セグメントは2024年に18億米ドルを占め、CAGR7.2%で成長すると予測されています。ジュート、麻、亜麻、サイザル麻、ココナッツなどの他の植物性繊維は、その持続可能性と機能性によって市場で牽引力を増しています。ジュートや麻の需要は包装や建築などの産業で増加しており、亜麻は家庭用家具に使用されています。サイザル麻とココナツ繊維も、工業用途や農業用途での有用性から拡大傾向にあります。
| 市場範囲 | |
|---|---|
| 開始年 | 2024年 |
| 予測年 | 2025年~2034年 |
| 開始金額 | 55億米ドル |
| 予測金額 | 111億米ドル |
| CAGR | 7.2% |
用途別では、テキスタイル部門が2024年に19億米ドルを占め、予測期間を通じてCAGR6.3%で拡大すると予測されています。植物性天然繊維は、そのユニークな特性により、自動車から農業まで多様な産業に組み込まれています。自動車分野では、これらの繊維は軽量で持続可能な内装部品に貢献しています。建設用途でも、環境に優しい複合材料のために植物性繊維が採用されています。パッケージングソリューションでは、持続可能性に対する需要の高まりに対応するために植物性繊維の利用が増加しており、農業用途では土壌改良や侵食防止が行われています。
生の植物性繊維を使用可能な材料に変えるには、加工方法が重要な役割を果たします。2024年に17億米ドルと評価され、CAGR6.1%の成長が見込まれる一般的な加工法であるレッティングは、植物性繊維を水に浸して木質部分から分離します。脱皮や紡績といった他の方法は、清潔で高品質な繊維を生産するのに重要であり、その後、織物やニットにして様々な生地の形にします。
米国の植物性天然繊維市場は2024年に20億米ドルとなり、2034年までCAGR6.5%で成長すると予想されています。この成長の原動力は、同国の経済力、革新的な産業部門、持続可能性と消費者動向への戦略的注力です。好意的な政策と先進的なインフラが、米国を北米市場のリーダーとしてさらに位置づけています。
目次
第1章 調査手法と調査範囲
- 市場範囲と定義
- 基本推定と計算
- 予測計算
- データソース
- 一次
- 二次
- 有料ソース
- 公的ソース
第2章 エグゼクティブサマリー
第3章 業界洞察
- 業界エコシステム分析
- バリューチェーンに影響を与える要因
- 利益率分析
- 変革
- 将来の展望
- メーカー
- 流通業者
- サプライヤーの状況
- 利益率分析
- 主要ニュース
- 規制状況
- 影響要因
- 成長促進要因
- 持続可能な材料への需要の高まり
- 繊維・ファッション産業の拡大
- 自動車産業への採用
- 業界の潜在的リスク・課題
- 認識と教育が限定的
- 成長促進要因
- 成長可能性分析
- ポーター分析
- PESTEL分析
第4章 競合情勢
- イントロダクション
- 企業市場シェア分析
- 競合のポジショニングマトリックス
- 戦略展望マトリックス
第5章 市場推計・予測:製品別、2021年~2034年
- 主要動向
- 綿繊維
- ジュート繊維
- 麻繊維
- 亜麻繊維(リネン)
- サイザル麻繊維
- ココナッツ繊維(コアー)
第6章 市場推計・予測:用途別、2021年~2034年
- 主要動向
- 繊維産業
- 自動車産業
- 建設材料
- 包装
- 農業・園芸用途
- ジオテキスタイル
第7章 市場推計・予測:加工方法別、2021年~2034年
- 主要動向
- リッティング
- 剥離
- 紡績
- 織り物・編み物
- 複合材料製造
第8章 市場推計・予測:地域別、2021年~2034年
- 主要動向
- 北米
- 米国
- カナダ
- 欧州
- 英国
- ドイツ
- フランス
- イタリア
- スペイン
- ロシア
- アジア太平洋
- 中国
- インド
- 日本
- 韓国
- オーストラリア
- ラテンアメリカ
- ブラジル
- メキシコ
- 中東・アフリカ
- 南アフリカ
- サウジアラビア
- アラブ首長国連邦
第9章 企業プロファイル
- Aditya Birla Group
- Antex
- Golden Peacock Group
- Kelheim Fibres
- Lenzing
- Nufarm
- Safilens
- Sateri Holdings
- Shandong Jilin Chemical Fiber
- Shandong Ruyi Textile Group
- Shanghai Chemical Industries
- Shenglong Group
- Suominen Oyj
- Thai Rayon PCL
- Zhejiang Huafu Chemical Fiber
The Global Vegetal Natural Fiber Market, valued at USD 5.5 billion in 2024, is projected to experience a CAGR of 7.2% from 2025 to 2034. These fibers, derived from plant sources such as cotton, jute, hemp, flax, sisal, and coconut, offer an eco-conscious alternative to synthetic materials. Known for their strength, versatility, and biodegradable nature, these fibers are increasingly sought after across industries aiming to adopt sustainable practices. As environmental awareness grows, so does the demand for natural fibers in textiles, automotive components, and building materials. Consumers are favoring products made with natural fibers due to their organic properties and minimal environmental impact. This trend reflects a broader shift toward adopting environmentally friendly solutions and sustainable materials in various applications.
The cotton segment accounted for USD 1.8 billion in 2024 and is forecasted to grow at a CAGR of 7.2%. Other vegetal fibers such as jute, hemp, flax, sisal, and coconut are gaining traction in markets driven by their sustainability and functionality. The demand for jute and hemp is increasing in industries like packaging and construction, while flax finds use in home furnishings. Sisal and coconut fibers are also witnessing expansion due to their utility in industrial and agricultural applications.
| Market Scope | |
|---|---|
| Start Year | 2024 |
| Forecast Year | 2025-2034 |
| Start Value | $5.5 Billion |
| Forecast Value | $11.1 Billion |
| CAGR | 7.2% |
In terms of application, the textiles sector held USD 1.9 billion in 2024 and is projected to expand at a CAGR of 6.3% through the forecast period. Vegetal natural fibers are being integrated into diverse industries, from automotive to agriculture, owing to their unique properties. In the automotive sector, these fibers contribute to lightweight and sustainable interior components. Construction applications are also embracing vegetal fibers for eco-friendly composite materials. Packaging solutions increasingly use these fibers to meet the growing demand for sustainability, while agricultural uses include soil conditioning and erosion control.
Processing methods play a significant role in transforming raw vegetal fibers into usable materials. Retting, a common process valued at USD 1.7 billion in 2024 and expected to grow at a CAGR of 6.1%, involves soaking plant fibers in water to separate them from woody parts. Other methods like decortication and spinning are critical in producing clean, high-quality fibers, which are then woven or knitted into various fabric forms.
The U.S. vegetal natural fiber market, valued at USD 2 billion in 2024, is expected to grow at a 6.5% CAGR through 2034. This growth is fueled by the country's economic strength, innovative industrial sector, and strategic focus on sustainability and consumer trends. Favorable policies and advanced infrastructure further position the U.S. as a leader in the North American market.
Table of Contents
Chapter 1 Methodology & Scope
- 1.1 Market scope & definitions
- 1.2 Base estimates & calculations
- 1.3 Forecast calculations
- 1.4 Data sources
- 1.4.1 Primary
- 1.4.2 Secondary
- 1.4.2.1 Paid sources
- 1.4.2.2 Public sources
Chapter 2 Executive Summary
- 2.1 Industry synopsis, 2021-2034
Chapter 3 Industry Insights
- 3.1 Industry ecosystem analysis
- 3.1.1 Factor affecting the value chain
- 3.1.2 Profit margin analysis
- 3.1.3 Disruptions
- 3.1.4 Future outlook
- 3.1.5 Manufacturers
- 3.1.6 Distributors
- 3.2 Supplier landscape
- 3.3 Profit margin analysis
- 3.4 Key news & initiatives
- 3.5 Regulatory landscape
- 3.6 Impact forces
- 3.6.1 Growth drivers
- 3.6.1.1 Increasing demand for sustainable materials
- 3.6.1.2 Expanding textile and fashion industry
- 3.6.1.3 Automotive industry adoption
- 3.6.2 Industry pitfalls & challenges
- 3.6.2.1 Limited awareness and education
- 3.6.1 Growth drivers
- 3.7 Growth potential analysis
- 3.8 Porter’s analysis
- 3.9 PESTEL analysis
Chapter 4 Competitive Landscape, 2024
- 4.1 Introduction
- 4.2 Company market share analysis
- 4.3 Competitive positioning matrix
- 4.4 Strategic outlook matrix
Chapter 5 Market Estimates & Forecast, By Product, 2021-2034 (USD Million) (Tons)
- 5.1 Key trends
- 5.2 Cotton fibers
- 5.3 Jute fibers
- 5.4 Hemp fibers
- 5.5 Flax fibers (linens)
- 5.6 Sisal fibers
- 5.7 Coconut fibers (coir)
Chapter 6 Market Estimates & Forecast, By Application, 2021-2034 (USD Million) (Tons)
- 6.1 Key trends
- 6.2 Textiles
- 6.3 Automotive industry
- 6.4 Construction materials
- 6.5 Packaging
- 6.6 Agricultural and horticultural applications
- 6.7 Geotextiles
Chapter 7 Market Estimates & Forecast, By Processing Methods, 2021-2034 (USD Million) (Tons)
- 7.1 Key trends
- 7.2 Retting
- 7.3 Decortication
- 7.4 Spinning
- 7.5 Weaving and knitting
- 7.6 Composite manufacturing
Chapter 8 Market Estimates & Forecast, By Region, 2021-2034 (USD Million) (Tons)
- 8.1 Key trends
- 8.2 North America
- 8.2.1 U.S.
- 8.2.2 Canada
- 8.3 Europe
- 8.3.1 UK
- 8.3.2 Germany
- 8.3.3 France
- 8.3.4 Italy
- 8.3.5 Spain
- 8.3.6 Russia
- 8.4 Asia Pacific
- 8.4.1 China
- 8.4.2 India
- 8.4.3 Japan
- 8.4.4 South Korea
- 8.4.5 Australia
- 8.5 Latin America
- 8.5.1 Brazil
- 8.5.2 Mexico
- 8.6 MEA
- 8.6.1 South Africa
- 8.6.2 Saudi Arabia
- 8.6.3 UAE
Chapter 9 Company Profiles
- 9.1 Aditya Birla Group
- 9.2 Antex
- 9.3 Golden Peacock Group
- 9.4 Kelheim Fibres
- 9.5 Lenzing
- 9.6 Nufarm
- 9.7 Safilens
- 9.8 Sateri Holdings
- 9.9 Shandong Jilin Chemical Fiber
- 9.10 Shandong Ruyi Textile Group
- 9.11 Shanghai Chemical Industries
- 9.12 Shenglong Group
- 9.13 Suominen Oyj
- 9.14 Thai Rayon PCL
- 9.15 Zhejiang Huafu Chemical Fiber

