|
|
市場調査レポート
商品コード
1396547
没食子酸プロピル市場- 用途別、グレードタイプ別、2023年~2032年予測Propyl Gallate Market - By Applications (Food Industry, Cosmetics and Personal Care, Pharmaceuticals, Industrial Applications), By Grade Type (Food Grade, Pharmaceutical Grade, Industrial Grade) & Forecast, 2023 - 2032 |
||||||
|
|
|||||||
カスタマイズ可能
|
|||||||


| 没食子酸プロピル市場- 用途別、グレードタイプ別、2023年~2032年予測 |
|
出版日: 2023年10月05日
発行: Global Market Insights Inc.
ページ情報: 英文 150 Pages
納期: 2~3営業日
|

- 全表示
- 概要
- 図表
- 目次
世界の没食子酸プロピル市場は2023年から2032年にかけてCAGR 6.8%で成長します。
様々な製品の保存性を高め、寿命と品質を保証するその顕著な能力は、需要拡大に寄与しています。消費者の嗜好が進化するにつれて、化粧品業界と医薬品業界は没食子酸プロピルの価値をますます認識し、市場規模にプラスの軌道を形成し、これらの分野で重要な成分として確立しています。
没食子酸プロピル業界は、グレード、用途、地域によって細分化されています。
医薬品グレードのセグメントは、その抗酸化特性と保存効果により、医薬品製剤における没食子酸プロピルの需要が高まっているため、2032年まで大きな利益を獲得するでしょう。製薬業界が持続的な成長と厳しい品質基準を経験するにつれ、医薬品グレードの没食子酸プロピルを含む高品質の原料の必要性が最も重要になります。世界の健康志向の高まりは、没食子酸プロピル市場において医薬品グレードを最前線に押し上げるでしょう。
ゴム、潤滑油、プラスチックの生産を含む様々な工業プロセスにおいて、酸化防止剤として広く使用されているため、2032年までに、工業用途分野の業界規模が没食子酸プロピル業界の注目すべきシェアを占めるでしょう。没食子酸プロピルは、酸化を防ぎ、工業製品の安定性を高める効果があるため、需要が伸びています。産業界が材料の品質と寿命を優先する中、没食子酸プロピル市場を前進させる重要な 促進要因として産業用途分野が浮上するでしょう。
アジア太平洋地域は2023年から2032年にかけて顕著なCAGRを記録すると思われるが、これは同地域が食品や化粧品を含む様々な産業において酸化防止剤の需要が急増していることに起因しています。急速な経済成長、人口の拡大、ライフスタイルの進化が消費の増加に寄与し、市場を前進させる。その他の特典として、アジア太平洋地域の強固な製造部門と没食子酸プロピルの認知度の向上は、没食子酸プロピル市場の展望を形成する上で、アジア太平洋地域の主導的地位をより強固なものにするでしょう。
目次
第1章 調査手法と調査範囲
第2章 エグゼクティブサマリー
第3章 没食子酸プロピル業界洞察
- エコシステム分析
- 業界への影響要因
- 促進要因
- 食品保存における需要の増加
- 医薬品産業の拡大
- 化粧品・パーソナルケア分野の成長
- 業界の潜在的リスク&課題
- 不安定な原料価格
- 健康と安全への懸念
- 促進要因
- 成長の可能性分析
- COVID-19影響分析
- 規制状況
- 米国
- 欧州
- 価格分析、2022年
- 償還シナリオ
- 技術展望
- 今後の市場動向
- GAP分析
- ポーター分析
- PESTEL分析
- ロシア・ウクライナ戦争の影響
第4章 競合情勢
- イントロダクション
- 企業マトリックス分析
- 世界企業シェア分析
- 競合のポジショニングマトリックス
- 戦略ダッシュボード
第5章 没食子酸プロピル市場規模・予測:用途別、2018年~2032年
- 食品産業
- 食用油の酸化防止剤
- 食品保存料
- ベーカリー・菓子類
- 食肉・家禽製品
- 飲料
- その他
- 化粧品・パーソナルケア
- スキンケア製品
- ヘアケア製品
- メイクアップ&カラー化粧品
- トイレタリー
- フレグランス
- その他
- 医薬品
- 医薬品製剤
- 栄養補助食品
- 栄養補助食品
- その他
- 工業用途
- 潤滑油とグリース
- プラスチックとポリマー
- ゴム産業
- 接着剤とシーラント
- その他の産業用途
- 化学製造
- 農薬
- エレクトロニクス産業
- その他
第6章 没食子酸プロピル市場規模・予測:グレード別、2018年~2032年
- 食品グレード
- 医薬品グレード
- 工業グレード
第7章 没食子酸プロピル市場規模・予測:地域別、2018年~2032年
- 主要動向:地域別
- 北米
- 米国
- カナダ
- 欧州
- ドイツ
- 英国
- フランス
- スペイン
- イタリア
- アジア太平洋
- 中国
- インド
- 日本
- オーストラリア
- インドネシア
- マレーシア
- ラテンアメリカ
- ブラジル
- メキシコ
- 中東・アフリカ
- 南アフリカ
- サウジアラビア
- アラブ首長国連邦
第8章 企業プロファイル
- Wufeng Chicheng Biotech Co., Ltd.
- REXLER
- Thermo Fisher Scientific Inc.
- Tokyo Chemical Industry Co., Ltd.(TCI)
- Leshan Sanjiang Bio-Tech Co., Ltd.
- MP Biomedicals
- Haihang Industry Co., Ltd.
- Veeprho Group
- Kemin Industries, Inc.
- Ambeed, Inc.
- Minakem SAS
- Spectrum Chemical Mfg. Corp.
- Loba Chemie Pvt. Ltd.
- Biosynth Carbosynth
- Sigma-Aldrich
Data Tables
- TABLE 1. Market revenue, by application (2022)
- TABLE 2. Market revenue, by grade (2022)
- TABLE 3. Market revenue, by region (2022)
- TABLE 4. Global Propyl Gallate market size, 2018 - 2032, (USD Million)
- TABLE 5. Global Propyl Gallate market size, 2018 - 2032, (Tons)
- TABLE 6. Global Propyl Gallate market size, by region, 2018 - 2032 (USD Million)
- TABLE 7. Global Propyl Gallate market size, by region, 2018 - 2032 (Tons)
- TABLE 8. Global Propyl Gallate market size, by application, 2018 - 2032 (USD Million)
- TABLE 9. Global Propyl Gallate market size, by application, 2018 - 2032 (Tons)
- TABLE 10. Global Propyl Gallate market size, by grade, 2018 - 2032 (USD Million)
- TABLE 11. Global Propyl Gallate market size, by grade, 2018 - 2032 (Tons)
- TABLE 12. Industry impact forces
- TABLE 13. North America Propyl Gallate market size, by country, 2018 - 2032 (USD Million)
- TABLE 14. North America Propyl Gallate market size, by country, 2018 - 2032 (Tons)
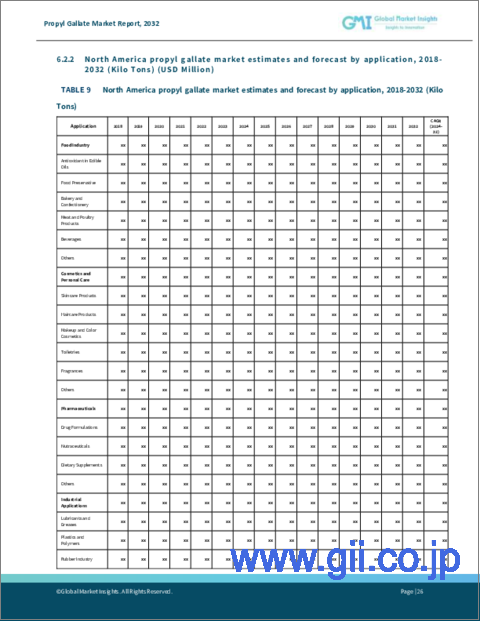
- TABLE 15. North America Propyl Gallate market size, by application, 2018 - 2032 (USD Million)
- TABLE 16. North America Propyl Gallate market size, by application, 2018 - 2032 (Tons)
- TABLE 17. North America Propyl Gallate market size, by grade, 2018 - 2032 (USD Million)
- TABLE 18. North America Propyl Gallate market size, by grade, 2018 - 2032 (Tons)
- TABLE 19. U.S. Propyl Gallate market size, by application, 2018 - 2032 (USD Million)
- TABLE 20. U.S. Propyl Gallate market size, by application, 2018 - 2032 (Tons)
- TABLE 21. U.S. Propyl Gallate market size, by grade, 2018 - 2032 (USD Million)
- TABLE 22. U.S. Propyl Gallate market size, by grade, 2018 - 2032 (Tons)
- TABLE 23. Canada Propyl Gallate market size, by application, 2018 - 2032 (USD Million)
- TABLE 24. Canada Propyl Gallate market size, by application, 2018 - 2032 (Tons)
- TABLE 25. Canada Propyl Gallate market size, by grade, 2018 - 2032 (USD Million)
- TABLE 26. Canada Propyl Gallate market size, by grade, 2018 - 2032 (Tons)
- TABLE 27. Europe Propyl Gallate market size, by country, 2018 - 2032 (USD Million)
- TABLE 28. Europe Propyl Gallate market size, by country, 2018 - 2032 (Tons)
- TABLE 29. Europe Propyl Gallate market size, by application, 2018 - 2032 (USD Million)
- TABLE 30. Europe Propyl Gallate market size, by application, 2018 - 2032 (Tons)
- TABLE 31. Europe Propyl Gallate market size, by grade, 2018 - 2032 (USD Million)
- TABLE 32. Europe Propyl Gallate market size, by grade, 2018 - 2032 (Tons)
- TABLE 33. Germany Propyl Gallate market size, by application, 2018 - 2032 (USD Million)
- TABLE 34. Germany Propyl Gallate market size, by application, 2018 - 2032 (Tons)
- TABLE 35. Germany Propyl Gallate market size, by grade, 2018 - 2032 (USD Million)
- TABLE 36. Germany Propyl Gallate market size, by grade, 2018 - 2032 (Tons)
- TABLE 37. UK Propyl Gallate market size, by application, 2018 - 2032 (USD Million)
- TABLE 38. UK Propyl Gallate market size, by application, 2018 - 2032 (Tons)
- TABLE 39. UK Propyl Gallate market size, by grade, 2018 - 2032 (USD Million)
- TABLE 40. UK Propyl Gallate market size, by grade, 2018 - 2032 (Tons)
- TABLE 41. France Propyl Gallate market size, by application, 2018 - 2032 (USD Million)
- TABLE 42. France Propyl Gallate market size, by application, 2018 - 2032 (Tons)
- TABLE 43. France Propyl Gallate market size, by grade, 2018 - 2032 (USD Million)
- TABLE 44. France Propyl Gallate market size, by grade, 2018 - 2032 (Tons)
- TABLE 45. Spain Propyl Gallate market size, by application, 2018 - 2032 (USD Million)
- TABLE 46. Spain Propyl Gallate market size, by application, 2018 - 2032 (Tons)
- TABLE 47. Spain Propyl Gallate market size, by grade, 2018 - 2032 (USD Million)
- TABLE 48. Spain Propyl Gallate market size, by grade, 2018 - 2032 (Tons)
- TABLE 49. Italy Propyl Gallate market size, by application, 2018 - 2032 (USD Million)
- TABLE 50. Italy Propyl Gallate market size, by application, 2018 - 2032 (Tons)
- TABLE 51. Italy Propyl Gallate market size, by grade, 2018 - 2032 (USD Million)
- TABLE 52. Italy Propyl Gallate market size, by grade, 2018 - 2032 (Tons)
- TABLE 53. Asia Pacific Propyl Gallate market size, by country, 2018 - 2032 (USD Million)
- TABLE 54. Asia Pacific Propyl Gallate market size, by country, 2018 - 2032 (Tons)
- TABLE 55. Asia Pacific Propyl Gallate market size, by application, 2018 - 2032 (USD Million)
- TABLE 56. Asia Pacific Propyl Gallate market size, by application, 2018 - 2032 (Tons)
- TABLE 57. Asia Pacific Propyl Gallate market size, by grade, 2018 - 2032 (USD Million)
- TABLE 58. Asia Pacific Propyl Gallate market size, by grade, 2018 - 2032 (Tons)
- TABLE 59. China Propyl Gallate market size, by application, 2018 - 2032 (USD Million)
- TABLE 60. China Propyl Gallate market size, by application, 2018 - 2032 (Tons)
- TABLE 61. China Propyl Gallate market size, by grade, 2018 - 2032 (USD Million)
- TABLE 62. China Propyl Gallate market size, by grade, 2018 - 2032 (Tons)
- TABLE 63. Japan Propyl Gallate market size, by application, 2018 - 2032 (USD Million)
- TABLE 64. Japan Propyl Gallate market size, by application, 2018 - 2032 (Tons)
- TABLE 65. Japan Propyl Gallate market size, by grade, 2018 - 2032 (USD Million)
- TABLE 66. Japan Propyl Gallate market size, by grade, 2018 - 2032 (Tons)
- TABLE 67. India Propyl Gallate market size, by application, 2018 - 2032 (USD Million)
- TABLE 68. India Propyl Gallate market size, by application, 2018 - 2032 (Tons)
- TABLE 69. India Propyl Gallate market size, by grade, 2018 - 2032 (USD Million)
- TABLE 70. India Propyl Gallate market size, by grade, 2018 - 2032 (Tons)
- TABLE 71. Australia Propyl Gallate market size, by application, 2018 - 2032 (USD Million)
- TABLE 72. Australia Propyl Gallate market size, by application, 2018 - 2032 (Tons)
- TABLE 73. Australia Propyl Gallate market size, by grade, 2018 - 2032 (USD Million)
- TABLE 74. Australia Propyl Gallate market size, by grade, 2018 - 2032 (Tons)
- TABLE 75. Indonesia Propyl Gallate market size, by application, 2018 - 2032 (USD Million)
- TABLE 76. Indonesia Propyl Gallate market size, by application, 2018 - 2032 (Tons)
- TABLE 77. Indonesia Propyl Gallate market size, by grade, 2018 - 2032 (USD Million)
- TABLE 78. Indonesia Propyl Gallate market size, by grade, 2018 - 2032 (Tons)
- TABLE 79. Malaysia Propyl Gallate market size, by application, 2018 - 2032 (USD Million)
- TABLE 80. Malaysia Propyl Gallate market size, by application, 2018 - 2032 (Tons)
- TABLE 81. Malaysia Propyl Gallate market size, by grade, 2018 - 2032 (USD Million)
- TABLE 82. Malaysia Propyl Gallate market size, by grade, 2018 - 2032 (Tons)
- TABLE 83. Latin America Propyl Gallate market size, by country, 2018 - 2032 (USD Million)
- TABLE 84. Latin America Propyl Gallate market size, by country, 2018 - 2032 (Tons)
- TABLE 85. Latin America Propyl Gallate market size, by application, 2018 - 2032 (USD Million)
- TABLE 86. Latin America Propyl Gallate market size, by application, 2018 - 2032 (Tons)
- TABLE 87. Latin America Propyl Gallate market size, by grade, 2018 - 2032 (USD Million)
- TABLE 88. Latin America Propyl Gallate market size, by grade, 2018 - 2032 (Tons)
- TABLE 89. Brazil Propyl Gallate market size, by application, 2018 - 2032 (USD Million)
- TABLE 90. Brazil Propyl Gallate market size, by application, 2018 - 2032 (Tons)
- TABLE 91. Brazil Propyl Gallate market size, by grade, 2018 - 2032 (USD Million)
- TABLE 92. Brazil Propyl Gallate market size, by grade, 2018 - 2032 (Tons)
- TABLE 93. Mexico Propyl Gallate market size, by application, 2018 - 2032 (USD Million)
- TABLE 94. Mexico Propyl Gallate market size, by application, 2018 - 2032 (Tons)
- TABLE 95. Mexico Propyl Gallate market size, by grade, 2018 - 2032 (USD Million)
- TABLE 96. Mexico Propyl Gallate market size, by grade, 2018 - 2032 (Tons)
- TABLE 97. MEA Propyl Gallate market size, by country, 2018 - 2032 (USD Million)
- TABLE 98. MEA Propyl Gallate market size, by country, 2018 - 2032 (Tons)
- TABLE 99. MEA Propyl Gallate market size, by application, 2018 - 2032 (USD Million)
- TABLE 100. MEA Propyl Gallate market size, by application, 2018 - 2032 (Tons)
- TABLE 101. MEA Propyl Gallate market size, by grade, 2018 - 2032 (USD Million)
- TABLE 102. MEA Propyl Gallate market size, by grade, 2018 - 2032 (Tons)
- TABLE 103. South Africa Propyl Gallate market size, by application, 2018 - 2032 (USD Million)
- TABLE 104. South Africa Propyl Gallate market size, by application, 2018 - 2032 (Tons)
- TABLE 105. South Africa Propyl Gallate market size, by grade, 2018 - 2032 (USD Million)
- TABLE 106. South Africa Propyl Gallate market size, by grade, 2018 - 2032 (Tons)
- TABLE 107. Saudi Arabia Propyl Gallate market size, by application, 2018 - 2032 (USD Million)
- TABLE 108. Saudi Arabia Propyl Gallate market size, by application, 2018 - 2032 (Tons)
- TABLE 109. Saudi Arabia Propyl Gallate market size, by grade, 2018 - 2032 (USD Million)
- TABLE 110. Saudi Arabia Propyl Gallate market size, by grade, 2018 - 2032 (Tons)
- TABLE 111. UAE Propyl Gallate market size, by application, 2018 - 2032 (USD Million)
- TABLE 112. UAE Propyl Gallate market size, by application, 2018 - 2032 (Tons)
- TABLE 113. UAE Propyl Gallate market size, by grade, 2018 - 2032 (USD Million)
- TABLE 114. UAE Propyl Gallate market size, by grade, 2018 - 2032 (Tons)
Charts & Figures
- FIG. 1 Industry segmentation
- FIG. 2 Market estimation and forecast methodology
- FIG. 3 Breakdown of primary participants
- FIG. 4 Propyl Gallate industry, 360o synopsis, 2018 - 2032
- FIG. 5 Industry landscape, 2018-2032 (USD Million)
- FIG. 6 Growth potential analysis
- FIG. 7 Porter's analysis
- FIG. 8 PESTEL analysis
- FIG. 9 Company matrix analysis, 2022
- FIG. 10 Strategy dashboard, 2022
Global Propyl Gallate Market will grow at a 6.8% CAGR from 2023 to 2032, driven by its expanding applications in cosmetics and pharmaceuticals. Its remarkable ability to enhance shelf life in various products, ensuring longevity and quality, contributes to increased demand. As consumer preferences evolve, the cosmetic and pharmaceutical industries increasingly recognize the value of propyl gallate, shaping a positive trajectory for its market size and establishing it as a crucial component in these sectors.
The propyl gallate industry is fragmented based on the type of grade, application, and region.
The pharmaceutical grade segment will garner significant gains through 2032 due to the escalating demand for propyl gallate in pharmaceutical formulations owing to its antioxidant properties and preservation benefits. As the pharmaceutical industry experiences sustained growth and stringent quality standards, the need for high-quality ingredients, including pharmaceutical-grade propyl gallate, becomes paramount. The increasing emphasis on health and wellness globally will further propel the pharmaceutical-grade segment to the forefront of the propyl gallate market.
The industry size from the industrial application segment will capture a notable propyl gallate industry share by 2032, fueled by the compound's widespread use as an antioxidant in various industrial processes, including the production of rubber, lubricants, and plastics. Propyl gallate's effectiveness in preventing oxidation and enhancing the stability of industrial products contributes to its growing demand. As industries prioritize the quality and longevity of their materials, the industrial application segment will emerge as a key driver, steering the propyl gallate market forward.
The Asia-Pacific will register a remarkable CAGR from 2023 to 2032, attributed to the region's burgeoning demand for antioxidants in various industries, including food and cosmetics. Rapid economic growth, expanding populations, and evolving lifestyles contribute to increased consumption, propelling the market forward. Additionally, the region's robust manufacturing sector and growing awareness of the benefits of propyl gallate will further solidify Asia-Pacific's leading position in shaping the propyl gallate market outlook.
Table of Contents
Chapter 1 Methodology & Scope
- 1.1 Industry coverage
- 1.2 Market scope & definition
- 1.3 Base estimates & calculations
- 1.3.1 Data collection
- 1.4 Forecast parameters
- 1.5 COVID-19 impact analysis at global level
- 1.6 Data validation
- 1.7 Data Sources
- 1.7.1 Primary
- 1.7.2 Secondary
- 1.7.2.1 Paid sources
- 1.7.2.2 Unpaid sources
Chapter 2 Executive Summary
- 2.1 Propyl Gallate industry 360 degree synopsis, 2018 - 2032
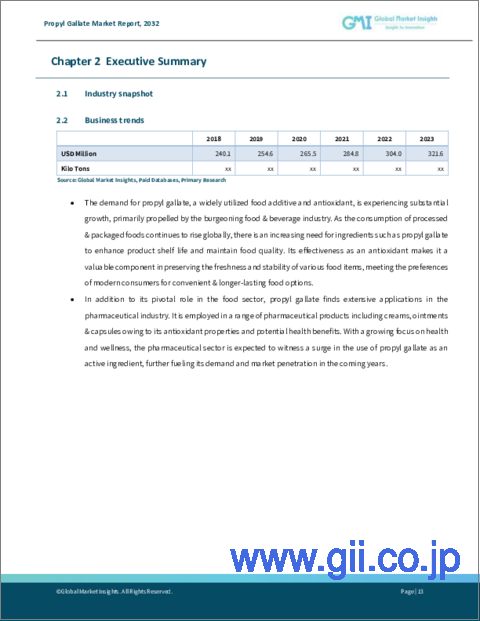
- 2.2 Business trends
- 2.3 Application trends
- 2.4 Grade trends
- 2.5 Regional trends
Chapter 3 Propyl Gallate Industry Insights
- 3.1 Industry ecosystem analysis
- 3.2 Industry impact forces
- 3.2.1 Growth drivers
- 3.2.1.1 Increasing demand in food preservation
- 3.2.1.2 Expanding pharmaceutical industry
- 3.2.1.3 Rising cosmetics and personal care sector
- 3.2.2 Industry pitfalls & challenges
- 3.2.2.1 Volatile raw material prices
- 3.2.2.2 Health and Safety Concerns
- 3.2.1 Growth drivers
- 3.3 Growth potential analysis
- 3.3.1 By application type
- 3.3.2 By grade type
- 3.4 COVID- 19 impact analysis
- 3.5 Regulatory landscape
- 3.5.1 U.S.
- 3.5.2 Europe
- 3.6 Pricing analysis, 2022
- 3.7 Reimbursement scenario
- 3.8 Technology landscape
- 3.9 Future market trends
- 3.10 GAP analysis
- 3.11 Porter's analysis
- 3.12 PESTEL analysis
- 3.13 Impact of Russia Ukraine war
Chapter 4 Competitive Landscape, 2022
- 4.1 Introduction
- 4.2 Company matrix analysis, 2022
- 4.3 Global company market share analysis, 2022
- 4.4 Competitive positioning matrix
- 4.5 Strategy dashboard
Chapter 5 Propyl Gallate Market Size and Forecast, By Application 2018 - 2032
- 5.1 Food Industry
- 5.1.1 Antioxidant in Edible Oils
- 5.1.2 Food Preservative
- 5.1.3 Bakery and Confectionery
- 5.1.4 Meat and Poultry Products
- 5.1.5 Beverages
- 5.1.6 Others
- 5.2 Cosmetics and Personal Care
- 5.2.1 Skincare Products
- 5.2.2 Haircare Products
- 5.2.3 Makeup and Color Cosmetics
- 5.2.4 Toiletries
- 5.2.5 Fragrances
- 5.2.6 Others
- 5.3 Pharmaceuticals
- 5.3.1 Drug Formulations
- 5.3.2 Nutraceuticals
- 5.3.3 Dietary Supplements
- 5.3.4 Others
- 5.4 Industrial Applications
- 5.4.1 Lubricants and Greases
- 5.4.2 Plastics and Polymers
- 5.4.3 Rubber Industry
- 5.4.4 Adhesives and Sealants
- 5.4.5 Other Industrial Uses
- 5.5 Chemical Manufacturing
- 5.5.1 Agrochemicals
- 5.5.2 Electronics Industry
- 5.5.3 Others
Chapter 6 Propyl Gallate Market Size and Forecast, By Grade 2018 - 2032
- 6.1 Food Grade
- 6.2 Pharmaceutical Grade
- 6.3 Industrial Grade
Chapter 7 Propyl Gallate Market Size and Forecast, By Region 2018 - 2032
- 7.1 Key trends, by region
- 7.2 North America
- 7.2.1 U.S.
- 7.2.2 Canada
- 7.3 Europe
- 7.3.1 Germany
- 7.3.2 UK
- 7.3.3 France
- 7.3.4 Spain
- 7.3.5 Italy
- 7.4 Asia Pacific
- 7.4.1 China
- 7.4.2 India
- 7.4.3 Japan
- 7.4.4 Australia
- 7.4.5 Indonesia
- 7.4.6 Malaysia
- 7.5 Latin America
- 7.5.1 Brazil
- 7.5.2 Mexico
- 7.6 MEA
- 7.6.1 South Africa
- 7.6.2 Saudi Arabia
- 7.6.3 UAE
Chapter 8 Company Profiles
- 8.1 Wufeng Chicheng Biotech Co., Ltd.
- 8.2 REXLER
- 8.3 Thermo Fisher Scientific Inc.
- 8.4 Tokyo Chemical Industry Co., Ltd. (TCI)
- 8.5 Leshan Sanjiang Bio-Tech Co., Ltd.
- 8.6 MP Biomedicals
- 8.7 Haihang Industry Co., Ltd.
- 8.8 Veeprho Group
- 8.9 Kemin Industries, Inc.
- 8.10 Ambeed, Inc.
- 8.11 Minakem SAS
- 8.12 Spectrum Chemical Mfg. Corp.
- 8.13 Loba Chemie Pvt. Ltd.
- 8.14 Biosynth Carbosynth
- 8.15 Sigma-Aldrich
