
|
市場調査レポート
商品コード
1876816
クリーンラベル原料市場の機会、成長要因、業界動向分析、および2025年から2034年までの予測Clean Label Ingredients Market Opportunity, Growth Drivers, Industry Trend Analysis, and Forecast 2025 - 2034 |
||||||
カスタマイズ可能
|
|||||||
| クリーンラベル原料市場の機会、成長要因、業界動向分析、および2025年から2034年までの予測 |
|
出版日: 2025年11月03日
発行: Global Market Insights Inc.
ページ情報: 英文 210 Pages
納期: 2~3営業日
|

概要
世界のクリーンラベル原料市場は、2024年に282億米ドルと評価され、2034年までにCAGR12.2%で成長し、897億米ドルに達すると予測されております。
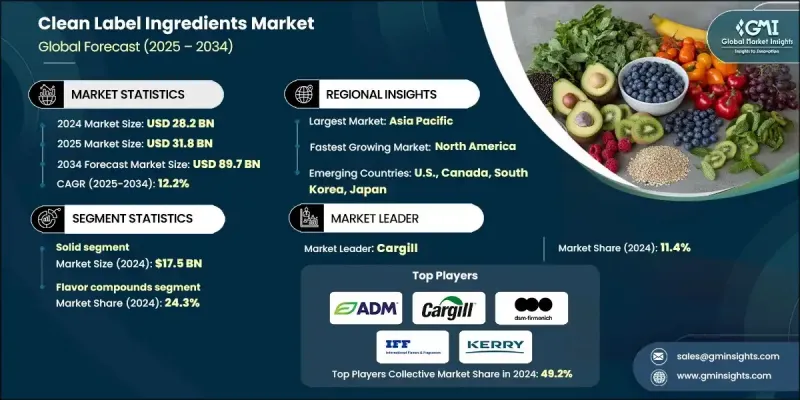
市場の急速な成長は、透明性、天然由来、最小限の加工を施した食品に対する消費者の強い需要に起因しています。クリーンラベル原料とは、人工添加物、着色料、保存料、合成化学物質を含まない、天然でシンプルな原料を指します。安全性と健康を重視する健康志向の消費者を中心に、クリーンでトレーサビリティのある食品源への嗜好が重要な購買要因となっています。世界の健康志向の動向と、食品添加物や表示に関する政府規制の強化が相まって、合成原料から天然由来の代替原料への移行が促進されています。メーカー各社は、変化する消費者の期待と持続可能性の目標に沿うため、有機栽培、植物由来、非遺伝子組み換え原料を用いた製品の再設計を加速しています。さらに、天然抽出や発酵技術の進歩により、風味、機能性、保存性を損なうことなく、よりクリーンで安定した原料プロファイルの実現が可能となっています。こうした複合的なトレンド、健康意識の高まり、規制の進化、天然加工技術の革新が相まって、世界のクリーンラベル原料市場は再構築されつつあります。
| 市場範囲 | |
|---|---|
| 開始年 | 2024年 |
| 予測期間 | 2025-2034 |
| 開始時価値 | 282億米ドル |
| 予測金額 | 897億米ドル |
| CAGR | 12.2% |
固形形態セグメントは2024年に175億米ドルの売上高を生み出しました。粉末タンパク質、顆粒状保存料、結晶性甘味料、脱水風味化合物などの固形原料は、その安定性、取り扱いやすさ、食品製造プロセス全体での適応性から主流となっています。これらの形態は、製造業者に長期保存性、正確な投与量管理、大規模食品生産システムへのシームレスな統合を提供します。ベーカリー、菓子類、加工食品カテゴリーなど主要用途分野では、固形原料が一貫性と風味の維持に重要な役割を果たすため、需要は引き続き高い水準にあります。
2024年時点で、香料化合物が24.3%のシェアを占めました。植物、果実、野菜、ハーブ由来の天然香料は、人工添加物を使用せずに複雑で本物の味を実現しようとする飲食品の配合において不可欠なものとなりつつあります。消費者が天然香料を品質、安全性、感覚的満足と結びつける傾向が強まる中、精油、発酵由来化合物、植物性抽出物の使用が急速に拡大しています。
北米のクリーンラベル原料市場は、最小限の加工を施した天然で透明性の高い原料を求める消費者の嗜好に後押しされ、2025年から2034年にかけてCAGR12.4%を記録すると予測されています。同地域の市場成長は、健康・ウェルネス・持続可能性を重視する主要ブランドにおけるクリーンラベル配合の採用拡大によって支えられています。天然保存技術、抽出技術、配合技術における技術革新により、製品の性能向上と純度維持が両立されています。さらに、企業は持続可能な調達を優先し、再生可能原料への投資を拡大するとともに、有機原料の品揃えを拡充することで、消費者の期待と規制基準への対応を図っています。
グローバルなクリーンラベル原料市場で事業を展開する主要企業には、A&B Ingredients、カーギル、DSM-Firmenich、Limagrain Ingredients、ケリーグループ、ADM、イングレディオン、コービオン、International Flavors &Fragrances Inc.(IFF)、ブリサン・グループ、テート・アンド・ライル、ノボザイムズなどが挙げられます。主要市場プレイヤーは、クリーンラベル原料市場における地位を強化するため、様々な戦略を採用しております。これには、食品メーカーとの戦略的提携、地域生産施設の拡張、製品ポートフォリオ拡大のためのニッチな天然原料企業の買収などが含まれます。研究開発への継続的な投資により、企業は進化する消費者動向に対応した革新的で持続可能なクリーンラベル製剤を導入することが可能となっております。
よくあるご質問
目次
第1章 調査手法と範囲
第2章 エグゼクティブサマリー
第3章 業界考察
- エコシステム分析
- サプライヤーの情勢
- 利益率
- 各段階における付加価値
- バリューチェーンに影響を与える要因
- ディスラプション
- 業界への影響要因
- 促進要因
- 透明性と天然成分に対する消費者需要の高まり
- クリーンラベル化と合成添加物削減に向けた規制の推進
- 健康・ウェルネスの動向が牽引するプレミアム製品需要
- 業界の潜在的リスク&課題
- 天然原料と合成原料のコスト比較における天然原料の高コスト性
- 製品機能維持における技術的課題
- 市場機会
- 植物由来および代替タンパク質における新たな応用分野
- 先進的加工技術の採用
- 促進要因
- 成長可能性分析
- 規制情勢
- 北米
- 欧州
- アジア太平洋地域
- ラテンアメリカ
- 中東・アフリカ
- ポーター分析
- PESTEL分析
- 技術とイノベーションの状況
- 現在の技術動向
- 新興技術
- 価格動向
- 地域別
- 製品別
- 将来の市場動向
- 特許状況
- 貿易統計(HSコード)(注:貿易統計は主要国のみ提供されます)
- 主要輸入国
- 主要輸出国
- 持続可能性と環境面
- 持続可能な取り組み
- 廃棄物削減戦略
- 生産におけるエネルギー効率
- 環境に配慮した取り組み
- カーボンフットプリントへの配慮
第4章 競合情勢
- イントロダクション
- 企業の市場シェア分析
- 地域別
- 北米
- 欧州
- アジア太平洋地域
- ラテンアメリカ
- 中東・アフリカ地域
- 地域別
- 企業マトリクス分析
- 主要市場企業の競合分析
- 競合ポジショニングマトリックス
- 主な発展
- 合併・買収
- 提携・協業
- 新製品の発売
- 事業拡大計画
第5章 市場推計・予測:形態別、2021-2034
- 主要動向
- 固形
- 粉末・顆粒
- 結晶状・フレーク状
- 錠剤および圧縮剤
- 液体
- 溶液・シロップ
- エマルジョン及び懸濁液
- 濃縮液
- 半固体
- ペースト及び濃縮物
- ゲル及び粘性溶液
- ワックス及び固体分散体
第6章 市場推計・予測:カテゴリー別、2021-2034
- 主要動向
- 保存料・抗菌剤
- 有機酸(クエン酸、酢酸、乳酸)
- 精油化合物
- 植物抽出物由来の抗酸化剤
- 塩及びミネラル系保存料
- 着色料・顔料
- アントシアニン及びベタレイン
- カロテノイド及びキサントフィル
- クロロフィル誘導体
- 鉱物・粘土系着色料
- フレーバー化合物
- 精油およびオレオレジン
- 天然香料エキス
- 植物由来の芳香剤
- 味覚調整剤・増強剤
- 甘味料
- 高甘味度甘味料(ステビア、ロハン)
- 糖アルコール(エリスリトール、キシリトール)
- 希少糖類(アルロース、タガトース)
- 天然糖代替品
- タンパク質・アミノ酸
- 植物性タンパク質濃縮物
- タンパク質分離物・加水分解物
- 必須アミノ酸ブレンド
- 生物活性ペプチド
- 食感改良剤
- 増粘剤
- ゲル化剤
- 安定化システム
- 固結防止剤
- その他
第7章 市場推計・予測:最終用途産業別、2021-2034
- 主要動向
- 飲料業界
- ノンアルコール飲料
- アルコール飲料
- 機能性飲料・スポーツドリンク
- 乳製品ベースの飲料
- 食品製造
- ベーカリー・シリアル製品
- 菓子類・スイーツ
- 加工食品・レトルト食品
- スナック菓子・コンビニエンス製品
- 乳製品・代替品産業
- 伝統的な乳製品
- 植物由来の乳製品代替品
- 発酵乳製品
- 冷凍乳製品デザート
- 肉・タンパク質産業
- 加工肉製品
- 植物由来の肉代替品
- 水産物・海洋製品
- プロテインサプリメント・バー
- 専門栄養
- 乳幼児向け栄養食品
- 臨床・医療栄養
- スポーツ・パフォーマンス栄養
- 高齢者向け栄養
- 外食産業・ケータリング
- レストラン・ファストフードチェーン
- 施設向けケータリング
- 食品原料供給
- その他
第8章 市場推計・予測:地域別、2021-2034
- 主要動向
- 北米
- 米国
- カナダ
- 欧州
- ドイツ
- 英国
- フランス
- スペイン
- イタリア
- その他欧州地域
- アジア太平洋地域
- 中国
- インド
- 日本
- オーストラリア
- 韓国
- その他アジア太平洋地域
- ラテンアメリカ
- ブラジル
- メキシコ
- アルゼンチン
- その他ラテンアメリカ地域
- 中東・アフリカ
- サウジアラビア
- 南アフリカ
- アラブ首長国連邦
- その他中東・アフリカ地域
第9章 企業プロファイル
- A&B Ingredients
- ADM
- Brisan Group
- Cargill
- Corbion
- DSM-Firmenich
- Ingredion
- International Flavors &Fragrances Inc.(IFF)
- Kerry Group
- Limagrain Ingredients
- Novozymes
- Tate &Lyle

