
|
市場調査レポート
商品コード
1667180
DCコンタクタ市場の機会、成長促進要因、産業動向分析、2025年~2034年の予測DC Contactor Market Opportunity, Growth Drivers, Industry Trend Analysis, and Forecast 2025 - 2034 |
||||||
カスタマイズ可能
|
|||||||
| DCコンタクタ市場の機会、成長促進要因、産業動向分析、2025年~2034年の予測 |
|
出版日: 2024年12月23日
発行: Global Market Insights Inc.
ページ情報: 英文 120 Pages
納期: 2~3営業日
|

全表示
- 概要
- 目次
DCコンタクタの世界市場は、2024年に5億米ドルと評価され、2025年から2034年のCAGRは7.2%と予測され、力強い成長が見込まれています。
この急成長の背景には、再生可能エネルギーシステムの統合の増加、電気自動車(EV)市場の急拡大、産業オートメーション技術の進歩があります。
DCコンタクタは、高電圧DC回路を管理するために不可欠なコンポーネントとして機能し、さまざまな用途で最適な電力制御、信頼性、安全性の向上を保証します。持続可能性への関心の高まりと技術革新が相まって、高電流・高電圧に対応できる高度なDCコンタクターへの需要が高まっています。さらに、太陽光発電や風力発電プロジェクトにおけるエネルギー貯蔵ソリューションの広範な導入は、産業界がより環境に優しいエネルギー源へと移行し、高度な電力管理システムを必要とするため、市場に拍車をかけています。
| 市場範囲 | |
|---|---|
| 開始年 | 2024 |
| 予測年 | 2025-2034 |
| 開始金額 | 5億米ドル |
| 予測金額 | 10億米ドル |
| CAGR | 7.2% |
市場の成長軌道は、産業運営の自動化と効率化への幅広いシフトを反映しています。正確な制御を実現し、運用の信頼性を向上させるインテリジェントシステムに対する需要の増加は、現代の産業用セットアップにおけるDCコンタクターの重要性を強調しています。汎用性の高さで知られるこのデバイスは、さまざまな直流電気負荷の管理に役立っており、効率的な回路制御を必要とするシステムの要となっています。産業界では、安全性、操作精度、エネルギー効率を優先する傾向が強まっているため、DCコンタクターの採用は今後数年で急増すると予想されます。
汎用DCコンタクタ分野は、産業オートメーションの急速な進展と、安全性と運用効率への重点の強化により、2034年までに4億米ドルに達すると予測されます。これらのコンタクターは、自動化されたプロセスにおいて重要であり、電気負荷を正確に制御し、システム全体の性能を最適化します。多様な用途に適応できるため、特に信頼性の高いオン/オフ回路管理を必要とする機械や制御システムにおいて、産業界全体から選ばれ続けています。
電気自動車(EV)市場は、2034年までCAGR 8%で推移すると予想されています。DCコンタクタは、EVにおいて極めて重要な役割を果たし、安全かつ効率的な電力管理を実現します。回路の開閉を正確に制御することで、この部品は重要なEVシステムの信頼性の高い動作を保証し、市場の急速な進化と消費者需要の増加に対応しています。
米国のDCコンタクター市場は、2034年までに1億2,000万米ドルを創出すると予測されており、これはEVインフラへの多額の投資と高電圧バッテリー技術の進歩に支えられています。再生可能エネルギープロジェクト、特に太陽光発電と風力発電の台頭により、エネルギー貯蔵システムの高電圧回路を管理する効率的なDCコンタクターのニーズがさらに高まっています。さらに、自動化、ロボット工学、スマートシステムの導入が進む産業分野では、デジタル監視や予知保全などの拡張機能を備えたDCコンタクターの需要が高まっています。これらの技術革新は、持続可能性と運用効率の重視の高まりと合致しており、DCコンタクターが市場を牽引する役割を確実なものにしています。
目次
第1章 調査手法と調査範囲
- 市場範囲と定義
- 市場推計・予測パラメータ
- 予測計算
- データソース
- 1次データ
- 2次データ
- 有料
- 公的
第2章 エグゼクティブサマリー
第3章 業界洞察
- エコシステム分析
- 規制状況
- 業界への影響要因
- 促進要因
- 業界の潜在的リスク&課題
- 成長ポテンシャル分析
- ポーター分析
- 供給企業の交渉力
- 買い手の交渉力
- 新規参入業者の脅威
- 代替品の脅威
- PESTEL分析
第4章 競合情勢
- イントロダクション
- 戦略的展望
- イノベーションと持続可能性の展望
第5章 市場規模・予測:製品別、2021年~2034年
- 主要動向
- 汎用DCコンタクタ
- 確定用途DCコンタクタ
- 大電流コンタクタ
- その他
第6章 市場規模・予測:最終用途別、2021年~2034年
- 主要動向
- 電気自動車
- 航空宇宙・防衛
- 産業機械
- 再生可能エネルギー
- その他
第7章 市場規模・予測:地域別、2021年~2034年
- 主要動向
- 北米
- 米国
- カナダ
- 欧州
- ドイツ
- フランス
- 英国
- スペイン
- イタリア
- アジア太平洋
- 中国
- インド
- 日本
- 韓国
- オーストラリア
- 中東・アフリカ
- サウジアラビア
- アラブ首長国連邦
- 南アフリカ
- ラテンアメリカ
- ブラジル
- アルゼンチン
第8章 企業プロファイル
- ABB
- Carlo Gavazzi
- Eaton
- Fuji Electric
- Geya
- Lovato Electric
- LS Electric
- L&T
- Mitsubishi Electric
- Rockwell Automation
- Schaltbau
- Schmersal
- Schneider Electric
- Sensata Technologies
- Siemens
- TE Connectivity
- Toshiba
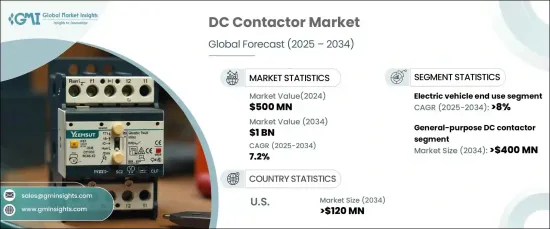
The Global DC Contactor Market, valued at USD 500 million in 2024, is poised for robust growth, with projections indicating a CAGR of 7.2% between 2025 and 2034. This surge is driven by the increasing integration of renewable energy systems, the rapid expansion of the electric vehicle (EV) market, and advancements in industrial automation technologies.
DC contactors serve as indispensable components for managing high-voltage DC circuits, ensuring optimal power control, reliability, and enhanced safety across a spectrum of applications. The heightened focus on sustainability, coupled with technological innovations, has amplified the demand for advanced DC contactors capable of handling elevated currents and voltages. Moreover, the widespread deployment of energy storage solutions in solar and wind power projects is fueling the market as industries transition toward greener energy sources and require sophisticated power management systems.
| Market Scope | |
|---|---|
| Start Year | 2024 |
| Forecast Year | 2025-2034 |
| Start Value | $500 Million |
| Forecast Value | $1 Billion |
| CAGR | 7.2% |
The market's growth trajectory reflects a broader shift toward automation and efficiency in industrial operations. Increasing demand for intelligent systems that deliver precise control and improve operational reliability underscores the significance of DC contactors in modern industrial setups. These devices, known for their versatility, are instrumental in managing various DC electrical loads, making them a cornerstone in systems requiring efficient circuit control. As industries increasingly prioritize safety, operational accuracy, and energy efficiency, the adoption of DC contactors is expected to surge in the coming years.
The general-purpose DC contactor segment is projected to reach USD 400 million by 2034, bolstered by rapid advancements in industrial automation and an intensified focus on safety and operational efficiency. These contactors are critical in automated processes, delivering precise control over electrical loads and optimizing overall system performance. Their adaptability to diverse applications ensures they remain a preferred choice across industries, particularly in machinery and control systems requiring reliable on/off circuit management.
The electric vehicle (EV) market is anticipated to witness a CAGR of 8% through 2034, fueled by the growing adoption of EVs driven by environmental awareness and supportive government incentives. DC contactors play a pivotal role in EVs, ensuring safe and efficient electrical power management. By precisely controlling the opening and closing of circuits, these components guarantee reliable operation of critical EV systems, aligning with the market's rapid evolution and increased consumer demand.
The United States DC contactor market is forecast to generate USD 120 million by 2034, supported by substantial investments in EV infrastructure and advancements in high-voltage battery technologies. The rise of renewable energy projects, particularly solar and wind, has further increased the need for efficient DC contactors to manage high-voltage circuits in energy storage systems. Additionally, the industrial sector's embrace of automation, robotics, and smart systems underscores the demand for DC contactors equipped with enhanced features such as digital monitoring and predictive maintenance. These innovations align with the growing emphasis on sustainability and operational efficiency, cementing the role of DC contactors in driving the market forward.
Table of Contents
Chapter 1 Methodology & Scope
- 1.1 Market scope & definitions
- 1.2 Market estimates & forecast parameters
- 1.3 Forecast calculation
- 1.4 Data sources
- 1.4.1 Primary
- 1.4.2 Secondary
- 1.4.2.1 Paid
- 1.4.2.2 Public
Chapter 2 Executive Summary
- 2.1 Industry synopsis, 2021 - 2034
Chapter 3 Industry Insights
- 3.1 Industry ecosystem analysis
- 3.2 Regulatory landscape
- 3.3 Industry impact forces
- 3.3.1 Growth drivers
- 3.3.2 Industry pitfalls & challenges
- 3.4 Growth potential analysis
- 3.5 Porter's analysis
- 3.5.1 Bargaining power of suppliers
- 3.5.2 Bargaining power of buyers
- 3.5.3 Threat of new entrants
- 3.5.4 Threat of substitutes
- 3.6 PESTEL analysis
Chapter 4 Competitive Landscape, 2024
- 4.1 Introduction
- 4.2 Strategic outlook
- 4.3 Innovation & sustainability landscape
Chapter 5 Market Size and Forecast, By Product, 2021 – 2034 (USD Billion)
- 5.1 Key trends
- 5.2 General purpose DC contactors
- 5.3 Definite purpose DC contactors
- 5.4 High current contactors
- 5.5 Others
Chapter 6 Market Size and Forecast, By End Use, 2021 – 2034 (USD Billion)
- 6.1 Key trends
- 6.2 Electric vehicles
- 6.3 Aerospace & defense
- 6.4 Industrial machinery
- 6.5 Renewable energy
- 6.6 Others
Chapter 7 Market Size and Forecast, By Region, 2021 – 2034 (USD Billion)
- 7.1 Key trends
- 7.2 North America
- 7.2.1 U.S.
- 7.2.2 Canada
- 7.3 Europe
- 7.3.1 Germany
- 7.3.2 France
- 7.3.3 UK
- 7.3.4 Spain
- 7.3.5 Italy
- 7.4 Asia Pacific
- 7.4.1 China
- 7.4.2 India
- 7.4.3 Japan
- 7.4.4 South Korea
- 7.4.5 Australia
- 7.5 Middle East & Africa
- 7.5.1 Saudi Arabia
- 7.5.2 UAE
- 7.5.3 South Africa
- 7.6 Latin America
- 7.6.1 Brazil
- 7.6.2 Argentina
Chapter 8 Company Profiles
- 8.1 ABB
- 8.2 Carlo Gavazzi
- 8.3 Eaton
- 8.4 Fuji Electric
- 8.5 Geya
- 8.6 Lovato Electric
- 8.7 LS Electric
- 8.8 L&T
- 8.9 Mitsubishi Electric
- 8.10 Rockwell Automation
- 8.11 Schaltbau
- 8.12 Schmersal
- 8.13 Schneider Electric
- 8.14 Sensata Technologies
- 8.15 Siemens
- 8.16 TE Connectivity
- 8.17 Toshiba

