
|
市場調査レポート
商品コード
1716649
AIaaS(AI as a Service)市場の機会、成長促進要因、産業動向分析、2025年~2034年の予測Artificial Intelligence as a Service (AIaaS) Market Opportunity, Growth Drivers, Industry Trend Analysis, and Forecast 2025 - 2034 |
||||||
カスタマイズ可能
|
|||||||
| AIaaS(AI as a Service)市場の機会、成長促進要因、産業動向分析、2025年~2034年の予測 |
|
出版日: 2025年03月10日
発行: Global Market Insights Inc.
ページ情報: 英文 170 Pages
納期: 2~3営業日
|

全表示
- 概要
- 目次
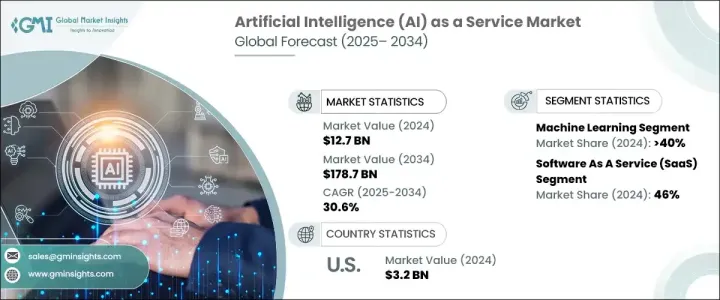
世界のAIaaS(AI as a Service)市場は、2024年に127億米ドルと評価され、2025年から2034年にかけてCAGR 30.6%で成長すると予想されています。
AIがデジタルトランスフォーメーションの礎石となる中、各業界の企業は競争力と俊敏性を維持するためにAIaaSソリューションを急速に取り入れています。自動化、データ主導の意思決定、顧客体験の向上に対する需要の高まりが、AIaaSプラットフォームの普及に拍車をかけています。これらのソリューションにより、企業は高価な社内インフラを構築することなく高度なAIツールにアクセスできるようになり、AIの統合がより実現可能でスケーラブルになります。
AIaaSプラットフォームは、企業がプロセスを合理化し、オペレーションを最適化し、反復的なタスクにおける人間の介入を減らすことを支援することで、業界に革命をもたらしています。AI機能の進歩に伴い、より多くの企業がAIaaSを活用して革新的なアプリケーションを開発し、顧客とのやり取りをパーソナライズし、より良い意思決定のためのリアルタイムの洞察を得ています。企業は、インテリジェントなチャットボットや不正検知から予測分析、サプライチェーンの最適化まで、拡大する使用事例に対応する柔軟でコスト効率の高いモデルを提供するAIaaSプロバイダーを求めるようになっています。デジタル化が重視され、継続的なイノベーションの必要性が高まっていることから、AIaaSはビジネスの成長とオペレーショナル・エクセレンスを実現する重要な手段として位置付けられ、大企業と中小企業の両方を魅了しています。
| 市場範囲 | |
|---|---|
| 開始年 | 2024 |
| 予測年 | 2025-2034 |
| 開始金額 | 127億米ドル |
| 予測金額 | 1,787億米ドル |
| CAGR | 30.6% |
AIaaS市場の成長を促進する主な要因は、さまざまな業界における自動化需要の高まりです。AIaaSは、生産性の向上、顧客サービスの最適化、大量のデータの効率的な管理、運用コストの削減のために不可欠なツールを企業に提供します。企業がパフォーマンスを向上させ、業務を合理化するスマートな方法を模索する中、AIaaSプラットフォームに対する需要は急増し続けています。産業オートメーションと制御システムの市場拡大は、AI主導型テクノロジーの採用をさらに加速させています。ヘルスケア、小売、金融、製造、物流など、さまざまな分野の企業がAIaaSを採用し、カスタマーサポート、データ入力、在庫管理などの重要な機能を自動化することで、効率性の向上とイノベーションの推進を図っています。
AIaaS市場は、技術別に機械学習(ML)、自然言語処理(NLP)、コンピュータビジョン、その他に区分されます。このうち、機械学習分野が40%のシェアを占め、2024年には50億米ドルを創出します。MLは、レコメンデーション・エンジン、不正検出システム、予測分析、プロセス自動化など、数多くのAIアプリケーションのバックボーンを形成しています。企業がより深い洞察力を引き出し、意思決定を自動化しようとする中、MLは複数の業界に適応できるため、AIaaSの提供に不可欠な要素となっています。
提供サービスの観点から、市場はサービスとしてのインフラ、サービスとしてのプラットフォーム、サービスとしてのソフトウェア(SaaS)に分けられます。SaaSセグメントは2024年の市場シェアで46%を占め、オンプレミス・ソリューションのような高額な先行投資をすることなく、強力なAIツールへのサブスクリプション・ベースでのアクセスを企業に提供します。SaaSモデルは比類のない拡張性と柔軟性を提供するため、あらゆる規模の組織にとってAI導入がより身近になり、AIaaS市場の成長をさらに後押しします。
北米は2024年のAIaaS世界市場で34%のシェアを占めています。米国は、AIaaS展開のバックボーンとして機能する高度なクラウドコンピューティング・エコシステムで際立っています。米国を拠点とする大手プロバイダーは、堅牢でスケーラブルなクラウドプラットフォームを提供し、企業がAIソリューションをシームレスに統合できるようにすることで、コストを削減し、業界全体で最先端のAIツールへのアクセスを拡大しています。
目次
第1章 調査手法と調査範囲
第2章 エグゼクティブサマリー
第3章 業界洞察
- エコシステム分析
- サプライヤーの状況
- AIaaSプロバイダー
- テクノロジー・インテグレーターとコンサルタント
- エンドユース
- 利益率分析
- テクノロジー&イノベーション・情勢
- 特許分析
- 主要ニュース&イニシアチブ
- 規制状況
- 影響要因
- 促進要因
- AI技術の進歩
- 自動化への需要の高まり
- コスト効率と拡張性の向上
- クラウド導入の増加
- パーソナライズされた顧客体験へのニーズの高まり
- 業界の潜在的リスク&課題
- データのプライバシーとセキュリティに関する懸念
- 社内専門家の不足
- 促進要因
- 成長可能性分析
- ポーター分析
- PESTEL分析
第4章 競合情勢
- イントロダクション
- 企業シェア分析
- 競合のポジショニング・マトリックス
- 戦略展望マトリックス
第5章 市場推計・予測:技術別、2021年~2034年
- 主要動向
- 機械学習(ML)
- コンピュータビジョン
- 自然言語処理(NLP)
- その他
第6章 市場推計・予測:クラウドタイプ別、2021年~2034年
- 主要動向
- パブリック
- ハイブリッド
- プライベート
第7章 市場推計・予測:組織規模別、2021年~2034年
- 主要動向
- 中小企業
- 大企業
第8章 市場推計・予測:オファリング別、2021年~2034年
- 主要動向
- Infrastructure as a service
- Platform as a service
- Software as a service
第9章 市場推計・予測:業界別、2021年~2034年
- 主要動向
- 銀行・金融・保険(BFSI)
- ヘルスケア・ライフサイエンス
- 小売
- IT・通信
- 政府・防衛
- 製造業
- エネルギー・公益事業
- その他
第10章 市場推計・予測:地域別、2021年~2034年
- 主要動向
- 北米
- 米国
- カナダ
- 欧州
- 英国
- ドイツ
- フランス
- イタリア
- スペイン
- ロシア
- 北欧
- アジア太平洋
- 中国
- インド
- 日本
- オーストラリア
- 韓国
- 東南アジア
- ラテンアメリカ
- ブラジル
- メキシコ
- アルゼンチン
- 中東・アフリカ
- UAE
- 南アフリカ
- サウジアラビア
第11章 企業プロファイル
- Alibaba Cloud
- Amazon Web Services
- Baidu Cloud
- BigML
- C3.ai
- Datarobot
- Fair Isaac
- H2O.ai
- IBM
- Intel
- Iris.ai
- Meta AI
- Microsoft
- NVIDIA
- Oracle
- Salesforce
- SAP
- Siemens
- Palantir
- Yellow.ai
The Global Artificial Intelligence as a Service Market was valued at USD 12.7 billion in 2024 and is expected to grow at a CAGR of 30.6% between 2025 and 2034. As AI becomes a cornerstone of digital transformation, businesses across industries are rapidly embracing AIaaS solutions to remain competitive and agile. The rising demand for automation, data-driven decision-making, and enhanced customer experiences is fueling the widespread adoption of AIaaS platforms. These solutions allow companies to access advanced AI tools without building expensive in-house infrastructure, making AI integration more feasible and scalable.
AIaaS platforms are revolutionizing industries by helping businesses streamline processes, optimize operations, and reduce human intervention in repetitive tasks. As AI capabilities advance, more companies are leveraging AIaaS to develop innovative applications, personalize customer interactions, and gain real-time insights for better decision-making. Enterprises are increasingly seeking AIaaS providers that offer flexible, cost-efficient models to address a growing range of use cases-from intelligent chatbots and fraud detection to predictive analytics and supply chain optimization. The growing emphasis on digitalization and the need for continuous innovation have positioned AIaaS as a critical enabler of business growth and operational excellence, attracting both large enterprises and small to mid-sized businesses.
| Market Scope | |
|---|---|
| Start Year | 2024 |
| Forecast Year | 2025-2034 |
| Start Value | $12.7 Billion |
| Forecast Value | $178.7 Billion |
| CAGR | 30.6% |
The primary factor driving the AIaaS market's growth is the rising demand for automation across various industry verticals. AIaaS gives organizations the essential tools to enhance productivity, optimize customer service, manage large data volumes efficiently, and reduce operational costs. As businesses look for smarter ways to improve performance and streamline operations, the demand for AIaaS platforms continues to surge. The expanding market for industrial automation and control systems is further accelerating the adoption of AI-driven technologies. Companies across sectors such as healthcare, retail, finance, manufacturing, and logistics are embracing AIaaS to automate key functions like customer support, data entry, inventory management, and more, thereby improving efficiency and driving innovation.
The AIaaS market is segmented by technology into machine learning (ML), natural language processing (NLP), computer vision, and others. Among these, the machine learning segment dominated with a 40% share, generating USD 5 billion in 2024. ML forms the backbone of numerous AI applications, including recommendation engines, fraud detection systems, predictive analytics, and process automation. Its adaptability across multiple industries makes ML an indispensable part of AIaaS offerings, as companies seek to unlock deeper insights and automate decision-making.
In terms of offerings, the market is divided into infrastructure as a service, platform as a service, and software as a service (SaaS). The SaaS segment led with a 46% market share in 2024, providing businesses with subscription-based access to powerful AI tools without the high upfront investment of on-premises solutions. SaaS models offer unparalleled scalability and flexibility, making AI adoption more accessible for organizations of all sizes, further propelling AIaaS market growth.
North America held a 34% share of the global AIaaS market in 2024. The U.S. stands out with its advanced cloud computing ecosystem, which serves as a backbone for AIaaS deployment. Leading U.S.-based providers offer robust, scalable cloud platforms that enable businesses to seamlessly integrate AI solutions, driving down costs and expanding access to cutting-edge AI tools across industries.
Table of Contents
Chapter 1 Methodology & Scope
- 1.1 Research design
- 1.1.1 Research approach
- 1.1.2 Data collection methods
- 1.2 Base estimates & calculations
- 1.2.1 Base year calculation
- 1.2.2 Key trends for market estimation
- 1.3 Forecast model
- 1.4 Primary research and validation
- 1.4.1 Primary sources
- 1.4.2 Data mining sources
- 1.5 Market scope & definition
Chapter 2 Executive Summary
- 2.1 Industry 3600 synopsis, 2021 - 2034
Chapter 3 Industry Insights
- 3.1 Industry ecosystem analysis
- 3.2 Supplier landscape
- 3.2.1 AIaaS Providers
- 3.2.2 Technology integrators and consultants
- 3.2.3 End Use
- 3.3 Profit margin analysis
- 3.4 Technology & innovation landscape
- 3.5 Patent analysis
- 3.6 Key news & initiatives
- 3.7 Regulatory landscape
- 3.8 Impact forces
- 3.8.1 Growth drivers
- 3.8.1.1 Advancements in AI technologies
- 3.8.1.2 Increasing demand for automation
- 3.8.1.3 Improved cost efficiency and scalability
- 3.8.1.4 Rising cloud adoption
- 3.8.1.5 Growing need for personalized customer experiences
- 3.8.2 Industry pitfalls & challenges
- 3.8.2.1 Data privacy and security concerns
- 3.8.2.2 Lack of in-house expertise
- 3.8.1 Growth drivers
- 3.9 Growth potential analysis
- 3.10 Porter's analysis
- 3.11 PESTEL analysis
Chapter 4 Competitive Landscape, 2024
- 4.1 Introduction
- 4.2 Company market share analysis
- 4.3 Competitive positioning matrix
- 4.4 Strategic outlook matrix
Chapter 5 Market Estimates & Forecast, By Technology, 2021 - 2034 ($Bn)
- 5.1 Key trends
- 5.2 Machine Learning (ML)
- 5.3 Computer vision
- 5.4 Natural Language Processing (NLP)
- 5.5 Others
Chapter 6 Market Estimates & Forecast, By Cloud Type, 2021 - 2034 ($Bn)
- 6.1 Key trends
- 6.2 Public
- 6.3 Hybrid
- 6.4 Private
Chapter 7 Market Estimates & Forecast, By Organization Size, 2021 - 2034 ($Bn)
- 7.1 Key trends
- 7.2 SME
- 7.3 Large enterprise
Chapter 8 Market Estimates & Forecast, By Offering, 2021 - 2034 ($Bn)
- 8.1 Key trends
- 8.2 Infrastructure as a service
- 8.3 Platform as a service
- 8.4 Software as a service
Chapter 9 Market Estimates & Forecast, By Industry Vertical, 2021 - 2034 ($Bn)
- 9.1 Key trends
- 9.2 Banking, Financial, and Insurance (BFSI)
- 9.3 Healthcare and Life Sciences
- 9.4 Retail
- 9.5 IT & Telecommunication
- 9.6 Government and defense
- 9.7 Manufacturing
- 9.8 Energy & Utility
- 9.9 Others
Chapter 10 Market Estimates & Forecast, By Region, 2021 - 2034 ($Bn)
- 10.1 Key trends
- 10.2 North America
- 10.2.1 U.S.
- 10.2.2 Canada
- 10.3 Europe
- 10.3.1 UK
- 10.3.2 Germany
- 10.3.3 France
- 10.3.4 Italy
- 10.3.5 Spain
- 10.3.6 Russia
- 10.3.7 Nordics
- 10.4 Asia Pacific
- 10.4.1 China
- 10.4.2 India
- 10.4.3 Japan
- 10.4.4 Australia
- 10.4.5 South Korea
- 10.4.6 Southeast Asia
- 10.5 Latin America
- 10.5.1 Brazil
- 10.5.2 Mexico
- 10.5.3 Argentina
- 10.6 MEA
- 10.6.1 UAE
- 10.6.2 South Africa
- 10.6.3 Saudi Arabia
Chapter 11 Company Profiles
- 11.1 Alibaba Cloud
- 11.2 Amazon Web Services
- 11.3 Baidu Cloud
- 11.4 BigML
- 11.5 C3.ai
- 11.6 Datarobot
- 11.7 Fair Isaac
- 11.8 Google
- 11.9 H2O.ai
- 11.10 IBM
- 11.11 Intel
- 11.12 Iris.ai
- 11.13 Meta AI
- 11.14 Microsoft
- 11.15 NVIDIA
- 11.16 Oracle
- 11.17 Salesforce
- 11.18 SAP
- 11.19 Siemens
- 11.20 Palantir
- 11.21 Yellow.ai

