
|
市場調査レポート
商品コード
1913358
バーチャルプロダクションの市場機会、成長要因、業界動向分析、および2026年から2035年までの予測Virtual Production Market Opportunity, Growth Drivers, Industry Trend Analysis, and Forecast 2026 - 2035 |
||||||
カスタマイズ可能
|
|||||||
| バーチャルプロダクションの市場機会、成長要因、業界動向分析、および2026年から2035年までの予測 |
|
出版日: 2025年12月16日
発行: Global Market Insights Inc.
ページ情報: 英文 170 Pages
納期: 2~3営業日
|

概要
世界のバーチャルプロダクション市場は、2025年に29億米ドルと評価され、2035年までにCAGR21.1%で成長し、185億米ドルに達すると予測されております。
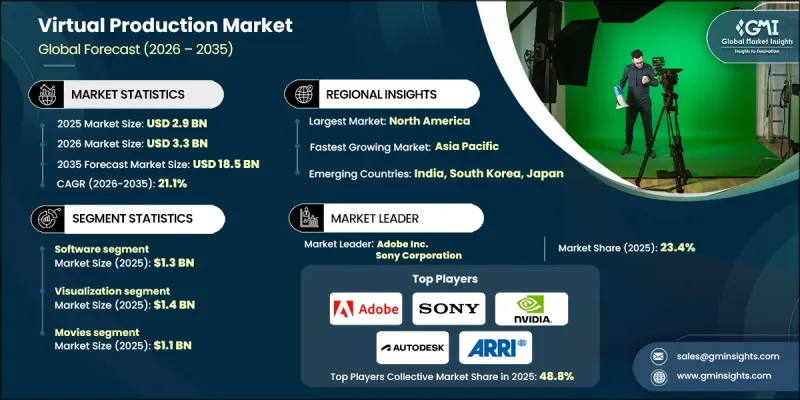
この市場の成長は、映画制作におけるVFX(視覚効果)の採用拡大、コマーシャルにおけるバーチャル技術の活用増加、およびバーチャルプロダクションスタジオへのLEDウォール技術の導入拡大によって推進されています。さらに、仮想環境内でのAI駆動型コンテンツ制作やゲームコンテンツへの需要が成長を加速させています。LEDウォール技術は業界の変革をもたらしており、スタジオがフォトリアリスティックなデジタル環境をリアルタイムで動的に調整可能にすることで、大規模な物理セットや複数の撮影場所の必要性を排除しています。この革新は創造的な柔軟性を高め、制作時間とコストを劇的に削減し、映画製作者が広大で没入感のある世界を効率的に制作することを可能にすることで、コンテンツ制作のスピードと拡張性を根本的に変革しています。
| 市場範囲 | |
|---|---|
| 開始年 | 2025年 |
| 予測年度 | 2026-2035 |
| 開始時価値 | 29億米ドル |
| 予測金額 | 185億米ドル |
| CAGR | 21.1% |
ソフトウェア分野は2025年に13億米ドルの収益を生み出しました。この成長は、高度なVFXツール、リアルタイムレンダリングソリューション、AI搭載ソフトウェアアプリケーションに対する需要の高まりによって推進されています。企業は、増大する需要に応えるため、エンターテインメント、ゲーム、広告分野向けに、リアルタイムレンダリングの改善、AIによる自動化の強化、スケーラブルなソフトウェアソリューションの開発に注力しています。
フルライブLEDウォールセグメントは、2026年から2035年にかけてCAGR25.3%で成長すると予測されています。バーチャルプロダクションにおける没入感があり、変更可能な背景への需要の高まりがこの成長を牽引しており、フルライブLEDウォールは物理的なセットに関連するコストと時間を削減しつつ、現実的で適応性の高い環境を提供します。
米国バーチャルプロダクション市場は、同国の活況を呈するエンターテインメント産業、技術導入、映画・ゲーム・広告分野における革新的ソリューションへの需要に牽引され、2025年には9億9,140万米ドルに達しました。各社はバーチャルプロダクション技術の高度化、VFX能力の強化、米国市場内の特定ニーズに応じたサービス提供の最適化に注力しております。
よくあるご質問
目次
第1章 調査手法と範囲
第2章 エグゼクティブサマリー
第3章 業界考察
- エコシステム分析
- サプライヤーの情勢
- 利益率
- コスト構造
- 各段階における付加価値
- バリューチェーンに影響を与える要因
- ディスラプション
- エコシステム分析
- 業界への影響要因
- 促進要因
- 映画制作スタジオにおける視覚効果(VFX)の需要増加
- コマーシャル広告におけるバーチャルプロダクションの応用拡大
- LEDウォール技術の導入拡大
- バーチャルプロダクションにおけるAI導入の拡大
- ゲーム分野におけるバーチャルプロダクションの需要拡大
- 課題と困難
- 熟練した専門家の不足
- 高額な資本支出と初期設定費用
- 市場機会
- リアルタイムレンダリング技術の進歩
- テレビおよびストリーミングにおけるバーチャルプロダクションの拡大
- 促進要因
- 成長可能性分析
- 規制情勢
- 北米
- 欧州
- アジア太平洋地域
- ラテンアメリカ
- 中東・アフリカ
- ポーター分析
- PESTEL分析
- 技術とイノベーションの動向
- 現在の技術動向
- 新興技術
- 新興ビジネスモデル
- コンプライアンス要件
- 持続可能性対策
- 消費者心理分析
- 特許および知的財産分析
- 地政学的・貿易動向
第4章 競合情勢
- イントロダクション
- 企業の市場シェア分析
- 地域別
- 北米
- 欧州
- アジア太平洋地域
- ラテンアメリカ
- 中東・アフリカ
- 市場集中度分析
- 地域別
- 主要企業の競合ベンチマーキング
- 財務実績比較
- 収益
- 利益率
- 研究開発
- 製品ポートフォリオ比較
- 製品ラインの広さ
- 技術
- イノベーション
- 地理的プレゼンス比較
- 世界展開分析
- サービスネットワークのカバー率
- 地域別市場浸透率
- 競合ポジショニングマトリックス
- リーダー企業
- 課題者
- フォロワー
- ニッチプレイヤー
- 戦略的展望マトリックス
- 財務実績比較
- 主な発展, 2021-2024
- 合併・買収
- 提携および協力関係
- 技術的進歩
- 拡大と投資戦略
- サステナビリティへの取り組み
- デジタルトランスフォーメーションの取り組み
- 新興/スタートアップ競合の動向
第5章 市場推計・予測:コンポーネント別、2022-2035
- ハードウェア
- ソフトウェア
- サービス
第6章 市場推計・予測:タイプ別、2022-2035
- ビジュアライゼーション
- ピッチヴィズ
- プリヴィズ
- バーチャルスカウティング
- テックヴィズ
- スタントヴィズ
- ポストヴィズ
- パフォーマンスキャプチャー
- ハイブリッド・グリーンスクリーン・ライブ
- フルライブLEDウォール
第7章 市場推計・予測:最終用途別、2022-2035
- フィルム
- テレビシリーズ
- コマーシャル広告
- オンライン動画
- 放送スタジオ
- ニュース放送
- スポーツ番組・娯楽番組
- 娯楽番組
- 天気・交通スタジオ
- 政治・金融解説
- ライブイベント放送
- 教育・公共サービスチャンネル
- その他
第8章 市場推計・予測:地域別、2022-2035
- 北米
- 米国
- カナダ
- 欧州
- ドイツ
- 英国
- フランス
- スペイン
- イタリア
- オランダ
- アジア太平洋地域
- 中国
- インド
- 日本
- オーストラリア
- 韓国
- ラテンアメリカ
- ブラジル
- メキシコ
- アルゼンチン
- 中東・アフリカ
- サウジアラビア
- 南アフリカ
- アラブ首長国連邦
第9章 企業プロファイル
- 世界の主要企業
- Adobe Inc.
- Sony Corporation
- NVIDIA Corporation
- Epic Games Inc.
- 地域別主要企業
- 北米
- Autodesk Inc.
- FuseFX
- Mo-Sys Engineering Ltd.
- 欧州
- ARRI AG
- BORIS FX, INC
- Asia-Pacific
- HTC Corporation
- Insta360
- 北米
- ディスラプター/ニッチプレイヤー
- Pixotope

