|
|
市場調査レポート
商品コード
1577052
飼料用アミノ酸市場、市場動向と成長促進要因、産業動向分析と予測、2024年~2032年Feed Amino Acids Market, Opportunity, Growth Drivers, Industry Trend Analysis and Forecast, 2024-2032 |
||||||
|
|||||||
カスタマイズ可能
|
|||||||

| 飼料用アミノ酸市場、市場動向と成長促進要因、産業動向分析と予測、2024年~2032年 |
|
出版日: 2024年08月07日
発行: Global Market Insights Inc.
ページ情報: 英文 200 Pages
納期: 2~3営業日
|

全表示
- 概要
- 目次
世界の飼料用アミノ酸市場は、2023年に76億9,000万米ドルの評価額に達し、2024年から2032年にかけてCAGR 5.8%で成長すると予測されています。
この市場は、家畜や家禽の成長、健康、パフォーマンスを向上させるために動物飼料に組み込まれる必須アミノ酸の生産と供給に焦点を当てています。この市場の主要アミノ酸には、リジン、メチオニン、スレオニン、トリプトファンが含まれ、いずれもタンパク質合成と動物栄養全般に欠かせません。
世界の食肉と乳製品の消費量は増加傾向にあり、優れた飼料品質への需要が高まっています。アミノ酸の配合と生産における革新は、飼料の効率と費用対効果を高めています。動物栄養学が重視されるようになり、バランスの取れたアミノ酸プロファイルの利点が市場の成長を後押ししています。飼料慣行の改善と持続可能性に対する規制当局の支援により、飼料転換率の向上と環境への影響の低減を目指した精密栄養が推進されています。水産養殖と養鶏セクターの拡大により、特殊なアミノ酸サプリメントの需要が増加しており、FAOは世界の水産養殖生産量が2024年までに1,000億トンを超えると予測しています。
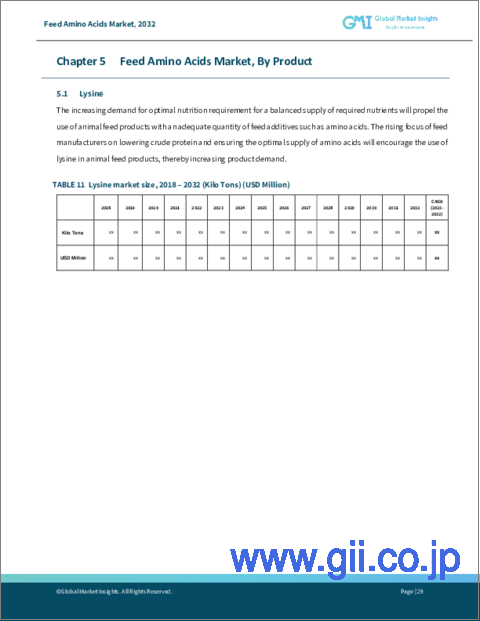
飼料用アミノ酸市場のリジン部門は、2024年から2032年にかけて5.3%以上の成長率を示し、推定28億7,000万米ドルに達すると予測されています。家畜の栄養ニーズを満たすための飼料添加物需要の高まりが、飼料生産におけるリジンの使用を促進しています。畜産農家がリジンを好むのは、その健康上のメリットだけでなく、特に大豆粕のような高価な原材料の代替となるコスト削減の可能性があるからです。さらに、飼料生産が環境に与える影響を緩和するリジンの役割も認識されつつあり、さまざまなリジン化合物が飼料の栄養プロファイルを向上させる効果があることが多くの研究で検証されています。
飼料用アミノ酸市場の豚肉セグメントは、CAGR 5.1%で成長し、2032年までに約31億2,000万米ドルに達すると設定されています。高タンパク豚肉に対する需要の高まりが、豚の健康とパフォーマンスを向上させるための強化飼料の必要性を高めています。さらに、アフリカ豚熱(ASF)やその他の感染症のような新たな脅威が、飼料添加物の需要を高めています。汚染された豚肉は人間の胃腸障害につながる可能性があり、家畜の適切な世話と栄養の重要性が強調されています。米国農務省のデータによると、豚肉は年間10億件の食中毒サルモネラ症患者の8~13%を占めています。
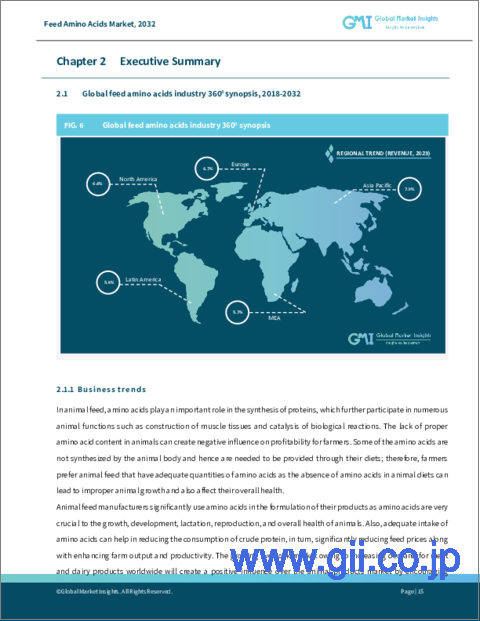
アジア太平洋地域の飼料用アミノ酸市場の売上は、CAGR 6.5%で、2032年までに45億8,000万米ドルに近づくと予測されています。この地域には数多くの飼料会社があり、有利なビジネスチャンスを生み出しています。インドや中国のような国々は、人口増加に煽られた食肉と食肉製品の需要の急増によって、業界の成長を目の当たりにしています。栄養価の高い動物飼料への需要の高まりが、この地域の成長をさらに後押ししています。
目次
第1章 調査手法と調査範囲
第2章 エグゼクティブサマリー
第3章 業界洞察
- エコシステム分析
- 主要メーカー
- 流通業者
- 業界全体の利益率
- 業界への影響要因
- 促進要因
- 動物性タンパク質に対する需要の高まり
- 栄養技術の進歩
- 規制支援と持続可能性への取り組み
- 市場の課題
- 消費者の認知度の低下
- 既存代替品との競合
- 市場機会
- 新たな機会
- 潜在成長力の分析
- 促進要因
- 原材料の状況
- 製造動向
- 技術の進化
- 持続可能な製造
- グリーン・プラクティス
- 脱炭素化
- 持続可能な製造
- 原材料の持続可能性
- 価格動向(米ドル/トン)、2021年~2032年
- 規制と市場への影響
- ポーター分析
- PESTEL分析
第4章 競合情勢
- 企業シェア分析
- 競合のポジショニング・マトリックス
- 戦略展望マトリックス
第5章 市場規模・予測:製品別、2021年~2032年
- 主要動向
- リジン
- トリプトファン
- グルタミン酸
- スレオニン
- バリン
- アルギニン
- L-ヒスチジン
- L-イソロイシン
- ロイシン
- フェニルアラニン
第6章 市場規模・予測:用途別、2021年~2032年
- 主要動向
- 牛
- 乳製品
- 牛肉
- 子牛
- 豚
- 種豚
- 子豚
- その他
- 家禽
- ブロイラー
- レイヤード
- ターキー
- その他
- 水産養殖
- サーモン
- マス
- エビ
- その他
- ペットフード
- 犬
- 猫
- その他
第7章 市場規模・予測:地域別、2021年~2032年
- 主要動向
- 北米
- 米国
- カナダ
- 欧州
- ドイツ
- 英国
- フランス
- イタリア
- スペイン
- その他欧州
- アジア太平洋
- 中国
- インド
- 日本
- 韓国
- オーストラリア
- その他アジア太平洋地域
- ラテンアメリカ
- ブラジル
- メキシコ
- アルゼンチン
- その他ラテンアメリカ
- 中東・アフリカ
- サウジアラビア
- UAE
- 南アフリカ
- その他の中東・アフリカ
第8章 企業プロファイル
- Meihua Group
- Ajinomoto Co., Inc.
- Ningxia Eppen Biotech Co., Ltd
- Archer-Daniels-Midland Company(ADM)
- Global Bio-chem Technology Group Company Limited
- CJ Cheiljedang Corporation
- Daesang Corporation
- Henan Julong Biological Engineering Co., Ltd
- Multi Vita
- Kemin Industries, Inc
- Evonik Industries AG
- BBCA Group
- Heilongjiang Chengfu Food Group Co., Ltd.
The Global Feed Amino Acids Market reached a valuation of USD 7.69 billion in 2023 and is anticipated to grow at a CAGR of 5.8% from 2024 to 2032. This market focuses on producing and supplying essential amino acids, which are incorporated into animal feed to enhance the growth, health, and performance of livestock and poultry. Key amino acids in this market include lysine, methionine, threonine, and tryptophan, all crucial for protein synthesis and overall animal nutrition.
Global meat and dairy consumption is on the rise, driving the demand for superior feed quality. Innovations in amino acid formulations and production are enhancing feed efficiency and cost-effectiveness. A growing emphasis on animal nutrition and the benefits of balanced amino acid profiles are propelling market growth. Regulatory support for improved feed practices and sustainability is promoting precision nutrition, aiming to enhance feed conversion rates and reduce environmental impacts. The expanding aquaculture and poultry sectors are increasing the demand for specialized amino acid supplements, with the FAO projecting global aquaculture production to surpass 100 billion metric tons by 2024.
The lysine segment of the feed amino acids market is projected to grow at over 5.3% between 2024 and 2032, reaching an estimated USD 2.87 billion. The rising demand for feed additives to satisfy livestock nutritional needs is driving lysine usage in feed production. Livestock farmers favor lysine not only for its health benefits but also for its cost-saving potential, especially in replacing pricier raw materials like soybean meal. Additionally, lysine's role in mitigating the environmental impact of feed production is gaining recognition, with numerous studies validating the effectiveness of various lysine compounds in enhancing feed's nutritional profile.
The swine segment of the feed amino acids market is set to reach nearly USD 3.12 billion by 2032, growing at a CAGR of 5.1%. The rising demand for high-protein pork is boosting the need for fortified feed to enhance swine health and performance. Furthermore, emerging threats like African swine fever (ASF) and other infectious diseases are heightening the demand for feed additives. Given that contaminated pork can lead to human gastrointestinal issues, underscoring the importance of proper livestock care and nutrition. USDA data highlights that pork is responsible for 8% to 13% of the annual 1 billion foodborne human salmonellosis cases.
Asia Pacific's feed amino acids market revenue is projected to approach USD 4.58 billion by 2032, with 6.5% CAGR. The region's numerous feed companies are creating lucrative business opportunities. Countries like India and China are witnessing industry growth, driven by their surging demand for meat and meat products fueled by a rising population. This increasing demand for nutrient-rich animal feed is further propelling regional growth.
Table of Contents
Chapter 1 Methodology and Scope
- 1.1 Market scope and definition
- 1.2 Base estimates and calculations
- 1.3 Forecast calculation
- 1.4 Data sources
- 1.4.1 Primary
- 1.4.2 Secondary
- 1.4.2.1 Paid sources
- 1.4.2.2 Public sources
Chapter 2 Executive Summary
- 2.1 Industry 360° synopsis
Chapter 3 Industry Insights
- 3.1 Industry ecosystem analysis
- 3.1.1 Key manufacturers
- 3.1.2 Distributors
- 3.1.3 Profit margins across the industry
- 3.2 Industry impact forces
- 3.2.1 Growth drivers
- 3.2.1.1 Rising demand for animal protein
- 3.2.1.2 Advancements in nutrition technology
- 3.2.1.3 Regulatory support and sustainability initiatives
- 3.2.2 Market challenges
- 3.2.2.1 Limited consumer awareness
- 3.2.2.2 Competition from established alternatives
- 3.2.3 Market opportunity
- 3.2.3.1 New opportunities
- 3.2.3.2 Growth potential analysis
- 3.2.1 Growth drivers
- 3.3 Raw material landscape
- 3.3.1 Manufacturing trends
- 3.3.2 Technology evolution
- 3.3.2.1 Sustainable manufacturing
- 3.3.2.1.1 Green practices
- 3.3.2.1.2 Decarbonization
- 3.3.2.1 Sustainable manufacturing
- 3.3.3 Sustainability in raw materials
- 3.3.4 Pricing trends (USD/Ton), 2021 - 2032
- 3.3.4.1 North America
- 3.3.4.2 Europe
- 3.3.4.3 Asia Pacific
- 3.3.4.4 Latin America
- 3.3.4.5 Middle East and Africa
- 3.4 Regulations and market impact
- 3.5 Porter's analysis
- 3.6 PESTEL analysis
Chapter 4 Competitive Landscape, 2023
- 4.1 Company market share analysis
- 4.2 Competitive positioning matrix
- 4.3 Strategic outlook matrix
Chapter 5 Market Size and Forecast, By Product, 2021-2032 (USD Billion, Tons)
- 5.1 Key trends
- 5.2 Lysine
- 5.3 Tryptophan
- 5.4 Glutamic acid
- 5.5 Threonine
- 5.6 Valine
- 5.7 Arginine
- 5.8 L-Histidine
- 5.9 L-Isoleucine
- 5.10 Leucine
- 5.11 Phenylalanine
Chapter 6 Market Size and Forecast, By Application, 2021-2032 (USD Billion, Tons)
- 6.1 Key trends
- 6.2 Cattle
- 6.2.1 Dairy
- 6.2.2 Beef
- 6.2.3 Calf
- 6.3 Swine
- 6.3.1 Sow
- 6.3.2 Piglet
- 6.3.3 Others
- 6.4 Poultry
- 6.4.1 Broilers
- 6.4.2 Layers
- 6.4.3 Turkey
- 6.4.4 Others
- 6.5 Aquaculture
- 6.5.1 Salmon
- 6.5.2 Trout
- 6.5.3 Shrimp
- 6.5.4 Others
- 6.6 Pet food
- 6.6.1 Dog
- 6.6.2 Cat
- 6.7 Others
Chapter 7 Market Size and Forecast, By Region, 2021-2032 (USD Billion, Tons)
- 7.1 Key trends
- 7.2 North America
- 7.2.1 U.S.
- 7.2.2 Canada
- 7.3 Europe
- 7.3.1 Germany
- 7.3.2 UK
- 7.3.3 France
- 7.3.4 Italy
- 7.3.5 Spain
- 7.3.6 Rest of Europe
- 7.4 Asia Pacific
- 7.4.1 China
- 7.4.2 India
- 7.4.3 Japan
- 7.4.4 South Korea
- 7.4.5 Australia
- 7.4.6 Rest of Asia Pacific
- 7.5 Latin America
- 7.5.1 Brazil
- 7.5.2 Mexico
- 7.5.3 Argentina
- 7.5.4 Rest of Latin America
- 7.6 MEA
- 7.6.1 Saudi Arabia
- 7.6.2 UAE
- 7.6.3 South Africa
- 7.6.4 Rest of MEA
Chapter 8 Company Profiles
- 8.1 Meihua Group
- 8.2 Ajinomoto Co., Inc.
- 8.3 Ningxia Eppen Biotech Co., Ltd
- 8.4 Archer-Daniels-Midland Company (ADM)
- 8.5 Global Bio-chem Technology Group Company Limited
- 8.6 CJ Cheiljedang Corporation
- 8.7 Daesang Corporation
- 8.8 Henan Julong Biological Engineering Co., Ltd
- 8.9 Multi Vita
- 8.10 Kemin Industries, Inc
- 8.11 Evonik Industries AG
- 8.12 BBCA Group
- 8.13 Heilongjiang Chengfu Food Group Co., Ltd.

