
|
市場調査レポート
商品コード
1844342
慢性静脈閉塞症治療の市場機会、成長促進要因、産業動向分析、2025年~2034年予測Chronic Venous Occlusions Treatment Market Opportunity, Growth Drivers, Industry Trend Analysis, and Forecast 2025 - 2034 |
||||||
カスタマイズ可能
|
|||||||
| 慢性静脈閉塞症治療の市場機会、成長促進要因、産業動向分析、2025年~2034年予測 |
|
出版日: 2025年09月19日
発行: Global Market Insights Inc.
ページ情報: 英文 160 Pages
納期: 2~3営業日
|

概要
世界の慢性静脈閉塞症治療市場は、2024年には70億米ドルと評価され、CAGR 4.7%で成長し、2034年には112億米ドルに達すると推定されています。
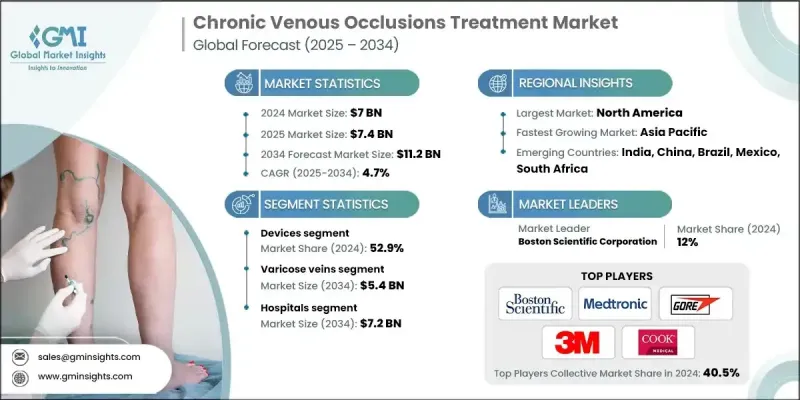
着実な成長の背景には、静脈疾患の増加、高齢者人口の増加、治療アプローチにおける継続的な技術進歩があります。ヘルスケアシステムが患者の予後改善にますます重点を置くようになる中、低侵襲治療と個別化治療戦略の採用が大きな牽引力となっています。患者と臨床医の間で意識が高まるにつれ、早期診断と積極的な治療計画が一般的になりつつあります。ヘルスケア・キャンペーン、患者教育プログラム、償還支援の拡大が業界の発展を後押ししています。デジタルヘルス技術と従来の治療モデルの融合は、治療後の管理にも変化をもたらしています。機器メーカー、医薬品開発企業、ヘルスケアプロバイダーなど、バリューチェーン全体の企業が戦略的パートナーシップを結び、革新的なソリューションを導入し、ケアへのアクセシビリティを高めています。さらに、成熟経済圏における医療費の増加と政策支援が、この分野全体の将来的な成長のための強固な基盤を構築しています。
| 市場範囲 | |
|---|---|
| 開始年 | 2024 |
| 予測年 | 2025-2034 |
| 市場規模 | 70億米ドル |
| 予測金額 | 112億米ドル |
| CAGR | 4.7% |
慢性静脈閉塞症治療は、圧迫療法、医薬品、静脈内治療、デジタルモニタリングツールなどの様々なアプローチを通じて、長期的な静脈閉塞の管理に注力しています。これらの治療は、静脈血流を回復させ、合併症を予防し、症状を軽減し、罹患患者の全体的な生活の質を向上させる。根本的な原因には、血管の瘢痕化、血栓症、先天性異常などが含まれることが多く、これらが長期的な管理を必要とする慢性的な症状の一因となっています。
2024年の機器セグメントのシェアは52.9%であったが、これは侵襲性の低い治療への嗜好の高まりと、先進的な静脈内治療ツールや圧迫システムの幅広い使用に起因しています。侵襲的な外科手術からの移行により、回復が早くリスクの少ない治療法が普及しています。アブレーション療法、硬化療法、最新の圧迫着などの技法の使用が増加しているのは、この動向を反映しています。患者もヘルスケア専門家も、日常生活への支障を最小限に抑えて効率的な結果をもたらす解決策をますます好むようになっており、最先端の治療機器に対する需要を牽引しています。
静脈瘤セグメントは48.7%のシェアを占め、2034年までに54億米ドルに達すると予想されています。この優位性は、特に高齢者や座りがちなライフスタイルの人、肥満の人の静脈不全の発生率の高さによるところが大きいです。静脈内レーザーやラジオ波焼灼術のような低侵襲ソリューションへのシフトが市場拡大を後押ししています。生活習慣に関連する要因や社会的意識の高まりが、特に40歳以上の治療希望患者を拡大しています。
北米慢性静脈閉塞症治療2024年のシェアは40.1%。同地域はヘルスケアのインフラが整備されており、認知度が高く、新規治療法の早期導入が進んでいることが主導的地位に貢献しています。慢性不全や血栓症などの静脈合併症に罹患しやすい高齢者人口の増加が、継続的な需要に拍車をかけています。また、診断や償還制度における革新も、この地域全体における先進治療の力強い普及を支えています。
世界の慢性静脈閉塞症治療市場に関わる主要企業ファイザー、ボストン・サイエンティフィック・コーポレーション、テルモ、メドトロニック、タクティル・メディカル、コロプラスト、ゴア、バイエル、サノフィ、ヴィアトリス、アンジオダイナミクス、コンバテック、サイトン、ロイカディア・ファーマシューティカルズ(ヒクマ)、3M、クック・メディカル、コンバテック。慢性静脈閉塞症治療市場の主要企業は、安全性と有効性を高めた低侵襲デバイスや新規医薬品の開発に向けた研究開発を優先しています。戦略的M&Aにより製品ポートフォリオを拡大することで、企業は補完的技術を統合し、市場参入の幅を広げることができます。また、病院や研究機関、デジタルヘルスプラットフォームとのパートナーシップを活用し、患者のモニタリングや長期的な疾患管理を改善する企業も多いです。
目次
第1章 調査手法と範囲
第2章 エグゼクティブサマリー
第3章 業界考察
- エコシステム分析
- 業界への影響要因
- 促進要因
- 静脈瘤の罹患率の増加と治療に対する意識の高まり
- 低侵襲手術への関心の高まり
- 整形外科手術件数の増加
- 慢性静脈不全症の治療に関する技術的進歩
- 業界の潜在的リスク&課題
- さまざまな治療法に伴う副作用とリスク
- 厳格な規制ガイドライン
- 市場機会
- 外来診療および通院診療の需要の増加
- デジタルヘルスとAIの統合
- 促進要因
- 成長可能性分析
- 規制情勢
- 北米
- 欧州
- アジア太平洋地域
- テクノロジーの情勢
- 現在の技術動向
- 低侵襲ステントおよびカテーテルを用いた介入の採用増加
- 正確な診断と治療計画のための高度な画像診断の統合
- 慢性静脈不全に対する圧迫療法の革新の成長
- 新興技術
- 長期的な血管の健康のための生体吸収性ステントの開発
- 静脈閉塞治療のためのAI駆動型画像診断と意思決定支援
- 非侵襲性超音波療法
- 現在の技術動向
- ギャップ分析
- ポーターの分析
- PESTEL分析
- 将来の市場動向
- 外来手術センターを拠点としたケアへの大きな転換
- ヘルスケアアクセスの改善により新興市場への浸透が拡大
- イノベーションとグローバル展開を推進する戦略的コラボレーション
第4章 競合情勢
- イントロダクション
- 企業マトリックス分析
- 企業の市場シェア分析
- グローバル
- 北米
- 欧州
- アジア太平洋地域
- ラテンアメリカ
- 中東・アフリカ
- 競合ポジショニングマトリックス
- 主要市場企業の競合分析
- 主な発展
- 合併と買収
- パートナーシップとコラボレーション
- 新しいサービスタイプの開始
- 拡張計画
第5章 市場推計・予測:製品別、2021-2034
- 主要動向
- デバイス
- 圧迫装置
- 硬化療法
- 静脈内焼灼術
- レーザーアブレーション
- 高周波アブレーション
- 静脈剥離器
- その他のデバイス
- 薬物
- 鎮痛剤
- 抗生物質
- 抗凝固薬
- その他の薬物
第6章 市場推計・予測:用途別、2021-2034
- 主要動向
- 静脈瘤
- 浮腫
- 深部静脈血栓症
- 静脈うっ滞性潰瘍
- その他の用途
第7章 市場推計・予測:最終用途別、2021-2034
- 主要動向
- 病院
- 外来手術センター
- その他の用途
第8章 市場推計・予測:地域別、2021-2034
- 主要動向
- 北米
- 米国
- カナダ
- 欧州
- ドイツ
- 英国
- フランス
- スペイン
- イタリア
- オランダ
- アジア太平洋地域
- 中国
- 日本
- インド
- オーストラリア
- 韓国
- ラテンアメリカ
- ブラジル
- メキシコ
- アルゼンチン
- 中東・アフリカ
- 南アフリカ
- サウジアラビア
- アラブ首長国連邦
第9章 企業プロファイル
- 3M
- AngioDynamics
- Bayer AG
- Boston Scientific Corporation
- Coloplast
- ConvaTec
- Cook Medical
- Gore
- Leucadia Pharmaceuticals(Hikma)
- Medtronic
- Pfizer
- Sanofi
- Sciton
- Tactile Medical
- Terumo
- Viatris

