|
|
市場調査レポート
商品コード
1260664
培養肉の市場規模:ソース別(牛肉、鶏肉、シーフード、豚肉、鴨肉)、エンドユーザー別(バーガー、ナゲット、ミートボール、ソーセージ)、予測2023年~2032年Cultured Meat Market Size By Source (Beef, Poultry, Seafood, Pork, Duck), By End-Use (Burgers, Nuggets, Meatballs, Sausages), & Forecast 2023 - 2032 |
||||||
|
|
|||||||
|
● お客様のご希望に応じて、既存データの加工や未掲載情報(例:国別セグメント)の追加などの対応が可能です。 詳細はお問い合わせください。 |
|||||||


| 培養肉の市場規模:ソース別(牛肉、鶏肉、シーフード、豚肉、鴨肉)、エンドユーザー別(バーガー、ナゲット、ミートボール、ソーセージ)、予測2023年~2032年 |
|
出版日: 2023年03月17日
発行: Global Market Insights Inc.
ページ情報: 英文 350 Pages
納期: 2~3営業日
|
- 全表示
- 概要
- 図表
- 目次
培養肉市場は、食品の安全性と健康上の利点に関する意識の高まりにより、2032年まで大幅に成長すると推定されます。
また、動物性食品の代替品に対する需要の高まりも、今後数年間の業界の成長にプラスの影響を与えると考えられます。汚染が少ない、抗生物質が少ない、環境への影響が少ないなどの利点があり、製品の採用が進むと予想されます。
動物性タンパク質や代替タンパク質の消費量の増加は、2023-2032年の市場曲線にさらに拍車をかけるでしょう。報告によると、2020年には、約1,300万メートルトンの代替タンパク質が世界で消費されました。そのほか、準備に時間がかからず、すぐに提供される食品を提供するクイックサービスレストランの需要が高いことも、製品消費を後押ししそうです。
市場の主要企業は、業界全体における競争力を得るために、M&A、パートナーシップ、研究開発投資、新製品投入などの戦略的取り組みを行っています。一例を挙げると、2021年2月、Mosa Meatは8,500万米ドルのシリーズB資金調達を完了したことを発表しました。調達した資金は、同社の本拠地マーストリヒトにある既存のパイロット生産施設の拡張に使われたようです。
全体として、培養肉産業は、供給源、最終用途、地域の観点から区分されます。
ソースに基づくと、牛肉の消費と需要の増加により、牛肉セグメントは2032年までに34億米ドルで評価されると予想されます。信頼できるレポートによると、2020年の牛肉の世界摂取量は約1,300億ポンドで、米国が肉消費の21%を占めています。さらに、培養牛肉によって克服できる需給ギャップに関する継続的な問題は、今後10年間のセグメント成長を刺激する可能性があります。
最終用途別では、ソーセージ分野が2023年から2032年にかけて154.5%以上のCAGRを示すと予想されます。伝統的な肉の風味を含む無農薬のファストフードに対する需要の高まりは、ソーセージの需要を促進すると予想されます。さらに、いくつかの主要産業は、ドラムスティック、おいしいステーキ、小麦粉を攪拌する光沢のある清潔なアルミニウム製バイオリアクターで従来の農業を置き換える方法を模索しており、これは当面、業界の拡大をさらに支援するものと思われます。
地域別では、欧州の培養肉市場が2032年末までに潜在的な利益を獲得すると予想されています。この地域の市場成長は、代替タンパク質に対する需要の高まりと、COVID-19の流行に伴う健康的な食事と健康維持に対する消費者の意識の高まりに起因していると考えられます。さらに、栄養、安全性、持続可能性は、代替タンパク質が提供する主な特典であり、今後数年間、同地域での採用を促進するものと思われます。
目次
第1章 調査手法とスコープ
第2章 エグゼクティブサマリー
第3章 培養肉業界の洞察
- 業界別セグメンテーション
- 産業規模と予測、2018年~2032年
- COVID-19が業界情勢に与える影響について
- 産業エコシステム分析
- 原材料の仕入れ先
- メーカー
- ディストリビューションチェーン分析
- テクノロジープロバイダー
- 販売店
- ベンダーマトリクス
- COVID-19が業界のバリューチェーンに与える影響
- 原材料の分析
- 生きている動物のセルライン
- 細胞培地成分
- グルコース
- 規制状況について
- 北米
- 米国
- カナダ
- 欧州
- アジア太平洋地域
- シンガポール
- 中国
- オーストラリア・ニュージーランド
- インド
- 北米
- 業界への影響要因
- 成長の原動力
- 北米
- 動物性製品の代替品としての需要の高まり
- オンラインフードデリバリーの急速な進化が、培養肉の需要を高めている
- 欧州
- 食の安全・健康への貢献度アップ
- アニマルウェルフェアを重視する
- アジア太平洋地域
- 東南アジアの新興国における一人当たりの高い肉消費量と輸入量
- クイックサービスレストランの需要の高さが、培養鶏肉製品の需要を牽引している
- 肉・肉製品消費量の増加
- 北米
- 業界の潜在的リスク&課題
- 厳しい規制環境
- 高いセットアップコスト
- 成長の原動力
- 価格分析
- 養殖牛の価格動向
- 養殖鶏の価格動向
- 養殖魚介類の価格動向
- 養殖豚の価格動向
- 養殖鴨の価格動向
- その他の培養肉価格動向
- コスト構造分析、2022年
- テクノロジー情勢
- イノベーションとサステナビリティ
- 成長性分析、2022年
- 新たなビジネスモデル
- アクイジション
- 製品展開
- 新たなビジネスモデル
- ポーター分析
- PESTEL分析
- COVID-19の培養肉需要への影響(最終用途別
- ハンバーガー
- ナゲッツ
- ミートボール
- ソーセージ
- その他
- 養殖肉認証の概要
- シンガポール
- カタール
- 日本
- カナダ
- 英国
- 国・地域別の登録状況データ
- 特許の情勢
第4章 競合情勢、2022年
- イントロダクション
- 各社の市場シェア、2022年
- 主要市場プレイヤーの競合分析
- 競合のポジショニングマトリックス
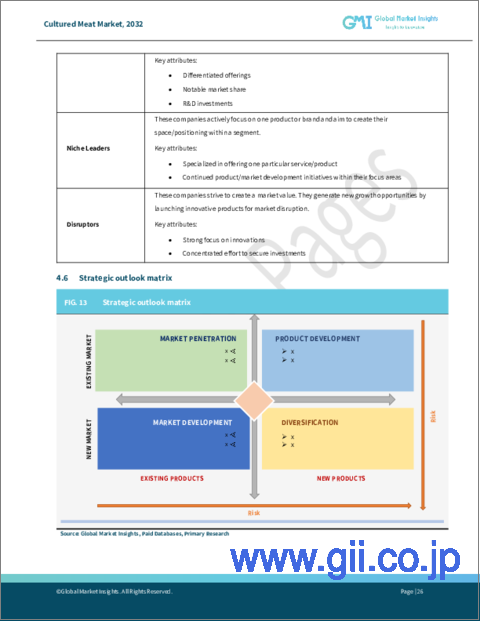
- 戦略的展望マトリクス
第5章 培養肉市場:供給元別
- 主な出典動向
- ビーフ
- 家禽類
- シーフード
- 豚肉
- ダック
- その他
第6章 培養肉市場:用途別
- 主なエンドユーザー動向
- ハンバーガー
- ナゲッツ
- ミートボール
- ソーセージ
- その他
第7章 培養食肉市場:地域別
- 主な地域動向
- 北米
- 米国
- カナダ
- メキシコ
- 欧州
- ドイツ
- 英国
- フランス
- イタリア
- スペイン
- ロシア
- アジア太平洋地域
- 中国
- インド
- 日本
- 韓国
- オーストラリア
- マレーシア
- シンガポール
- ラテンアメリカ
- 6.5.4ブラジル
.7.5.4.1.6.5.4.1ブラジル培養肉市場の推定・予測、2018年~2032年
.7.5.4.2.6.5.4.2ブラジルの培養肉市場の推定・予測(ソース別)、2018年~2032年
.7.5.4.3.6.5.4.3ブラジルの培養肉市場の推定・予測(最終用途別)、2018年~2032年
- MEA
- サウジアラビア
- UAE
- 南アフリカ
- カタール
- イスラエル
第8章 企業プロファイル
- Mosa Meat
- Upside Foods
- Aleph Farms
- Finless Foods
- Meatable
- New Age Meats
- HigherSteaks
- Biofood Systems
- Avant Meats Company Limited
- Balletic Foods
- Future Meat Technologies
- BlueNalu
- Eat Just
- Biotech Foods
- Cell AG Tech
Data Tables
- TABLE 1 Global cultured meat market estimates and forecast, 2016- 2020, (Kilo Tons) (USD Million)
- TABLE 2 Global cultured meat market estimates and forecast, 2021- 2030, (Kilo Tons) (USD Million)
- TABLE 3 Global cultured meat volume estimates & forecast, by region, 2016-2020 (Kilo Tons)
- TABLE 4 Global cultured meat volume estimates & forecast, by region, 2021-2030 (Kilo Tons)
- TABLE 5 Global cultured meat revenue estimates & forecast, by region, 2016- 2020 (USD Million)
- TABLE 6 Global cultured meat volume estimates & forecast, by region, 2021-2030 (USD Million)
- TABLE 7 Global cultured meat volume estimates & forecast, by source, 2016- 2020 (Kilo Tons)
- TABLE 8 Global cultured meat volume estimates & forecast, by source, 2021- 2030 (Kilo Tons)
- TABLE 9 Global cultured meat revenue estimates & forecast, by source, 2016- 2020 (USD Million)
- TABLE 10 Global cultured meat revenue estimates & forecast, by source, 2021- 2030 (USD Million)
- TABLE 11 Global cultured meat volume estimates & forecast, by end-use, 2016- 2020 (Kilo Tons)
- TABLE 12 Global cultured meat volume estimates & forecast, by end-use, 2021- 2030 (Kilo Tons)
- TABLE 13 Global cultured meat revenue estimates & forecast, by end-use, 2016- 2020 (USD Million)
- TABLE 14 Global cultured meat revenue estimates & forecast, by end-use, 2021- 2030 (USD Million)
- TABLE 15 Projections of GDP growth (%) in 2021 & 2022
- TABLE 16 Cultured meat market distribution channel analysis
- TABLE 17 Vendor matrix
- TABLE 18 Cost elements
- TABLE 19 Innovation and Sustainability
- TABLE 20 Strategy dashboard
- TABLE 21 Global beef cultured meat market estimates and forecasts, 2016-2020, (Kilo Tons) (USD Million)
- TABLE 22 Global beef cultured meat market estimates and forecasts, 2021-2030, (Kilo Tons) (USD Million)
- TABLE 23 Global beef cultured meat volume estimates & forecast, by region 2016-2020, (Kilo Tons)
- TABLE 24 Global beef cultured meat volume estimates & forecast, by region 2021-2030, (Kilo Tons)
- TABLE 25 Global beef cultured meat revenue estimates & forecast, by region, 2016-2020, (USD Million)
- TABLE 26 Global beef cultured meat revenue estimates & forecast, by region 2021-2030, (USD Million)
- TABLE 27 Global poultry cultured meat market estimates and forecasts, 2016-2020, (Kilo Tons) (USD Million)
- TABLE 28 Global poultry cultured meat market estimates and forecasts, 2021-2030, (Kilo Tons) (USD Million)
- TABLE 29 Global beef cultured meat volume estimates & forecast, by region 2016-2020, (Kilo Tons)
- TABLE 30 Global poultry cultured meat volume estimates & forecast, by region 2021-2030, (Kilo Tons)
- TABLE 31 Global poultry cultured meat revenue estimates & forecast, by region, 2016-2020, (USD Million)
- TABLE 32 Global poultry cultured meat revenue estimates & forecast, by region 2021-2030, (USD Million)
- TABLE 33 Global seafood cultured meat market estimates and forecasts, 2016-2020, (Kilo Tons) (USD Million)
- TABLE 34 Global seafood cultured meat market estimates and forecasts, 2021-2030, (Kilo Tons) (USD Million)
- TABLE 35 Global seafood cultured meat volume estimates & forecast, by region 2016-2020, (Kilo Tons)
- TABLE 36 Global seafood cultured meat volume estimates & forecast, by region 2021-2030, (Kilo Tons)
- TABLE 37 Global seafood cultured meat revenue estimates & forecast, by region, 2016-2020, (USD Million)
- TABLE 38 Global seafood cultured meat revenue estimates & forecast, by region 2021-2030, (USD Million)
- TABLE 39 Global pork cultured meat market estimates and forecasts, 2016-2020, (Kilo Tons) (USD Million)
- TABLE 40 Global pork cultured meat market estimates and forecasts, 2021-2030, (Kilo Tons) (USD Million)
- TABLE 41 Global pork cultured meat volume estimates & forecast, by region 2016-2020, (Kilo Tons)
- TABLE 42 Global pork cultured meat volume estimates & forecast, by region 2021-2030, (Kilo Tons)
- TABLE 43 Global pork cultured meat revenue estimates & forecast, by region, 2016-2020, (USD Million)
- TABLE 44 Global pork cultured meat revenue estimates & forecast, by region 2021-2030, (USD Million)
- TABLE 45 Global duck cultured meat market estimates and forecasts, 2016-2020, (Kilo Tons) (USD Million)
- TABLE 46 Global duck cultured meat market estimates and forecasts, 2021-2030, (Kilo Tons) (USD Million)
- TABLE 47 Global duck cultured meat volume estimates & forecast, by region 2016-2020, (Kilo Tons)
- TABLE 48 Global duck cultured meat volume estimates & forecast, by region 2021-2030, (Kilo Tons)
- TABLE 49 Global duck cultured meat revenue estimates & forecast, by region, 2016-2020, (USD Million)
- TABLE 50 Global duck cultured meat revenue estimates & forecast, by region 2021-2030, (USD Million)
- TABLE 51 Global others cultured meat market estimates and forecasts, 2016-2020, (Kilo Tons) (USD Million)
- TABLE 52 Global others cultured meat market estimates and forecasts, 2021-2030, (Kilo Tons) (USD Million)
- TABLE 53 Global others cultured meat volume estimates & forecast, by region 2016-2020, (Kilo Tons)
- TABLE 54 Global others cultured meat volume estimates & forecast, by region 2021-2030, (Kilo Tons)
- TABLE 55 Global others cultured meat revenue estimates & forecast, by region, 2016-2020, (USD Million)
- TABLE 56 Global others cultured meat revenue estimates & forecast, by region 2021-2030, (USD Million)
- TABLE 57 Global cultured meat market estimates and forecasts from burgers, 2016-2020, (Kilo Tons) (USD Million)
- TABLE 58 Global cultured meat market estimates and forecasts from burgers, 2021-2030, (Kilo Tons) (USD Million)
- TABLE 59 Global cultured meat market estimates and forecasts from burgers, by region, 2016-2020, (Kilo Tons)
- TABLE 60 Global cultured meat market estimates and forecasts from burgers, by region, 2021-2030, (Kilo Tons)
- TABLE 61 Global cultured meat market estimates and forecasts from burgers, by region, 2016-2020, (USD Million)
- TABLE 62 Global cultured meat market estimates and forecasts from burgers, by region, 2021-2030, (USD Million)
- TABLE 63 Global cultured meat market estimates and forecasts from nuggets, 2016-2020, (Kilo Tons) (USD Million)
- TABLE 64 Global cultured meat market estimates and forecasts from nuggets, 2021-2030, (Kilo Tons) (USD Million)
- TABLE 65 Global cultured meat market estimates and forecasts from nuggets, by region, 2016-2020, (Kilo Tons)
- TABLE 66 Global cultured meat market estimates and forecasts from nuggets, by region, 2021-2030, (Kilo Tons)
- TABLE 67 Global cultured meat market estimates and forecasts from nuggets, by region, 2016-2020, (USD Million)
- TABLE 68 Global cultured meat market estimates and forecasts from nuggets, by region, 2021-2030, (USD Million)
- TABLE 69 Global cultured meat market estimates and forecasts from meatballs, 2016-2020, (Kilo Tons) (USD Million)
- TABLE 70 Global cultured meat market estimates and forecasts from meatballs, 2021-2030, (Kilo Tons) (USD Million)
- TABLE 71 Global cultured meat market estimates and forecasts from meatballs, by region, 2016-2020, (Kilo Tons)
- TABLE 72 Global cultured meat market estimates and forecasts from meatballs, by region, 2021-2030, (Kilo Tons)
- TABLE 73 Global cultured meat market estimates and forecasts from meatballs, by region, 2016-2020, (USD Million)
- TABLE 74 Global cultured meat market estimates and forecasts from meatballs, by region, 2021-2030, (USD Million)
- TABLE 75 Global cultured meat market estimates and forecasts from sausages, 2016-2020, (Kilo Tons) (USD Million)
- TABLE 76 Global cultured meat market estimates and forecasts from sausages, 2021-2030, (Kilo Tons) (USD Million)
- TABLE 77 Global cultured meat market estimates and forecasts from sausages, by region, 2016-2020, (Kilo Tons)
- TABLE 78 Global cultured meat market estimates and forecasts from sausages, by region, 2021-2030, (Kilo Tons)
- TABLE 79 Global cultured meat market estimates and forecasts from sausages, by region, 2016-2020, (USD Million)
- TABLE 80 Global cultured meat market estimates and forecasts from sausages, by region, 2021-2030, (USD Million)
- TABLE 81 Global cultured meat market estimates and forecasts from others, 2016-2020, (Kilo Tons) (USD Million)
- TABLE 82 Global cultured meat market estimates and forecasts from others, 2021-2030, (Kilo Tons) (USD Million)
- TABLE 83 Global cultured meat market estimates and forecasts from others, by region, 2016-2020, (Kilo Tons)
- TABLE 84 Global cultured meat market estimates and forecasts from others, by region, 2021-2030, (Kilo Tons)
- TABLE 85 Global cultured meat market estimates and forecasts from others, by region, 2016-2020, (USD Million)
- TABLE 86 Global cultured meat market estimates and forecasts from others, by region, 2021-2030, (USD Million)
- TABLE 87 North America cultured meat market estimates and forecast, 2016- 2020, (Kilo Tons) (USD Million)
- TABLE 88 North America cultured meat market estimates and forecast, 2021- 2030, (Kilo Tons) (USD Million)
- TABLE 89 North America cultured meat volume estimates & forecast, by source, 2016-2020, (Kilo Tons)
- TABLE 90 North America cultured meat volume estimates & forecast, by source, 2021-2030, (Kilo Tons)
- TABLE 91 North America cultured meat revenue estimates & forecast, by source, 2016-2020, (USD Million)
- TABLE 92 North America cultured meat revenue estimates & forecast, by source, 2021-2030, (USD Million)
- TABLE 93 North America cultured meat volume estimates & forecast, by end-use, 2016-2020, (Kilo Tons)
- TABLE 94 North America cultured meat volume estimates & forecast, by end-use, 2021-2030, (Kilo Tons)
- TABLE 95 North America cultured meat revenue estimates & forecast, by end-use, 2016-2020, (USD Million)
- TABLE 96 North America cultured meat revenue estimates & forecast, by end-use, 2021-2030, (USD Million)
- TABLE 97 U.S. cultured meat market estimates and forecast, 2016- 2020, (Kilo Tons) (USD Million)
- TABLE 98 U.S. cultured meat market estimates and forecast, 2021- 2030, (Kilo Tons) (USD Million)
- TABLE 99 U.S. cultured meat volume estimates & forecast, by source, 2016-2020, (Kilo Tons)
- TABLE 100 U.S. cultured meat volume estimates & forecast, by source, 2021-2030, (Kilo Tons)
- TABLE 101 U.S. cultured meat revenue estimates & forecast, by source, 2016-2020, (USD Million)
- TABLE 102 U.S. cultured meat revenue estimates & forecast, by source, 2021-2030, (USD Million)
- TABLE 103 U.S. cultured meat volume estimates & forecast, by end-use, 2016-2020, (Kilo Tons)
- TABLE 104 U.S. cultured meat volume estimates & forecast, by end-use, 2021-2030, (Kilo Tons)
- TABLE 105 U.S. cultured meat revenue estimates & forecast, by end-use, 2016-2020, (USD Million)
- TABLE 106 U.S. cultured meat revenue estimates & forecast, by end-use, 2021-2030, (USD Million)
- TABLE 107 Canada cultured meat market estimates and forecast, 2016- 2020, (Kilo Tons) (USD Million)
- TABLE 108 Canada cultured meat market estimates and forecast, 2021- 2030, (Kilo Tons) (USD Million)
- TABLE 109 Canada cultured meat volume estimates & forecast, by source, 2016-2020, (Kilo Tons)
- TABLE 110 Canada cultured meat volume estimates & forecast, by source, 2021-2030, (Kilo Tons)
- TABLE 111 Canada cultured meat revenue estimates & forecast, by source, 2016-2020, (USD Million)
- TABLE 112 Canada cultured meat revenue estimates & forecast, by source, 2021-2030, (USD Million)
- TABLE 113 Canada cultured meat volume estimates & forecast, by end-use, 2016-2020, (Kilo Tons)
- TABLE 114 Canada cultured meat volume estimates & forecast, by end-use, 2021-2030, (Kilo Tons)
- TABLE 115 Canada cultured meat revenue estimates & forecast, by end-use, 2016-2020, (USD Million)
- TABLE 116 Canada cultured meat revenue estimates & forecast, by end-use, 2021-2030, (USD Million)
- TABLE 117 Mexico cultured meat market estimates and forecast, 2016- 2020, (Kilo Tons) (USD Million)
- TABLE 118 Mexico cultured meat market estimates and forecast, 2021- 2030, (Kilo Tons) (USD Million)
- TABLE 119 Mexico cultured meat volume estimates & forecast, by source, 2016-2020, (Kilo Tons)
- TABLE 120 Mexico cultured meat volume estimates & forecast, by source, 2021-2030, (Kilo Tons)
- TABLE 121 Mexico cultured meat revenue estimates & forecast, by source, 2016-2020, (USD Million)
- TABLE 122 Mexico cultured meat revenue estimates & forecast, by source, 2021-2030, (USD Million)
- TABLE 123 Mexico cultured meat volume estimates & forecast, by end-use, 2016-2020, (Kilo Tons)
- TABLE 124 Mexico cultured meat volume estimates & forecast, by end-use, 2021-2030, (Kilo Tons)
- TABLE 125 Mexico cultured meat revenue estimates & forecast, by end-use, 2016-2020, (USD Million)
- TABLE 126 Mexico cultured meat revenue estimates & forecast, by end-use, 2021-2030, (USD Million)
- TABLE 127 Europe cultured meat market estimates and forecast, 2016- 2020, (Kilo Tons) (USD Million)
- TABLE 128 Europe cultured meat market estimates and forecast, 2021- 2030, (Kilo Tons) (USD Million)
- TABLE 129 Europe cultured meat volume estimates & forecast, by source, 2016-2020, (Kilo Tons)
- TABLE 130 Europe cultured meat volume estimates & forecast, by source, 2021-2030, (Kilo Tons)
- TABLE 131 Europe cultured meat revenue estimates & forecast, by source, 2016-2020, (USD Million)
- TABLE 132 Europe cultured meat revenue estimates & forecast, by source, 2021-2030, (USD Million)
- TABLE 133 Europe cultured meat volume estimates & forecast, by end-use, 2016-2020, (Kilo Tons)
- TABLE 134 Europe cultured meat volume estimates & forecast, by end-use, 2021-2030, (Kilo Tons)
- TABLE 135 Europe cultured meat revenue estimates & forecast, by end-use, 2016-2020, (USD Million)
- TABLE 136 Europe cultured meat revenue estimates & forecast, by end-use, 2021-2030, (USD Million)
- TABLE 137 Germany cultured meat market estimates and forecast, 2016- 2020, (Kilo Tons) (USD Million)
- TABLE 138 Germany cultured meat market estimates and forecast, 2021- 2030, (Kilo Tons) (USD Million)
- TABLE 139 Germany cultured meat volume estimates & forecast, by source, 2016-2020, (Kilo Tons)
- TABLE 140 Germany cultured meat volume estimates & forecast, by source, 2021-2030, (Kilo Tons)
- TABLE 141 Germany cultured meat revenue estimates & forecast, by source, 2016-2020, (USD Million)
- TABLE 142 Germany cultured meat revenue estimates & forecast, by source, 2021-2030, (USD Million)
- TABLE 143 Germany cultured meat volume estimates & forecast, by end-use, 2016-2020, (Kilo Tons)
- TABLE 144 Germany cultured meat volume estimates & forecast, by end-use, 2021-2030, (Kilo Tons)
- TABLE 145 Germany cultured meat revenue estimates & forecast, by end-use, 2016-2020, (USD Million)
- TABLE 146 Germany cultured meat revenue estimates & forecast, by end-use, 2021-2030, (USD Million)
- TABLE 147 UK cultured meat market estimates and forecast, 2016- 2020, (Kilo Tons) (USD Million)
- TABLE 148 UK cultured meat market estimates and forecast, 2021- 2030, (Kilo Tons) (USD Million)
- TABLE 149 UK cultured meat volume estimates & forecast, by source, 2016-2020, (Kilo Tons)
- TABLE 150 UK cultured meat volume estimates & forecast, by source, 2021-2030, (Kilo Tons)
- TABLE 151 UK cultured meat revenue estimates & forecast, by source, 2016-2020, (USD Million)
- TABLE 152 UK cultured meat revenue estimates & forecast, by source, 2021-2030, (USD Million)
- TABLE 153 UK cultured meat volume estimates & forecast, by end-use, 2016-2020, (Kilo Tons)
- TABLE 154 UK cultured meat volume estimates & forecast, by end-use, 2021-2030, (Kilo Tons)
- TABLE 155 UK cultured meat revenue estimates & forecast, by end-use, 2016-2020, (USD Million)
- TABLE 156 UK cultured meat revenue estimates & forecast, by end-use, 2021-2030, (USD Million)
- TABLE 157 France cultured meat market estimates and forecast, 2016- 2020, (Kilo Tons) (USD Million)
- TABLE 158 France cultured meat market estimates and forecast, 2021- 2030, (Kilo Tons) (USD Million)
- TABLE 159 France cultured meat volume estimates & forecast, by source, 2016-2020, (Kilo Tons)
- TABLE 160 France cultured meat volume estimates & forecast, by source, 2021-2030, (Kilo Tons)
- TABLE 161 France cultured meat revenue estimates & forecast, by source, 2016-2020, (USD Million)
- TABLE 162 France cultured meat revenue estimates & forecast, by source, 2021-2030, (USD Million)
- TABLE 163 France cultured meat volume estimates & forecast, by end-use, 2016-2020, (Kilo Tons)
- TABLE 164 France cultured meat volume estimates & forecast, by end-use, 2021-2030, (Kilo Tons)
- TABLE 165 France cultured meat revenue estimates & forecast, by end-use, 2016-2020, (USD Million)
- TABLE 166 France cultured meat revenue estimates & forecast, by end-use, 2021-2030, (USD Million)
- TABLE 167 Italy cultured meat market estimates and forecast, 2016- 2020, (Kilo Tons) (USD Million)
- TABLE 168 Italy cultured meat market estimates and forecast, 2021- 2030, (Kilo Tons) (USD Million)
- TABLE 169 Italy cultured meat volume estimates & forecast, by source, 2016-2020, (Kilo Tons)
- TABLE 170 Italy cultured meat volume estimates & forecast, by source, 2021-2030, (Kilo Tons)
- TABLE 171 Italy cultured meat revenue estimates & forecast, by source, 2016-2020, (USD Million)
- TABLE 172 Italy cultured meat revenue estimates & forecast, by source, 2021-2030, (USD Million)
- TABLE 173 Italy cultured meat volume estimates & forecast, by end-use, 2016-2020, (Kilo Tons)
- TABLE 174 Italy cultured meat volume estimates & forecast, by end-use, 2021-2030, (Kilo Tons)
- TABLE 175 Italy cultured meat revenue estimates & forecast, by end-use, 2016-2020, (USD Million)
- TABLE 176 Italy cultured meat revenue estimates & forecast, by end-use, 2021-2030, (USD Million)
- TABLE 177 Spain cultured meat market estimates and forecast, 2016- 2020, (Kilo Tons) (USD Million)
- TABLE 178 Spain cultured meat market estimates and forecast, 2021- 2030, (Kilo Tons) (USD Million)
- TABLE 179 Spain cultured meat volume estimates & forecast, by source, 2016-2020, (Kilo Tons)
- TABLE 180 Spain cultured meat volume estimates & forecast, by source, 2021-2030, (Kilo Tons)
- TABLE 181 Spain cultured meat revenue estimates & forecast, by source, 2016-2020, (USD Million)
- TABLE 182 Spain cultured meat revenue estimates & forecast, by source, 2021-2030, (USD Million)
- TABLE 183 Spain cultured meat volume estimates & forecast, by end-use, 2016-2020, (Kilo Tons)
- TABLE 184 Spain cultured meat volume estimates & forecast, by end-use, 2021-2030, (Kilo Tons)
- TABLE 185 Spain cultured meat revenue estimates & forecast, by end-use, 2016-2020, (USD Million)
- TABLE 186 Spain cultured meat revenue estimates & forecast, by end-use, 2021-2030, (USD Million)
- TABLE 187 Russia cultured meat market estimates and forecast, 2016- 2020, (Kilo Tons) (USD Million)
- TABLE 188 Russia cultured meat market estimates and forecast, 2021- 2030, (Kilo Tons) (USD Million)
- TABLE 189 Russia cultured meat volume estimates & forecast, by source, 2016-2020, (Kilo Tons)
- TABLE 190 Russia cultured meat volume estimates & forecast, by source, 2021-2030, (Kilo Tons)
- TABLE 191 Russia cultured meat revenue estimates & forecast, by source, 2016-2020, (USD Million)
- TABLE 192 Russia cultured meat revenue estimates & forecast, by source, 2021-2030, (USD Million)
- TABLE 193 Russia cultured meat volume estimates & forecast, by end-use, 2016-2020, (Kilo Tons)
- TABLE 194 Russia cultured meat volume estimates & forecast, by end-use, 2021-2030, (Kilo Tons)
- TABLE 195 Russia cultured meat revenue estimates & forecast, by end-use, 2016-2020, (USD Million)
- TABLE 196 Russia cultured meat revenue estimates & forecast, by end-use, 2021-2030, (USD Million)
- TABLE 197 Asia Pacific cultured meat market estimates and forecast, 2016- 2020, (Kilo Tons) (USD Million)
- TABLE 198 Asia Pacific cultured meat market estimates and forecast, 2021- 2030, (Kilo Tons) (USD Million)
- TABLE 199 Asia Pacific cultured meat volume estimates & forecast, by source, 2016-2020, (Kilo Tons)
- TABLE 200 Asia Pacific cultured meat volume estimates & forecast, by source, 2021-2030, (Kilo Tons)
- TABLE 201 Asia Pacific cultured meat revenue estimates & forecast, by source, 2016-2020, (USD Million)
- TABLE 202 Asia Pacific cultured meat revenue estimates & forecast, by source, 2021-2030, (USD Million)
- TABLE 203 Asia Pacific cultured meat volume estimates & forecast, by end-use, 2016-2020, (Kilo Tons)
- TABLE 204 Asia Pacific cultured meat volume estimates & forecast, by end-use, 2021-2030, (Kilo Tons)
- TABLE 205 Asia Pacific cultured meat revenue estimates & forecast, by end-use, 2016-2020, (USD Million)
- TABLE 206 Asia Pacific cultured meat revenue estimates & forecast, by end-use, 2021-2030, (USD Million)
- TABLE 207 China cultured meat market estimates and forecast, 2016- 2020, (Kilo Tons) (USD Million)
- TABLE 208 China cultured meat market estimates and forecast, 2021- 2030, (Kilo Tons) (USD Million)
- TABLE 209 China cultured meat volume estimates & forecast, by source, 2016-2020, (Kilo Tons)
- TABLE 210 China cultured meat volume estimates & forecast, by source, 2021-2030, (Kilo Tons)
- TABLE 211 China cultured meat revenue estimates & forecast, by source, 2016-2020, (USD Million)
- TABLE 212 China cultured meat revenue estimates & forecast, by source, 2021-2030, (USD Million)
- TABLE 213 China cultured meat volume estimates & forecast, by end-use, 2016-2020, (Kilo Tons)
- TABLE 214 China cultured meat volume estimates & forecast, by end-use, 2021-2030, (Kilo Tons)
- TABLE 215 China cultured meat revenue estimates & forecast, by end-use, 2016-2020, (USD Million)
- TABLE 216 China cultured meat revenue estimates & forecast, by end-use, 2021-2030, (USD Million)
- TABLE 217 India cultured meat market estimates and forecast, 2016- 2020, (Kilo Tons) (USD Million)
- TABLE 218 India cultured meat market estimates and forecast, 2021- 2030, (Kilo Tons) (USD Million)
- TABLE 219 India cultured meat volume estimates & forecast, by source, 2016-2020, (Kilo Tons)
- TABLE 220 India cultured meat volume estimates & forecast, by source, 2021-2030, (Kilo Tons)
- TABLE 221 India cultured meat revenue estimates & forecast, by source, 2016-2020, (USD Million)
- TABLE 222 India cultured meat revenue estimates & forecast, by source, 2021-2030, (USD Million)
- TABLE 223 India cultured meat volume estimates & forecast, by end-use, 2016-2020, (Kilo Tons)
- TABLE 224 India cultured meat volume estimates & forecast, by end-use, 2021-2030, (Kilo Tons)
- TABLE 225 India cultured meat revenue estimates & forecast, by end-use, 2016-2020, (USD Million)
- TABLE 226 India cultured meat revenue estimates & forecast, by end-use, 2021-2030, (USD Million)
- TABLE 227 Japan cultured meat market estimates and forecast, 2016- 2020, (Kilo Tons) (USD Million)
- TABLE 228 Japan cultured meat market estimates and forecast, 2021- 2030, (Kilo Tons) (USD Million)
- TABLE 229 Japan cultured meat volume estimates & forecast, by source, 2016-2020, (Kilo Tons)
- TABLE 230 Japan cultured meat volume estimates & forecast, by source, 2021-2030, (Kilo Tons)
- TABLE 231 Japan cultured meat revenue estimates & forecast, by source, 2016-2020, (USD Million)
- TABLE 232 Japan cultured meat revenue estimates & forecast, by source, 2021-2030, (USD Million)
- TABLE 233 Japan cultured meat volume estimates & forecast, by end-use, 2016-2020, (Kilo Tons)
- TABLE 234 Japan cultured meat volume estimates & forecast, by end-use, 2021-2030, (Kilo Tons)
- TABLE 235 Japan cultured meat revenue estimates & forecast, by end-use, 2016-2020, (USD Million)
- TABLE 236 Japan cultured meat revenue estimates & forecast, by end-use, 2021-2030, (USD Million)
- TABLE 237 South Korea cultured meat market estimates and forecast, 2016- 2020, (Kilo Tons) (USD Million)
- TABLE 238 South Korea cultured meat market estimates and forecast, 2021- 2030, (Kilo Tons) (USD Million)
- TABLE 239 South Korea cultured meat volume estimates & forecast, by source, 2016-2020, (Kilo Tons)
- TABLE 240 South Korea cultured meat volume estimates & forecast, by source, 2021-2030, (Kilo Tons)
- TABLE 241 South Korea cultured meat revenue estimates & forecast, by source, 2016-2020, (USD Million)
- TABLE 242 South Korea cultured meat revenue estimates & forecast, by source, 2021-2030, (USD Million)
- TABLE 243 South Korea cultured meat volume estimates & forecast, by end-use, 2016-2020, (Kilo Tons)
- TABLE 244 South Korea cultured meat volume estimates & forecast, by end-use, 2021-2030, (Kilo Tons)
- TABLE 245 South Korea cultured meat revenue estimates & forecast, by end-use, 2016-2020, (USD Million)
- TABLE 246 South Korea cultured meat revenue estimates & forecast, by end-use, 2021-2030, (USD Million)
- TABLE 247 Australia cultured meat market estimates and forecast, 2016- 2020, (Kilo Tons) (USD Million)
- TABLE 248 Australia cultured meat market estimates and forecast, 2021- 2030, (Kilo Tons) (USD Million)
- TABLE 249 Australia cultured meat volume estimates & forecast, by source, 2016-2020, (Kilo Tons)
- TABLE 250 Australia cultured meat volume estimates & forecast, by source, 2021-2030, (Kilo Tons)
- TABLE 251 Australia cultured meat revenue estimates & forecast, by source, 2016-2020, (USD Million)
- TABLE 252 Australia cultured meat revenue estimates & forecast, by source, 2021-2030, (USD Million)
- TABLE 253 Australia cultured meat volume estimates & forecast, by end-use, 2016-2020, (Kilo Tons)
- TABLE 254 Australia cultured meat volume estimates & forecast, by end-use, 2021-2030, (Kilo Tons)
- TABLE 255 Australia cultured meat revenue estimates & forecast, by end-use, 2016-2020, (USD Million)
- TABLE 256 Australia cultured meat revenue estimates & forecast, by end-use, 2021-2030, (USD Million)
- TABLE 257 Malaysia cultured meat market estimates and forecast, 2016- 2020, (Kilo Tons) (USD Million)
- TABLE 258 Malaysia cultured meat market estimates and forecast, 2021- 2030, (Kilo Tons) (USD Million)
- TABLE 259 Malaysia cultured meat volume estimates & forecast, by source, 2016-2020, (Kilo Tons)
- TABLE 260 Malaysia cultured meat volume estimates & forecast, by source, 2021-2030, (Kilo Tons)
- TABLE 261 Malaysia cultured meat revenue estimates & forecast, by source, 2016-2020, (USD Million)
- TABLE 262 Malaysia cultured meat revenue estimates & forecast, by source, 2021-2030, (USD Million)
- TABLE 263 Malaysia cultured meat volume estimates & forecast, by end-use, 2016-2020, (Kilo Tons)
- TABLE 264 Malaysia cultured meat volume estimates & forecast, by end-use, 2021-2030, (Kilo Tons)
- TABLE 265 Malaysia cultured meat revenue estimates & forecast, by end-use, 2016-2020, (USD Million)
- TABLE 266 Malaysia cultured meat revenue estimates & forecast, by end-use, 2021-2030, (USD Million)
- TABLE 267 Singapore cultured meat market estimates and forecast, 2016- 2020, (Kilo Tons) (USD Million)
- TABLE 268 Singapore cultured meat market estimates and forecast, 2021- 2030, (Kilo Tons) (USD Million)
- TABLE 269 Singapore cultured meat volume estimates & forecast, by source, 2016-2020, (Kilo Tons)
- TABLE 270 Singapore cultured meat volume estimates & forecast, by source, 2021-2030, (Kilo Tons)
- TABLE 271 Singapore cultured meat revenue estimates & forecast, by source, 2016-2020, (USD Million)
- TABLE 272 Singapore cultured meat revenue estimates & forecast, by source, 2021-2030, (USD Million)
- TABLE 273 Singapore cultured meat volume estimates & forecast, by end-use, 2016-2020, (Kilo Tons)
- TABLE 274 Singapore cultured meat volume estimates & forecast, by end-use, 2021-2030, (Kilo Tons)
- TABLE 275 Malaysia cultured meat revenue estimates & forecast, by end-use, 2016-2020, (USD Million)
- TABLE 276 Singapore cultured meat revenue estimates & forecast, by end-use, 2021-2030, (USD Million)
- TABLE 277 Latin America cultured meat market estimates and forecast, 2016- 2020, (Kilo Tons) (USD Million)
- TABLE 278 Latin America cultured meat market estimates and forecast, 2021- 2030, (Kilo Tons) (USD Million)
- TABLE 279 Latin America cultured meat volume estimates & forecast, by source, 2016-2020, (Kilo Tons)
- TABLE 280 Latin America cultured meat volume estimates & forecast, by source, 2021-2030, (Kilo Tons)
- TABLE 281 Latin America cultured meat revenue estimates & forecast, by source, 2016-2020, (USD Million)
- TABLE 282 Latin America cultured meat revenue estimates & forecast, by source, 2021-2030, (USD Million)
- TABLE 283 Latin America cultured meat volume estimates & forecast, by end-use, 2016-2020, (Kilo Tons)
- TABLE 284 Latin America cultured meat volume estimates & forecast, by end-use, 2021-2030, (Kilo Tons)
- TABLE 285 Latin America cultured meat revenue estimates & forecast, by end-use, 2016-2020, (USD Million)
- TABLE 286 Latin America cultured meat revenue estimates & forecast, by end-use, 2021-2030, (USD Million)
- TABLE 287 Brazil cultured meat market estimates and forecast, 2016- 2020, (Kilo Tons) (USD Million)
- TABLE 288 Brazil cultured meat market estimates and forecast, 2021- 2030, (Kilo Tons) (USD Million)
- TABLE 289 Brazil cultured meat volume estimates & forecast, by source, 2016-2020, (Kilo Tons)
- TABLE 290 Brazil cultured meat volume estimates & forecast, by source, 2021-2030, (Kilo Tons)
- TABLE 291 Brazil cultured meat revenue estimates & forecast, by source, 2016-2020, (USD Million)
- TABLE 292 Brazil cultured meat revenue estimates & forecast, by source, 2021-2030, (USD Million)
- TABLE 293 Brazil cultured meat volume estimates & forecast, by end-use, 2016-2020, (Kilo Tons)
- TABLE 294 Brazil cultured meat volume estimates & forecast, by end-use, 2021-2030, (Kilo Tons)
- TABLE 295 Brazil cultured meat revenue estimates & forecast, by end-use, 2016-2020, (USD Million)
- TABLE 296 Brazil cultured meat revenue estimates & forecast, by end-use, 2021-2030, (USD Million)
- TABLE 297 MEA cultured meat market estimates and forecast, 2016- 2020, (Kilo Tons) (USD Million)
- TABLE 298 MEA cultured meat market estimates and forecast, 2021- 2030, (Kilo Tons) (USD Million)
- TABLE 299 MEA cultured meat volume estimates & forecast, by source, 2016-2020, (Kilo Tons)
- TABLE 300 MEA cultured meat volume estimates & forecast, by source, 2021-2030, (Kilo Tons)
- TABLE 301 MEA cultured meat revenue estimates & forecast, by source, 2016-2020, (USD Million)
- TABLE 302 MEA cultured meat revenue estimates & forecast, by source, 2021-2030, (USD Million)
- TABLE 303 MEA cultured meat volume estimates & forecast, by end-use, 2016-2020, (Kilo Tons)
- TABLE 304 MEA cultured meat volume estimates & forecast, by end-use, 2021-2030, (Kilo Tons)
- TABLE 305 MEA cultured meat revenue estimates & forecast, by end-use, 2016-2020, (USD Million)
- TABLE 306 MEA cultured meat revenue estimates & forecast, by end-use, 2021-2030, (USD Million)
- TABLE 307 Saudi Arabia cultured meat market estimates and forecast, 2016- 2020, (Kilo Tons) (USD Million)
- TABLE 308 Saudi Arabia cultured meat market estimates and forecast, 2021- 2030, (Kilo Tons) (USD Million)
- TABLE 309 Saudi Arabia cultured meat volume estimates & forecast, by source, 2016-2020, (Kilo Tons)
- TABLE 310 Saudi Arabia cultured meat volume estimates & forecast, by source, 2021-2030, (Kilo Tons)
- TABLE 311 Saudi Arabia cultured meat revenue estimates & forecast, by source, 2016-2020, (USD Million)
- TABLE 312 Saudi Arabia cultured meat revenue estimates & forecast, by source, 2021-2030, (USD Million)
- TABLE 313 Saudi Arabia cultured meat volume estimates & forecast, by end-use, 2016-2020, (Kilo Tons)
- TABLE 314 Saudi Arabia cultured meat volume estimates & forecast, by end-use, 2021-2030, (Kilo Tons)
- TABLE 315 Saudi Arabia cultured meat revenue estimates & forecast, by end-use, 2016-2020, (USD Million)
- TABLE 316 Saudi Arabia cultured meat revenue estimates & forecast, by end-use, 2021-2030, (USD Million)
- TABLE 317 UAE cultured meat market estimates and forecast, 2016- 2020, (Kilo Tons) (USD Million)
- TABLE 318 UAE cultured meat market estimates and forecast, 2021- 2030, (Kilo Tons) (USD Million)
- TABLE 319 UAE cultured meat volume estimates & forecast, by source, 2016-2020, (Kilo Tons)
- TABLE 320 UAE cultured meat volume estimates & forecast, by source, 2021-2030, (Kilo Tons)
- TABLE 321 UAE cultured meat revenue estimates & forecast, by source, 2016-2020, (USD Million)
- TABLE 322 UAE cultured meat revenue estimates & forecast, by source, 2021-2030, (USD Million)
- TABLE 323 UAE cultured meat volume estimates & forecast, by end-use, 2016-2020, (Kilo Tons)
- TABLE 324 UAE cultured meat volume estimates & forecast, by end-use, 2021-2030, (Kilo Tons)
- TABLE 325 UAE cultured meat revenue estimates & forecast, by end-use, 2016-2020, (USD Million)
- TABLE 326 UAE cultured meat revenue estimates & forecast, by end-use, 2021-2030, (USD Million)
- TABLE 327 South Africa cultured meat market estimates and forecast, 2016- 2020, (Kilo Tons) (USD Million)
- TABLE 328 South Africa cultured meat market estimates and forecast, 2021- 2030, (Kilo Tons) (USD Million)
- TABLE 329 South Africa cultured meat volume estimates & forecast, by source, 2016-2020, (Kilo Tons)
- TABLE 330 South Africa cultured meat volume estimates & forecast, by source, 2021-2030, (Kilo Tons)
- TABLE 331 South Africa cultured meat revenue estimates & forecast, by source, 2016-2020, (USD Million)
- TABLE 332 South Africa cultured meat revenue estimates & forecast, by source, 2021-2030, (USD Million)
- TABLE 333 South Africa cultured meat volume estimates & forecast, by end-use, 2016-2020, (Kilo Tons)
- TABLE 334 South Africa cultured meat volume estimates & forecast, by end-use, 2021-2030, (Kilo Tons)
- TABLE 335 South Africa cultured meat revenue estimates & forecast, by end-use, 2016-2020, (USD Million)
- TABLE 336 South Africa cultured meat revenue estimates & forecast, by end-use, 2021-2030, (USD Million)
- TABLE 337 Qatar cultured meat market estimates and forecast, 2016- 2020, (Kilo Tons) (USD Million)
- TABLE 338 Qatar cultured meat market estimates and forecast, 2021- 2030, (Kilo Tons) (USD Million)
- TABLE 339 Qatar cultured meat volume estimates & forecast, by source, 2016-2020, (Kilo Tons)
- TABLE 340 Qatar cultured meat volume estimates & forecast, by source, 2021-2030, (Kilo Tons)
- TABLE 341 Qatar cultured meat revenue estimates & forecast, by source, 2016-2020, (USD Million)
- TABLE 342 Qatar cultured meat revenue estimates & forecast, by source, 2021-2030, (USD Million)
- TABLE 343 Qatar cultured meat volume estimates & forecast, by end-use, 2016-2020, (Kilo Tons)
- TABLE 344 Qatar cultured meat volume estimates & forecast, by end-use, 2021-2030, (Kilo Tons)
- TABLE 345 Qatar cultured meat revenue estimates & forecast, by end-use, 2016-2020, (USD Million)
- TABLE 346 Qatar cultured meat revenue estimates & forecast, by end-use, 2021-2030, (USD Million)
- TABLE 347 Israel cultured meat market estimates and forecast, 2016- 2020, (Kilo Tons) (USD Million)
- TABLE 348 Israel cultured meat market estimates and forecast, 2021- 2030, (Kilo Tons) (USD Million)
- TABLE 349 Israel cultured meat volume estimates & forecast, by source, 2016-2020, (Kilo Tons)
- TABLE 350 Israel cultured meat volume estimates & forecast, by source, 2021-2030, (Kilo Tons)
- TABLE 351 Israel cultured meat revenue estimates & forecast, by source, 2016-2020, (USD Million)
- TABLE 352 Israel cultured meat revenue estimates & forecast, by source, 2021-2030, (USD Million)
- TABLE 353 Israel cultured meat volume estimates & forecast, by end-use, 2016-2020, (Kilo Tons)
- TABLE 354 Israel cultured meat volume estimates & forecast, by end-use, 2021-2030, (Kilo Tons)
- TABLE 355 Israel cultured meat revenue estimates & forecast, by end-use, 2016-2020, (USD Million)
- TABLE 356 Israel cultured meat revenue estimates & forecast, by end-use, 2021-2030, (USD Million)
Charts & Figures
- FIG. 1 Cultured meat market share forecast, by region, 2025 (% share)
- FIG. 2 Global cultured meat 360 degree synopsis
- FIG. 3 Global chicken meat production, 2015 - 2020 (Million tons)
- FIG. 4 U.S. Per Capita Consumption of Poultry and Livestock, 2019 - 2021 (Kilos)
- FIG. 5 Market size of the burger restaurant sector in the U.S. (2016 to 2020) (USD Billion)
- FIG. 6 Industry segmentation
- FIG. 7 Industry ecosystem analysis
- FIG. 8 Amount of cultured meat expected to be produced by 2021 (Kgs)
- FIG. 9 Cell culture market size globally, 2014-2022 (USD million)
- FIG. 10 Global consumption of protein products (Million MT), 2020
- FIG. 11 U.S. meat product consumption (Thousand Tones) (2020)
- FIG. 12 Breakdown of program expenditure in Europe (USD Million) (2020)
- FIG. 13 Europe rural government expenditure on animal welfare (2014 - 2020)
- FIG. 14 China meat consumption, (2015-2024) (Thousand Tons)
- FIG. 15 India meat consumption, (2015-2024) (Thousand Tons)
- FIG. 16 The global restaurant industry size, by country (USD Billion) (2019)
- FIG. 17 Chicken meat production volume in Asia Pacific, by country (Thousand Tones) (2019)
- FIG. 18 Meat consumption in Asia Pacific (Thousand Tones) (2020)
- FIG. 19 Asia Pacific meat consumption in major countries, by percentage (2020)
- FIG. 20 Cost structure analysis, 2020
- FIG. 21 Cultured meat production process
- FIG. 22 Growth potential analysis, 2020
- FIG. 23 Porter's Analysis
- FIG. 24 PESTEL Analysis
- FIG. 25 SWOT Analysis, Mosa Meat
- FIG. 26 SWOT Analysis, Upside Foods
- FIG. 27 SWOT Analysis, Aleph Farms
- FIG. 28 SWOT Analysis, Finless Foods
- FIG. 29 SWOT Analysis, Meatable
- FIG. 30 SWOT Analysis, New Age Meats
- FIG. 31 SWOT Analysis, HigherSteaks
- FIG. 32 SWOT Analysis, Biofood Systems
- FIG. 33 SWOT Analysis, Avant Meats Company Limited
- FIG. 34 SWOT Analysis, Balletic Foods
- FIG. 35 SWOT Analysis, Future Meat Technologies
- FIG. 36 SWOT Analysis, BlueNalu
- FIG. 37 SWOT Analysis, Eat Just
- FIG. 38 SWOT Analysis, Biotech Foods
- FIG. 39 SWOT Analysis, Cell AG Tech
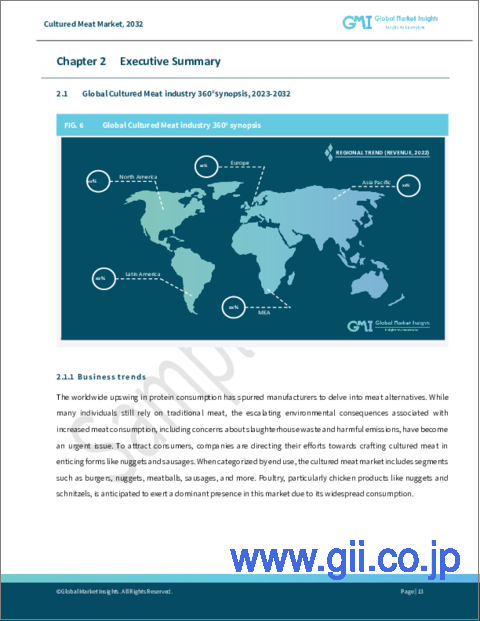
Cultured Meat Market is estimated to grow substantially through 2032, owing to the rising awareness regarding food safety and health benefits. In addition, the growing demand for animal-based product substitutes will also positively impact the industry growth in the coming years. Less contamination, fewer antibiotics, and reduced environmental impact are some of the key benefits slated to boost the product adoption.
An upsurge in animal protein or alternate protein consumption would further add to the market curve during 2023-2032. According to reports, in 2020, approximately thirteen million metric tons of alternative proteins were globally consumed. Besides, the high demand for quick-service restaurants, as they serve food items that require minimal preparation time and are delivered quickly, is likely to impel the product consumption.
Key players in the market are engaging in strategic initiatives such as mergers and acquisitions, partnerships, R&D investments, and new product launches to gain a competitive edge in the overall industry. To cite an instance, in February 2021, Mosa Meat announced concluding its Series B funding of $85 million. The raised capital was apparently used to expand the company's existing pilot production facility at its home in Maastricht.
Overall, the cultured meat industry is segmented in terms of source, end-use, and region.
Based on source, the beef segment is expected to be valued at USD 3.4 billion by 2032, owing to the rising consumption and demand for beef. According to reliable reports, the global intake of beef in 2020 was approximately 130 billion pounds, with the United States accounting for 21% of the meat consumption. Moreover, the ongoing issues regarding the supply-demand gap, that can be overcome due to cultured beef could stimulate the segmental growth over the next ten years.
By end-use, the sausages segment is expected to exhibit over 154.5% CAGR from 2023-2032. The rising demand for farm-free fast foods that contain some flavor of traditional meat is anticipated to spur the demand for sausages. In addition, several leading industries are seeking ways to replace conventional farming with shiny, clean aluminum bioreactors that stir out drumsticks, tasty steaks, and flour, which will further aid the industry in expanding in the foreseeable future.
Regionally, the Europe cultured meat market is anticipated to garner potential gains by 2032 end. The regional market growth can be attributed to the rising demand for alternative proteins and increasing consumer awareness of healthy eating and staying fit following the COVID-19 outbreak. In addition, nutrition, safety, and sustainability are the key benefits offered by the alternative protein that will boost its adoption in the region in the coming years.
Table of Contents
Chapter 1 Methodology & Scope
- 1.1 Methodology
- 1.2 Market definitions
- 1.3 Market estimation & forecast parameters
- 1.3.1 Base estimates & working
- 1.3.1.1 North America
- 1.3.1.2 Europe
- 1.3.1.3 Asia Pacific
- 1.3.1.4 Latin America (LATAM)
- 1.3.1.5 Middle East, & Africa (MEA)
- 1.3.2 Forecast calculations
- 1.3.2.1 COVID-19 impact calculations on industry forecast
- 1.3.1 Base estimates & working
- 1.4 Data sources
- 1.4.1 Primary
- 1.4.2 Secondary
- 1.4.2.1 Paid Sources
- 1.4.2.2 Public Sources
Chapter 2 Executive Summary
- 2.1 Cultured meat industry 360 degree synopsis, 2018 - 2032
- 2.1.1 Business trends
- 2.1.2 Source trends
- 2.1.3 End-Use trends
- 2.1.4 Regional trends
Chapter 3 Cultured meat Industry Insights
- 3.1 Industry segmentation
- 3.2 Industry size and forecast, 2018 - 2032
- 3.2.1 COVID-19 impact on industry landscape
- 3.3 Industry ecosystem analysis
- 3.3.1 Raw material suppliers
- 3.3.2 Manufacturers
- 3.3.3 Distribution chain analysis
- 3.3.3.1 Technology Providers
- 3.3.3.2 Distributors
- 3.3.4 Vendor matrix
- 3.3.5 Impact of COVID-19 on the industry value chain
- 3.4 Raw Material Analysis
- 3.4.1 Cell lines of living animals
- 3.4.2 Cell media components
- 3.4.3 Glucose
- 3.5 Regulatory Landscape
- 3.5.1 North America
- 3.5.1.1 U.S.
- 3.5.1.2 Canada
- 3.5.2 Europe
- 3.5.3 Asia Pacific
- 3.5.3.1 Singapore
- 3.5.3.2 China
- 3.5.3.3 Australia and New Zealand
- 3.5.3.4 India
- 3.5.1 North America
- 3.6 Industry impact forces
- 3.6.1 Growth Drivers
- 3.6.1.1 North America
- 3.6.1.1.1 Growing demand for the alternatives of animal-based products
- 3.6.1.1.2 Rapid evolution of online food delivery is uplifting the demand for cultured meat
- 3.6.1.2 Europe
- 3.6.1.2.1 Enhanced food safety and health benefits
- 3.6.1.2.2 Focus on animal welfare
- 3.6.1.3 Asia Pacific
- 3.6.1.3.1 High per capita meat consumption and imports in the emerging Southeast Asian economies
- 3.6.1.3.2 High demand for quick-service restaurants is driving the demand for cultured poultry meat products
- 3.6.1.3.3 Rising meat and meat products consumption
- 3.6.1.1 North America
- 3.6.2 Industry pitfalls & Challenges
- 3.6.2.1 Stringent regulatory environment
- 3.6.2.2 High Set up cost
- 3.6.1 Growth Drivers
- 3.7 Pricing Analysis
- 3.7.1 Cultured beef price trends
- 3.7.2 Cultured poultry price trends
- 3.7.3 Cultured seafood price trends
- 3.7.4 Cultured pork price trends
- 3.7.5 Cultured duck price trends
- 3.7.6 Other cultured meat price trends
- 3.7.7 Cost structure analysis, 2022
- 3.8 Technology landscape
- 3.9 Innovation & sustainability
- 3.10 Growth potential analysis, 2022
- 3.10.1 Emerging business model
- 3.10.1.1 Acquisitions
- 3.10.1.2 Product Expansion
- 3.10.1 Emerging business model
- 3.11 Porter's analysis
- 3.11.1 Bargaining power of suppliers
- 3.11.2 Bargaining power of buyers
- 3.11.3 3.11.3 Threat of new entrants
- 3.11.4 Threat of substitutes
- 3.12 PESTEL analysis
- 3.13 Impact of COVID-19 on cultured meat demand, by end-use
- 3.13.1 Burgers
- 3.13.2 Nuggets
- 3.13.3 Meatballs
- 3.13.4 Sausages
- 3.13.5 Others
- 3.14 Overview of certification of cultured meat
- 3.14.1 Singapore
- 3.14.2 Qatar
- 3.14.3 Japan
- 3.14.4 Canada
- 3.14.5 UK
- 3.14.6 Data on registration status different part of country/ Region
- 3.15 Patent Landscape
Chapter 4 Competitive Landscape, 2022
- 4.1 Introduction
- 4.2 Company market share, 2022
- 4.3 Competitive analysis of major market players
- 4.4 Competitive positioning matrix
- 4.5 Strategic outlook matrix
Chapter 5 Cultured Meat Market, By Source
- 5.1 Key source trends
- 5.2 Beef
- 5.2.1 Global beef cultured meat market estimates and forecasts, 2018-2032, (Kilo Tons) (USD Million)
- 5.2.2 Global beef cultured meat market estimates and forecasts, by region, 2018-2032 (Kilo Tons) (USD Million)
- 5.3 Poultry
- 5.3.1 Global poultry cultured meat market estimates and forecasts, 2018-2032, (Kilo Tons) (USD Million)
- 5.3.2 Global poultry cultured meat market estimates and forecasts, by region, 2018-2032 (Kilo Tons) (USD Million)
- 5.4 Seafood
- 5.4.1 Global seafood cultured meat market estimates and forecasts, 2018-2032, (Kilo Tons) (USD Million)
- 5.4.2 Global seafood cultured meat market estimates and forecasts, by region, 2018-2032 (Kilo Tons) (USD Million)
- 5.5 Pork
- 5.5.1 Global pork cultured meat market estimates and forecasts, 2018-2032, (Kilo Tons) (USD Million)
- 5.5.2 Global pork cultured meat market estimates and forecasts, by region, 2018-2032 (Kilo Tons) (USD Million)
- 5.6 Duck
- 5.6.1 Global duck cultured meat market estimates and forecasts, 2018-2032, (Kilo Tons) (USD Million)
- 5.6.2 Global duck cultured meat market estimates and forecasts, by region, 2018-2032 (Kilo Tons) (USD Million)
- 5.7 Others
- 5.7.1 Global others cultured meat market estimates and forecasts, 2018-2032, (Kilo Tons) (USD Million)
- 5.7.2 Global others cultured meat market estimates and forecasts, by region, 2018-2032 (Kilo Tons) (USD Million)
Chapter 6 Cultured Meat Market, By End-use
- 6.1 Key end-use trends
- 6.1.1 Burgers
- 6.1.2 Global cultured meat market estimates and forecasts from burgers, 2018-2032, (Kilo Tons) (USD Million)
- 6.1.3 Global cultured meat market estimates and forecasts from burgers, by region, 2018-2032, (Kilo Tons) (USD Million)
- 6.2 Nuggets
- 6.2.1 Global cultured meat market estimates and forecasts from nuggets, 2018-2032, (Kilo Tons) (USD Million)
- 6.2.2 Global cultured meat market estimates and forecasts from nuggets, by region, 2018-2032, (Kilo Tons) (USD Million)
- 6.3 Meatballs
- 6.3.1 Global cultured meat market estimates and forecasts from meatballs, 2018-2032, (Kilo Tons) (USD Million)
- 6.3.2 Global cultured meat market estimates and forecasts from meatballs, by region, 2018-2032, (Kilo Tons) (USD Million)
- 6.4 Sausages
- 6.4.1 Global cultured meat market estimates and forecasts from sausages, 2018-2032, (Kilo Tons) (USD Million)
- 6.4.2 Global cultured meat market estimates and forecasts from sausages, by region, 2018-2032, (Kilo Tons) (USD Million)
- 6.5 Others
- 6.5.1 Global cultured meat market estimates and forecasts from others, 2018-2032, (Kilo Tons) (USD Million)
- 6.5.2 Global cultured meat market estimates and forecasts from others, by region, 2018-2032, (Kilo Tons) (USD Million)
Chapter 7 Cultured Meat Market, By Region
- 7.1 Key regional trends
- 7.2 North America
- 7.2.1 North America cultured meat market estimates and forecast, 2018-2032, (Kilo Tons) (USD Million)
- 7.2.2 North America cultured meat market estimates and forecast, by source, 2018-2032, (Kilo Tons) (USD Million)
- 7.2.3 North America cultured meat market estimates and forecast, by end-use, 2018-2032, (Kilo Tons) (USD Million)
- 7.2.4 U.S.
- 7.2.4.1 U.S. cultured meat market estimates and forecast, 2018-2032, (Kilo Tons) (USD Million)
- 7.2.4.2 U.S. cultured meat market estimates and forecast, by source, 2018-2032, (Kilo Tons) (USD Million)
- 7.2.4.3 U.S. cultured meat market estimates and forecast, by end-use, 2018-2032, (Kilo Tons) (USD Million)
- 7.2.5 Canada
- 7.2.5.1 Canada cultured meat market estimates and forecast, 2018-2032, (Kilo Tons) (USD Million)
- 7.2.5.2 Canada cultured meat market estimates and forecast, by source, 2018-2032, (Kilo Tons) (USD Million)
- 7.2.5.3 Canada cultured meat market estimates and forecast, by end-use, 2018-2032, (Kilo Tons) (USD Million)
- 7.2.6 Mexico
- 7.2.6.1 Mexico cultured meat market estimates and forecast, 2018-2032, (Kilo Tons) (USD Million)
- 7.2.6.2 Mexico cultured meat market estimates and forecast, by source, 2018-2032, (Kilo Tons) (USD Million)
- 7.2.6.3 Mexico cultured meat market estimates and forecast, by end-use, 2018-2032, (Kilo Tons) (USD Million)
- 7.3 Europe
- 7.3.1 Europe cultured meat market estimates and forecast, 2018-2032, (Kilo Tons) (USD Million)
- 7.3.2 Europe cultured meat market estimates and forecast, by source, 2018-2032, (Kilo Tons) (USD Million)
- 7.3.3 Europe cultured meat market estimates and forecast, by end-use, 2018-2032, (Kilo Tons) (USD Million)
- 7.3.4 Germany
- 7.3.4.1 Germany cultured meat market estimates and forecast, 2018-2032, (Kilo Tons) (USD Million)
- 7.3.4.2 Germany cultured meat market estimates and forecast, by source, 2018-2032, (Kilo Tons) (USD Million)
- 7.3.4.3 Germany cultured meat market estimates and forecast, by end-use, 2018-2032, (Kilo Tons) (USD Million)
- 7.3.5 UK
- 7.3.5.1 UK cultured meat market estimates and forecast, 2018-2032, (Kilo Tons) (USD Million)
- 7.3.5.2 UK cultured meat market estimates and forecast, by source, 2018-2032, (Kilo Tons) (USD Million)
- 7.3.5.3 UK cultured meat market estimates and forecast, by end-use, 2018-2032, (Kilo Tons) (USD Million)
- 7.3.6 France
- 7.3.6.1 France cultured meat market estimates and forecast, 2018-2032, (Kilo Tons) (USD Million)
- 7.3.6.2 France cultured meat market estimates and forecast, by source, 2018-2032, (Kilo Tons) (USD Million)
- 7.3.6.3 France cultured meat market estimates and forecast, by end-use, 2018-2032, (Kilo Tons) (USD Million)
- 7.3.7 Italy
- 7.3.7.1 Italy cultured meat market estimates and forecast, 2018-2032, (Kilo Tons) (USD Million)
- 7.3.7.2 Italy cultured meat market estimates and forecast, by source, 2018-2032, (Kilo Tons) (USD Million)
- 7.3.7.3 Italy cultured meat market estimates and forecast, by end-use, 2018-2032, (Kilo Tons) (USD Million)
- 7.3.8 Spain
- 7.3.8.1 Spain cultured meat market estimates and forecast, 2018-2032, (Kilo Tons) (USD Million)
- 7.3.8.2 Spain cultured meat market estimates and forecast, by source, 2018-2032, (Kilo Tons) (USD Million)
- 7.3.8.3 Spain cultured meat market estimates and forecast, by end-use, 2018-2032, (Kilo Tons) (USD Million)
- 7.3.9 Russia
- 7.3.9.1 Russia cultured meat market estimates and forecast, 2018-2032, (Kilo Tons) (USD Million)
- 7.3.9.2 Russia cultured meat market estimates and forecast, by source, 2018-2032, (Kilo Tons) (USD Million)
- 7.3.9.3 Russia cultured meat market estimates and forecast, by end-use, 2018-2032, (Kilo Tons) (USD Million)
- 7.4 Asia Pacific
- 7.4.1 Asia Pacific cultured meat market estimates and forecast, 2018-2032, (Kilo Tons) (USD Million)
- 7.4.2 Asia Pacific cultured meat market estimates and forecast, by source, 2018-2032, (Kilo Tons) (USD Million)
- 7.4.3 Asia Pacific cultured meat market estimates and forecast, by end-use, 2018-2032, (Kilo Tons) (USD Million)
- 7.4.4 China
- 7.4.4.1 China cultured meat market estimates and forecast, 2018-2032, (Kilo Tons) (USD Million)
- 7.4.4.2 China cultured meat market estimates and forecast, by source, 2018-2032, (Kilo Tons) (USD Million)
- 7.4.4.3 China cultured meat market estimates and forecast, by end-use, 2018-2032, (Kilo Tons) (USD Million)
- 7.4.5 India
- 7.4.5.1 India cultured meat market estimates and forecast, 2018-2032, (Kilo Tons) (USD Million)
- 7.4.5.2 India cultured meat market estimates and forecast, by source, 2018-2032, (Kilo Tons) (USD Million)
- 7.4.5.3 India cultured meat market estimates and forecast, by end-use, 2018-2032, (Kilo Tons) (USD Million)
- 7.4.6 Japan
- 7.4.6.1 Japan cultured meat market estimates and forecast, 2018-2032, (Kilo Tons) (USD Million)
- 7.4.6.2 Japan cultured meat market estimates and forecast, by source, 2018-2032, (Kilo Tons) (USD Million)
- 7.4.6.3 Japan cultured meat market estimates and forecast, by end-use, 2018-2032, (Kilo Tons) (USD Million)
- 7.4.7 South Korea
- 7.4.7.1 South Korea cultured meat market estimates and forecast, 2018-2032, (Kilo Tons) (USD Million)
- 7.4.7.2 South Korea cultured meat market estimates and forecast, by source, 2018-2032, (Kilo Tons) (USD Million)
- 7.4.7.3 South Korea cultured meat market estimates and forecast, by end-use, 2018-2032, (Kilo Tons) (USD Million)
- 7.4.8 Australia
- 7.4.8.1 Australia cultured meat market estimates and forecast, 2018-2032, (Kilo Tons) (USD Million)
- 7.4.8.2 Australia cultured meat market estimates and forecast, by source, 2018-2032, (Kilo Tons) (USD Million)
- 7.4.8.3 Australia cultured meat market estimates and forecast, by end-use, 2018-2032, (Kilo Tons) (USD Million)
- 7.4.9 Malaysia
- 7.4.9.1 Malaysia cultured meat market estimates and forecast, 2018-2032, (Kilo Tons) (USD Million)
- 7.4.9.2 Malaysia cultured meat market estimates and forecast, by source, 2018-2032, (Kilo Tons) (USD Million)
- 7.4.9.3 Malaysia cultured meat market estimates and forecast, by end-use, 2018-2032, (Kilo Tons) (USD Million)
- 7.4.10 Singapore
- 7.4.10.1 Singapore cultured meat market estimates and forecast, 2018-2032, (Kilo Tons) (USD Million)
- 7.4.10.2 Singapore cultured meat market estimates and forecast, by source, 2018-2032, (Kilo Tons) (USD Million)
- 7.4.10.3 Singapore cultured meat market estimates and forecast, by end-use, 2018-2032, (Kilo Tons) (USD Million)
- 7.5 Latin America
- 7.5.1 6.5.1 Latin America cultured meat market estimates and forecast, 2018-2032, (Kilo Tons) (USD Million)
- 7.5.2 6.5.2 Latin America cultured meat market estimates and forecast, by source, 2018-2032, (Kilo Tons) (USD Million)
- 7.5.3 6.5.3 Latin America cultured meat market estimates and forecast, by end-use, 2018-2032, (Kilo Tons) (USD Million)
- 7.5.4 6.5.4 Brazil
.7.5.4.1. 6.5.4.1 Brazil cultured meat market estimates and forecast, 2018-2032, (Kilo Tons) (USD Million)
.7.5.4.2. 6.5.4.2 Brazil cultured meat market estimates and forecast, by source, 2018-2032, (Kilo Tons) (USD Million)
.7.5.4.3. 6.5.4.3 Brazil cultured meat market estimates and forecast, by end-use, 2018-2032, (Kilo Tons) (USD Million)
- 7.6 MEA
- 7.6.1 MEA cultured meat market estimates and forecast, 2018-2032, (Kilo Tons) (USD Million)
- 7.6.2 MEA cultured meat market estimates and forecast, by source, 2018-2032, (Kilo Tons) (USD Million)
- 7.6.3 MEA cultured meat market estimates and forecast, by end-use, 2018-2032, (Kilo Tons) (USD Million)
- 7.6.4 Saudi Arabia
- 7.6.4.1 Saudi Arabia cultured meat market estimates and forecast, 2018-2032, (Kilo Tons) (USD Million)
- 7.6.4.2 Saudi Arabia cultured meat market estimates and forecast, by source, 2018-2032, (Kilo Tons) (USD Million)
- 7.6.4.3 Saudi Arabia cultured meat market estimates and forecast, by end-use, 2018-2032, (Kilo Tons) (USD Million)
- 7.6.5 UAE
- 7.6.5.1 UAE cultured meat market estimates and forecast, 2018-2032, (Kilo Tons) (USD Million)
- 7.6.5.2 UAE cultured meat market estimates and forecast, by source, 2018-2032, (Kilo Tons) (USD Million)
- 7.6.5.3 UAE cultured meat market estimates and forecast, by end-use, 2018-2032, (Kilo Tons) (USD Million)
- 7.6.6 South Africa
- 7.6.6.1 South Africa cultured meat market estimates and forecast, 2018-2032, (Kilo Tons) (USD Million)
- 7.6.6.2 South Africa cultured meat market estimates and forecast, by source, 2018-2032, (Kilo Tons) (USD Million)
- 7.6.6.3 South Africa cultured meat market estimates and forecast, by end-use, 2018-2032, (Kilo Tons) (USD Million)
- 7.6.7 Qatar
- 7.6.7.1 Qatar cultured meat market estimates and forecast, 2018-2032, (Kilo Tons) (USD Million)
- 7.6.7.2 Qatar cultured meat market estimates and forecast, by source, 2018-2032, (Kilo Tons) (USD Million)
- 7.6.7.3 Qatar cultured meat market estimates and forecast, by end-use, 2018-2032, (Kilo Tons) (USD Million)
- 7.6.8 Israel
- 7.6.8.1 Israel cultured meat market estimates and forecast, 2018-2032, (Kilo Tons) (USD Million)
- 7.6.8.2 Israel cultured meat market estimates and forecast, by source, 2018-2032, (Kilo Tons) (USD Million)
- 7.6.8.3 Israel cultured meat market estimates and forecast, by end-use, 2018-2032, (Kilo Tons) (USD Million)
Chapter 8 Company Profile
- 8.1 Mosa Meat
- 8.1.1 Business Overview
- 8.1.2 Financial Data
- 8.1.3 Product Landscape
- 8.1.4 SWOT Analysis
- 8.1.5 Strategic Outlook
- 8.2 Upside Foods
- 8.2.1 Business Overview
- 8.2.2 Financial Data
- 8.2.3 Product Landscape
- 8.2.4 SWOT Analysis
- 8.2.5 Strategic Outlook
- 8.3 Aleph Farms
- 8.3.1 Business Overview
- 8.3.2 Financial Data
- 8.3.3 Product Landscape
- 8.3.4 SWOT Analysis
- 8.3.5 Strategic Outlook
- 8.4 Finless Foods
- 8.4.1 Business Overview
- 8.4.2 Product Landscape
- 8.4.3 SWOT Analysis
- 8.4.4 Strategic Outlook
- 8.5 Meatable
- 8.5.1 Business Overview
- 8.5.2 Financial Data
- 8.5.3 Product Landscape
- 8.5.4 SWOT Analysis
- 8.5.5 Strategic Outlook
- 8.6 New Age Meats
- 8.6.1 Business Overview
- 8.6.2 Financial Data
- 8.6.3 Product Landscape
- 8.6.4 SWOT Analysis
- 8.6.5 Strategic Outlook
- 8.7 HigherSteaks
- 8.7.1 Business Overview
- 8.7.2 Financial Data
- 8.7.3 Product Landscape
- 8.7.4 Swot Analysis
- 8.7.5 Strategic Outlook
- 8.8 Biofood Systems
- 8.8.1 Business Overview
- 8.8.2 Financial Data
- 8.8.3 Product Landscape
- 8.8.4 SWOT Analysis
- 8.9 Avant Meats Company Limited
- 8.9.1 Business Overview
- 8.9.2 Financial Data
- 8.9.3 Product Landscape
- 8.9.4 SWOT Analysis
- 8.9.5 Strategic Outlook
- 8.10 Balletic Foods
- 8.10.1 Business Overview
- 8.10.2 Financial Data
- 8.10.3 Product Landscape
- 8.10.4 SWOT Analysis
- 8.11 Future Meat Technologies
- 8.11.1 Business Overview
- 8.11.2 Financial Data
- 8.11.3 Product Landscape
- 8.11.4 SWOT Analysis
- 8.11.5 Strategic Outlook
- 8.12 BlueNalu
- 8.12.1 Business Overview
- 8.12.2 Financial Data
- 8.12.3 Product Landscape
- 8.12.4 SWOT Analysis
- 8.12.5 Strategic Outlook
- 8.13 Eat Just
- 8.13.1 Business Overview
- 8.13.2 Financial Data
- 8.13.3 Product Landscape
- 8.13.4 SWOT Analysis
- 8.13.5 Strategic Outlook
- 8.14 Biotech Foods
- 8.14.1 Business Overview
- 8.14.2 Financial Data
- 8.14.3 Product Landscape
- 8.14.4 SWOT Analysis
- 8.14.5 Strategic Outlook
- 8.15 Cell AG Tech
- 8.15.1 Business Overview
- 8.15.2 Financial Data
- 8.15.3 Product Landscape
- 8.15.4 SWOT Analysis