|
|
市場調査レポート
商品コード
1399734
抹茶市場規模 - 生産技術別、グレード別、用途別、予測、2023年~2032年Matcha Market Size - By Production Technology (Pan Fried, Steamed), By Grade (Ceremonial, Classic, Culinary), By Application (Regular Tea, Matcha Beverages, Food, Personal Care & Cosmetics) & Forecast, 2023 - 2032 |
||||||
|
|
|||||||
カスタマイズ可能
|
|||||||


| 抹茶市場規模 - 生産技術別、グレード別、用途別、予測、2023年~2032年 |
|
出版日: 2023年10月09日
発行: Global Market Insights Inc.
ページ情報: 英文 240 Pages
納期: 2~3営業日
|

- 全表示
- 概要
- 図表
- 目次
抹茶の世界市場シェアは、抹茶の多様な効能を明らかにする調査の増加に後押しされ、2023年から2032年にかけてCAGR8%超を記録すると思われます。
研究では、抹茶の強力な抗酸化作用、代謝促進作用、L-テアニンによる鎮静作用が強調されています。
例えば、2023年10月には、緑茶、紅茶、抹茶ラテを摂取することで、SARS-CoV-2ウイルスのオミクロン亜種を不活性化できる可能性があると発表されました。日本の科学者たちは、これらのお茶に含まれる化合物がウイルスのスパイクタンパク質に結合し、細胞感染を阻害することを発見しました。さらに、緑茶や紅茶を使った甘いお菓子は、口や消化器官のウイルス量を減らす可能性があります。これらの発見は、これらのお茶を摂取することのもう一つの健康上の利点を強調しています。
体重管理を助け、精神を明晰にし、全体的な健康をサポートする抹茶の可能性が明らかになるにつれ、消費者の関心も高まっています。このような研究の進展により、抹茶は注目のスーパーフードとして位置づけられ、健康志向の人々が抹茶のさまざまな効能を求めることで市場の成長が促され、抹茶の人気と市場需要の上昇に寄与しています。
蒸し部門は2023年から2032年にかけて大きく発展します。緑茶の茶葉を入念に蒸すこの伝統的な製法は、茶葉の天然特性を保ち、高品質の抹茶を生み出します。蒸し製法は、鮮やかな色合い、風味の向上、栄養素の保持量の増加を保証し、抹茶の魅力を高める。消費者は、優れた味わいと健康効果を持つ高級抹茶を生産できるこの細心の技術を優先しています。蒸し製法が注目されるにつれ、最高品質の抹茶製品に対する需要の高まりに対応し、市場の成長を促す重要な要因となっています。
抹茶飲料分野の抹茶市場規模は、2023年から2032年にかけて顕著なCAGRを記録すると思われます。豊富な抗酸化物質と独特の風味で知られる抹茶は、様々な飲料の主要成分として役立っています。伝統的な儀式用のお茶から現代的なラテコンチョクションやエナジードリンクまで、抹茶の多用途性はその無数の利点を求める健康志向の消費者にアピールしています。多様な飲料処方における抹茶の存在は、機能的で風味豊かな飲料を求める消費者の嗜好の進化と合致して市場の成長を促進し、抹茶を飲料業界で求められる原料に押し上げました。
欧州の抹茶産業は2023年から2032年にかけて顕著なCAGRを示すと思われます。抹茶の人気の高まりは、抗酸化物質が豊富な性質と多目的な料理用途に由来します。健康志向の消費者が天然で機能的な食材を求める中、抹茶はお茶、デザート、さらには風味調味料にも使われるようになり、人気を博しています。この需要は、ウェルネス動向とグルメ体験を受け入れている欧州市場を反映しており、抹茶消費の着実な成長を促し、この地域の料理風景と健康志向の嗜好における抹茶の重要性を強調しています。
目次
第1章 調査手法と調査範囲
第2章 エグゼクティブサマリー
第3章 抹茶業界考察
- エコシステム分析
- 原料サプライヤー
- 製造業者
- 利益率分析
- 流通チャネル分析
- エンドユーザー
- ベンダーマトリックス
- 主要原材料サプライヤーリスト
- 主要メーカー/サプライヤーのリスト
- 主要/潜在顧客リスト
- 技術情勢
- 規制状況
- 業界への影響要因
- 促進要因
- 北米:包装食品業界における抹茶の利用拡大
- 欧州:化粧品やパーソナルケア製品における抹茶の使用量の増加
- アジア太平洋:茶の生産量と消費量の増加が抹茶産業の成長を促進する可能性が高いです
- 業界の潜在的リスク&課題
- 代替品に比べ製品コストが高い
- 促進要因
- 価格分析
- 地域別価格設定
- コスト構造分析
- 研究開発コスト
- 製造・設備コスト
- 原材料費
- 流通コスト
- 営業コスト
- 雑費
- イノベーションと持続可能性
- 特許分析
- 成長可能性分析、2019年
- ポーター分析
- PESTEL分析
第4章 競合情勢
- イントロダクション
- 企業シェア
- 地域別シェア
- 市場競争分析
- 競合のポジショニング・マトリックス
- 戦略展望マトリックス
第5章 抹茶市場規模・予測:生産技術別、2018年~2032年
- 主要生産技術動向
- 釜炒り
- 深蒸し
第6章 抹茶市場規模・予測:グレード別、2018年~2032年
- 主要グレード動向
- セレモニアル
- クラシック
- 料理用
第7章 抹茶市場規模・予測:用途別、2018年~2032年
- 主要用途動向
- 一般茶
- 抹茶飲料
- 食品
- パーソナルケア&化粧品
第8章 抹茶市場規模・予測:地域別、2018年~2032年
- 主要動向:地域別
- 北米
- 米国
- カナダ
- 欧州
- ドイツ
- 英国
- フランス
- スペイン
- イタリア
- アジア太平洋
- 日本
- 中国
- インド
- オーストラリア
- 韓国
- インドネシア
- マレーシア
- ラテンアメリカ
- ブラジル
- メキシコ
- アルゼンチン
- 中東・アフリカ
- 南アフリカ
- サウジアラビア
- アラブ首長国連邦
- エジプト
第9章 企業プロファイル
- Sun Time Tea Company
- Muziba Tea Company
- Matcha Maiden
- Shaanxi Dongyu Tea
- Kissa Tea Gmbh Company
- Tea's Me Company
- ITO EN., Ltd
- Aoi Tea Company
- Vivid Vitality
- AIYA America
- DoMatcha
- Midori Spring
- Ippodo Tea
- Encha
Data Tables
- TABLE 1. Market revenue, by production technology (2022)
- TABLE 2. Marker revenue, by grade (2022)
- TABLE 3. Market revenue, by application (2022)
- TABLE 4. Market revenue, by region (2022)
- TABLE 5. Global Matcha market size, 2018 - 2032, (USD Million)
- TABLE 6. Global Matcha market size, 2018 - 2032, (Kilo Tons)
- TABLE 7. Global Matcha market size, by region, 2018-2032 (USD Million)
- TABLE 8. Global Matcha market size, by region, 2018-2032 (Kilo Tons)
- TABLE 9. Global Matcha market size, by production technology, 2018-2032 (USD Million)
- TABLE 10. Global Matcha market size, by production technology, 2018-2032 (Kilo Tons)
- TABLE 11. Global Matcha market size, by grade, 2018-2032 (USD Million)
- TABLE 12. Global Matcha market size, by grade, 2018-2032 (Kilo Tons)
- TABLE 13. Global Matcha market size, by application, 2018-2032 (USD Million)
- TABLE 14. Global Matcha market size, by application, 2018-2032 (Kilo Tons)
- TABLE 15. Industry impact forces
- TABLE 16. North America Matcha market size, by country, 2018-2032 (USD Million)
- TABLE 17. North America Matcha market size, by country, 2018-2032 (Kilo Tons)
- TABLE 18. North America Matcha market size, by production technology, 2018-2032 (USD Million)
- TABLE 19. North America Matcha market size, by production technology, 2018-2032 (Kilo Tons)
- TABLE 20. North America Matcha market size, by grade, 2018-2032 (USD Million)
- TABLE 21. North America Matcha market size, by grade, 2018-2032 (Kilo Tons)
- TABLE 22. North America Matcha market size, by application, 2018-2032 (USD Million)
- TABLE 23. North America Matcha market size, by application, 2018-2032 (Kilo Tons)
- TABLE 24. U.S. Matcha market size, by production technology, 2018-2032 (USD Million)
- TABLE 25. U.S. Matcha market size, by production technology, 2018-2032 (Kilo Tons)
- TABLE 26. U.S. Matcha market size, by grade, 2018-2032 (USD Million)
- TABLE 27. U.S. Matcha market size, by grade, 2018-2032 (Kilo Tons)
- TABLE 28. U.S. Matcha market size, by application, 2018-2032 (USD Million)
- TABLE 29. U.S. Matcha market size, by application, 2018-2032 (Kilo Tons)
- TABLE 30. Canada Matcha market size, by production technology, 2018-2032 (USD Million)
- TABLE 31. Canada Matcha market size, by production technology, 2018-2032 (Kilo Tons)
- TABLE 32. Canada Matcha market size, by grade, 2018-2032 (USD Million)
- TABLE 33. Canada Matcha market size, by grade, 2018-2032 (Kilo Tons)
- TABLE 34. Canada Matcha market size, by application, 2018-2032 (USD Million)
- TABLE 35. Canada Matcha market size, by application, 2018-2032 (Kilo Tons)
- TABLE 36. Europe Matcha market size, by country, 2018-2032 (USD Million)
- TABLE 37. Europe Matcha market size, by country, 2018-2032 (Kilo Tons)
- TABLE 38. Europe Matcha market size, by production technology, 2018-2032 (USD Million)
- TABLE 39. Europe Matcha market size, by production technology, 2018-2032 (Kilo Tons)
- TABLE 40. Europe Matcha market size, by grade, 2018-2032 (USD Million)
- TABLE 41. Europe Matcha market size, by grade, 2018-2032 (Kilo Tons)
- TABLE 42. Europe Matcha market size, by application, 2018-2032 (USD Million)
- TABLE 43. Europe Matcha market size, by application, 2018-2032 (Kilo Tons)
- TABLE 44. Germany Matcha market size, by production technology, 2018-2032 (USD Million)
- TABLE 45. Germany Matcha market size, by production technology, 2018-2032 (Kilo Tons)
- TABLE 46. Germany Matcha market size, by grade, 2018-2032 (USD Million)
- TABLE 47. Germany Matcha market size, by grade, 2018-2032 (Kilo Tons)
- TABLE 48. Germany Matcha market size, by application, 2018-2032 (USD Million)
- TABLE 49. Germany Matcha market size, by application, 2018-2032 (Kilo Tons)
- TABLE 50. UK Matcha market size, by production technology, 2018-2032 (USD Million)
- TABLE 51. UK Matcha market size, by production technology, 2018-2032 (Kilo Tons)
- TABLE 52. UK Matcha market size, by grade, 2018-2032 (USD Million)
- TABLE 53. UK Matcha market size, by grade, 2018-2032 (Kilo Tons)
- TABLE 54. UK Matcha market size, by application, 2018-2032 (USD Million)
- TABLE 55. UK Matcha market size, by application, 2018-2032 (Kilo Tons)
- TABLE 56. France Matcha market size, by production technology, 2018-2032 (USD Million)
- TABLE 57. France Matcha market size, by production technology, 2018-2032 (Kilo Tons)
- TABLE 58. France Matcha market size, by grade, 2018-2032 (USD Million)
- TABLE 59. France Matcha market size, by grade, 2018-2032 (Kilo Tons)
- TABLE 60. France Matcha market size, by application, 2018-2032 (USD Million)
- TABLE 61. France Matcha market size, by application, 2018-2032 (Kilo Tons)
- TABLE 62. Spain Matcha market size, by production technology, 2018-2032 (USD Million)
- TABLE 63. Spain Matcha market size, by production technology, 2018-2032 (Kilo Tons)
- TABLE 64. Spain Matcha market size, by grade, 2018-2032 (USD Million)
- TABLE 65. Spain Matcha market size, by grade, 2018-2032 (Kilo Tons)
- TABLE 66. Spain Matcha market size, by application, 2018-2032 (USD Million)
- TABLE 67. Spain Matcha market size, by application, 2018-2032 (Kilo Tons)
- TABLE 68. Italy Matcha market size, by production technology, 2018-2032 (USD Million)
- TABLE 69. Italy Matcha market size, by production technology, 2018-2032 (Kilo Tons)
- TABLE 70. Italy Matcha market size, by grade, 2018-2032 (USD Million)
- TABLE 71. Italy Matcha market size, by grade, 2018-2032 (Kilo Tons)
- TABLE 72. Italy Matcha market size, by application, 2018-2032 (USD Million)
- TABLE 73. Italy Matcha market size, by application, 2018-2032 (Kilo Tons)
- TABLE 74. Asia Pacific Matcha market size, by country, 2018-2032 (USD Million)
- TABLE 75. Asia Pacific Matcha market size, by country, 2018-2032 (Kilo Tons)
- TABLE 76. Asia Pacific Matcha market size, by production technology, 2018-2032 (USD Million)
- TABLE 77. Asia Pacific Matcha market size, by production technology, 2018-2032 (Kilo Tons)
- TABLE 78. Asia Pacific Matcha market size, by grade, 2018-2032 (USD Million)
- TABLE 79. Asia Pacific Matcha market size, by grade, 2018-2032 (Kilo Tons)
- TABLE 80. Asia Pacific Matcha market size, by application, 2018-2032 (USD Million)
- TABLE 81. Asia Pacific Matcha market size, by application, 2018-2032 (Kilo Tons)
- TABLE 82. China Matcha market size, by production technology, 2018-2032 (USD Million)
- TABLE 83. China Matcha market size, by production technology, 2018-2032 (Kilo Tons)
- TABLE 84. China Matcha market size, by grade, 2018-2032 (USD Million)
- TABLE 85. China Matcha market size, by grade, 2018-2032 (Kilo Tons)
- TABLE 86. China Matcha market size, by application, 2018-2032 (USD Million)
- TABLE 87. China Matcha market size, by application, 2018-2032 (Kilo Tons)
- TABLE 88. Japan Matcha market size, by production technology, 2018-2032 (USD Million)
- TABLE 89. Japan Matcha market size, by production technology, 2018-2032 (Kilo Tons)
- TABLE 90. Japan Matcha market size, by grade, 2018-2032 (USD Million)
- TABLE 91. Japan Matcha market size, by grade, 2018-2032 (Kilo Tons)
- TABLE 92. Japan Matcha market size, by application, 2018-2032 (USD Million)
- TABLE 93. Japan Matcha market size, by application, 2018-2032 (Kilo Tons)
- TABLE 94. India Matcha market size, by production technology, 2018-2032 (USD Million)
- TABLE 95. India Matcha market size, by production technology, 2018-2032 (Kilo Tons)
- TABLE 96. India Matcha market size, by grade, 2018-2032 (USD Million)
- TABLE 97. India Matcha market size, by grade, 2018-2032 (Kilo Tons)
- TABLE 98. India Matcha market size, by application, 2018-2032 (USD Million)
- TABLE 99. India Matcha market size, by application, 2018-2032 (Kilo Tons)
- TABLE 100. Australia Matcha market size, by production technology, 2018-2032 (USD Million)
- TABLE 101. Australia Matcha market size, by production technology, 2018-2032 (Kilo Tons)
- TABLE 102. Australia Matcha market size, by grade, 2018-2032 (USD Million)
- TABLE 103. Australia Matcha market size, by grade, 2018-2032 (Kilo Tons)
- TABLE 104. Australia Matcha market size, by application, 2018-2032 (USD Million)
- TABLE 105. Australia Matcha market size, by application, 2018-2032 (Kilo Tons)
- TABLE 106. South Korea Matcha market size, by production technology, 2018-2032 (USD Million)
- TABLE 107. South Korea Matcha market size, by production technology, 2018-2032 (Kilo Tons)
- TABLE 108. South Korea Matcha market size, by grade, 2018-2032 (USD Million)
- TABLE 109. South Korea Matcha market size, by grade, 2018-2032 (Kilo Tons)
- TABLE 110. South Korea Matcha market size, by application, 2018-2032 (USD Million)
- TABLE 111. South Korea Matcha market size, by application, 2018-2032 (Kilo Tons)
- TABLE 112. Indonesia Matcha market size, by production technology, 2018-2032 (USD Million)
- TABLE 113. Indonesia Matcha market size, by production technology, 2018-2032 (Kilo Tons)
- TABLE 114. Indonesia Matcha market size, by grade, 2018-2032 (USD Million)
- TABLE 115. Indonesia Matcha market size, by grade, 2018-2032 (Kilo Tons)
- TABLE 116. Indonesia Matcha market size, by application, 2018-2032 (USD Million)
- TABLE 117. Indonesia Matcha market size, by application, 2018-2032 (Kilo Tons)
- TABLE 118. Malaysia Matcha market size, by production technology, 2018-2032 (USD Million)
- TABLE 119. Malaysia Matcha market size, by production technology, 2018-2032 (Kilo Tons)
- TABLE 120. Malaysia Matcha market size, by grade, 2018-2032 (USD Million)
- TABLE 121. Malaysia Matcha market size, by grade, 2018-2032 (Kilo Tons)
- TABLE 122. Malaysia Matcha market size, by application, 2018-2032 (USD Million)
- TABLE 123. Malaysia Matcha market size, by application, 2018-2032 (Kilo Tons)
- TABLE 124. Latin America Matcha market size, by country, 2018-2032 (USD Million)
- TABLE 125. Latin America Matcha market size, by country, 2018-2032 (Kilo Tons)
- TABLE 126. Latin America Matcha market size, by production technology, 2018-2032 (USD Million)
- TABLE 127. Latin America Matcha market size, by production technology, 2018-2032 (Kilo Tons)
- TABLE 128. Latin America Matcha market size, by grade, 2018-2032 (USD Million)
- TABLE 129. Latin America Matcha market size, by grade, 2018-2032 (Kilo Tons)
- TABLE 130. Latin America Matcha market size, by application, 2018-2032 (USD Million)
- TABLE 131. Latin America Matcha market size, by application, 2018-2032 (Kilo Tons)
- TABLE 132. Brazil Matcha market size, by production technology, 2018-2032 (USD Million)
- TABLE 133. Brazil Matcha market size, by production technology, 2018-2032 (Kilo Tons)
- TABLE 134. Brazil Matcha market size, by grade, 2018-2032 (USD Million)
- TABLE 135. Brazil Matcha market size, by grade, 2018-2032 (Kilo Tons)
- TABLE 136. Brazil Matcha market size, by application, 2018-2032 (USD Million)
- TABLE 137. Brazil Matcha market size, by application, 2018-2032 (Kilo Tons)
- TABLE 138. Mexico Matcha market size, by production technology, 2018-2032 (USD Million)
- TABLE 139. Mexico Matcha market size, by production technology, 2018-2032 (Kilo Tons)
- TABLE 140. Mexico Matcha market size, by grade, 2018-2032 (USD Million)
- TABLE 141. Mexico Matcha market size, by grade, 2018-2032 (Kilo Tons)
- TABLE 142. Mexico Matcha market size, by application, 2018-2032 (USD Million)
- TABLE 143. Mexico Matcha market size, by application, 2018-2032 (Kilo Tons)
- TABLE 144. Argentina Matcha market size, by production technology, 2018-2032 (USD Million)
- TABLE 145. Argentina Matcha market size, by production technology, 2018-2032 (Kilo Tons)
- TABLE 146. Argentina Matcha market size, by grade, 2018-2032 (USD Million)
- TABLE 147. Argentina Matcha market size, by grade, 2018-2032 (Kilo Tons)
- TABLE 148. Argentina Matcha market size, by application, 2018-2032 (USD Million)
- TABLE 149. Argentina Matcha market size, by application, 2018-2032 (Kilo Tons)
- TABLE 150. MEA Matcha market size, by country, 2018-2032 (USD Million)
- TABLE 151. MEA Matcha market size, by country, 2018-2032 (Kilo Tons)
- TABLE 152. MEA Matcha market size, by production technology, 2018-2032 (USD Million)
- TABLE 153. MEA Matcha market size, by production technology, 2018-2032 (Kilo Tons)
- TABLE 154. MEA Matcha market size, by grade, 2018-2032 (USD Million)
- TABLE 155. MEA Matcha market size, by grade, 2018-2032 (Kilo Tons)
- TABLE 156. MEA Matcha market size, by application, 2018-2032 (USD Million)
- TABLE 157. MEA Matcha market size, by application, 2018-2032 (Kilo Tons)
- TABLE 158. South Africa Matcha market size, by production technology, 2018-2032 (USD Million)
- TABLE 159. South Africa Matcha market size, by production technology, 2018-2032 (Kilo Tons)
- TABLE 160. South Africa Matcha market size, by grade, 2018-2032 (USD Million)
- TABLE 161. South Africa Matcha market size, by grade, 2018-2032 (Kilo Tons)
- TABLE 162. South Africa Matcha market size, by application, 2018-2032 (USD Million)
- TABLE 163. South Africa Matcha market size, by application, 2018-2032 (Kilo Tons)
- TABLE 164. Saudi Arabia Matcha market size, by production technology, 2018-2032 (USD Million)
- TABLE 165. Saudi Arabia Matcha market size, by production technology, 2018-2032 (Kilo Tons)
- TABLE 166. Saudi Arabia Matcha market size, by grade, 2018-2032 (USD Million)
- TABLE 167. Saudi Arabia Matcha market size, by grade, 2018-2032 (Kilo Tons)
- TABLE 168. Saudi Arabia Matcha market size, by application, 2018-2032 (USD Million)
- TABLE 169. Saudi Arabia Matcha market size, by application, 2018-2032 (Kilo Tons)
- TABLE 170. UAE Matcha market size, by production technology, 2018-2032 (USD Million)
- TABLE 171. UAE Matcha market size, by production technology, 2018-2032 (Kilo Tons)
- TABLE 172. UAE Matcha market size, by grade, 2018-2032 (USD Million)
- TABLE 173. UAE Matcha market size, by grade, 2018-2032 (Kilo Tons)
- TABLE 174. UAE Matcha market size, by application, 2018-2032 (USD Million)
- TABLE 175. UAE Matcha market size, by application, 2018-2032 (Kilo Tons)
- TABLE 176. Egypt Matcha market size, by production technology, 2018-2032 (USD Million)
- TABLE 177. Egypt Matcha market size, by production technology, 2018-2032 (Kilo Tons)
- TABLE 178. Egypt Matcha market size, by grade, 2018-2032 (USD Million)
- TABLE 179. Egypt Matcha market size, by grade, 2018-2032 (Kilo Tons)
- TABLE 180. Egypt Matcha market size, by application, 2018-2032 (USD Million)
- TABLE 181. Egypt Matcha market size, by application, 2018-2032 (Kilo Tons)
Charts & Figures
- FIG. 1 Industry segmentation
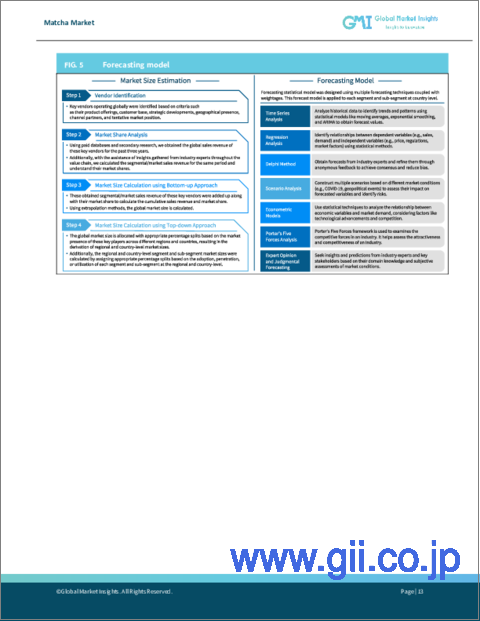
- FIG. 2 Market estimation and forecast methodology
- FIG. 3 Breakdown of primary participants
- FIG. 4 Matcha industry, 360 degree synopsis, 2018 - 2032
- FIG. 5 Industry landscape, 2018-2032 (USD Million)
- FIG. 6 Growth potential analysis
- FIG. 7 Porter's analysis
- FIG. 8 PESTEL analysis
- FIG. 9 Company matrix analysis, 2022
- FIG. 10 Strategy dashboard, 2022
Global Matcha Market share will witness over 8% CAGR between 2023 and 2032, propelled by increasing research unveiling the diverse benefits of matcha. Studies highlight its potent antioxidants, metabolism-boosting properties, and calming effects due to L-theanine.
For instance, in October 2023, It was announced that consuming green tea, black tea, or matcha latte might aid in deactivating Omicron subvariants of the SARS-CoV-2 virus. Japanese scientists discovered that compounds in these teas attach to the virus's spike protein, impeding cell infection. Additionally, sweet treats incorporating green or black tea could potentially reduce the virus load in the mouth and digestive system. These revelations underscore another health benefit of consuming these teas, potentially offering protection against the virus in different body areas.
As findings reveal its potential in aiding weight management, promoting mental clarity, and supporting overall wellness, consumer interest surges. This growing body of research positions matcha as a sought-after superfood, stimulating market growth as health-conscious individuals seek its array of benefits, contributing to its rising popularity and market demand.
The overall Matcha Market share is classified based on production technology, application, and region.
Steamed segment will undergo significant development from 2023 to 2032. This traditional method, involving careful steaming of green tea leaves, preserves their natural properties, resulting in high-quality matcha. Steamed production ensures vibrant color, enhanced flavor, and increased nutrient retention, elevating matcha's appeal. Consumers prioritize this meticulous technique for its ability to yield premium-grade matcha with superior taste and health benefits. As steamed production gains prominence, it becomes a key factor fueling the market's growth, meeting the increasing demand for top-quality matcha products.
Matcha market size from the matcha beverages segment will register a noteworthy CAGR from 2023 to 2032. Matcha, renowned for its rich antioxidants and unique flavor profile, serves as a key ingredient in various beverages. From traditional ceremonial teas to modern latte concoctions and energy drinks, matcha's versatility appeals to health-conscious consumers seeking its myriad benefits. Its presence in diverse beverage formulations drives market growth, aligning with evolving consumer preferences for functional and flavorful drinks, elevating matcha to a sought-after ingredient in the beverage industry.
Europe matcha industry will showcase a commendable CAGR from 2023 to 2032. Matcha's rise to popularity stems from its antioxidant-rich nature and versatile culinary applications. As health-conscious consumers seek natural and functional ingredients, matcha's presence in teas, desserts, and even savory dishes gains traction. This demand reflects a European market embracing wellness trends and gourmet experiences, fueling the steady growth of matcha consumption, underscoring its significance in the region's culinary landscape and health-conscious preferences.
Table of Contents
Chapter 1 Methodology & Scope
- 1.1 Market scope & definitions
- 1.2 Base estimations & working
- 1.3 Forecast calculation
- 1.4 Data Sources
- 1.4.1 Primary
- 1.4.2 Data mining sources
- 1.4.2.1 Paid Sources
- 1.4.2.2 Public Sources
Chapter 2 Executive Summary
- 2.1 Matcha industry 360 degree synopsis, 2023-2032
- 2.1.1 Business trends
- 2.1.2 Regional trends
- 2.1.3 Production technology trends
- 2.1.4 Grade trends
- 2.1.5 Application trends
Chapter 3 Matcha Industry Insights
- 3.1 Industry ecosystem analysis
- 3.1.1 Raw material suppliers
- 3.1.2 Manufacturers
- 3.1.3 Profit margin analysis
- 3.1.4 Distribution channel analysis
- 3.1.5 End-users
- 3.1.6 Vendor matrix
- 3.1.6.1 List of key raw material suppliers
- 3.1.6.2 List of key manufacturers/suppliers
- 3.1.6.3 Lits of key/potential customers
- 3.2 Technology landscape
- 3.3 Regulatory landscape
- 3.3.1 North America
- 3.3.2 Europe
- 3.3.3 Asia Pacific
- 3.3.4 Latin America
- 3.3.5 Middle East & Africa
- 3.4 Industry impact forces
- 3.4.1 Growth drivers
- 3.4.1.1 North America: Increasing matcha usage as an ingredient in the packaged food industry
- 3.4.1.2 Europe: Increasing matcha usage in cosmetics and personal care products
- 3.4.1.3 Asia Pacific: Growth in tea production & consumption is likely to favor matcha industry growth
- 3.4.2 Industry pitfalls & challenges
- 3.4.2.1 High product cost compared to its substitutes
- 3.4.1 Growth drivers
- 3.5 Pricing analysis
- 3.5.1 Regional pricing
- 3.5.1.1 North America
- 3.5.1.2 Europe
- 3.5.1.3 Asia Pacific
- 3.5.1.4 Latin America
- 3.5.1.5 Middle East & Africa
- 3.5.2 Cost structure analysis
- 3.5.2.1 R&D cost
- 3.5.2.2 Manufacturing & equipment cost
- 3.5.2.3 Raw material cost
- 3.5.2.4 Distribution cost
- 3.5.2.5 Operating cost
- 3.5.2.6 Miscellaneous cost
- 3.5.1 Regional pricing
- 3.6 Innovation & sustainability
- 3.6.1 Patent analysis
- 3.7 Growth potential analysis, 2019
- 3.8 Porter's analysis
- 3.9 PESTEL analysis
Chapter 4 Competitive Landscape, 2022
- 4.1 Introduction
- 4.2 Company market share, 2022
- 4.2.1 Company market share, by region, 2022
- 4.2.1.1 North America
- 4.2.1.2 Europe
- 4.2.1.3 Asia Pacific
- 4.2.1.4 Latin America
- 4.2.1.5 Middle East & Africa
- 4.2.1 Company market share, by region, 2022
- 4.3 Competitive analysis of market player
- 4.4 Competitive positioning matrix
- 4.5 Strategic outlook matrix
Chapter 5 Matcha Market Size & Forecast, By Production Technology, 2018 - 2032, (Kilo Tons) (USD Million)
- 5.1 Key production technology trends
- 5.2 Pan-fried
- 5.3 Steamed
Chapter 6 Matcha Market Size & Forecast, By Grade, 2018 - 2032, (Kilo Tons) (USD Million)
- 6.1 Key grade trends
- 6.2 Ceremonial
- 6.3 Classic
- 6.4 Culinary
Chapter 7 Matcha Market Size & Forecast, By Application, 2018 - 2032, (Kilo Tons) (USD Million)
- 7.1 Key application trends
- 7.2 Regular Tea
- 7.2.1 Matcha Beverages
- 7.2.2 Food
- 7.2.3 Personal care & cosmetics
Chapter 8 Matcha Market Size and Forecast, By Region 2018 - 2032
- 8.1 Key trends, by region
- 8.2 North America
- 8.2.1 U.S.
- 8.2.2 Canada
- 8.3 Europe
- 8.3.1 Germany
- 8.3.2 UK
- 8.3.3 France
- 8.3.4 Spain
- 8.3.5 Italy
- 8.4 Asia Pacific
- 8.4.1 Japan
- 8.4.2 China
- 8.4.3 India
- 8.4.4 Australia
- 8.4.5 South Korea
- 8.4.6 Indonesia
- 8.4.7 Malaysia
- 8.5 Latin America
- 8.5.1 Brazil
- 8.5.2 Mexico
- 8.5.3 Argentina
- 8.6 MEA
- 8.6.1 South Africa
- 8.6.2 Saudi Arabia
- 8.6.3 UAE
- 8.6.4 Egypt
Chapter 9 Company Profiles
- 9.1 Sun Time Tea Company
- 9.2 Muziba Tea Company
- 9.3 Matcha Maiden
- 9.4 Shaanxi Dongyu Tea
- 9.5 Kissa Tea Gmbh Company
- 9.6 Tea's Me Company
- 9.7 ITO EN., Ltd
- 9.8 Aoi Tea Company
- 9.9 Vivid Vitality
- 9.10 AIYA America
- 9.11 DoMatcha
- 9.12 Midori Spring
- 9.13 Ippodo Tea
- 9.14 Encha
