|
|
市場調査レポート
商品コード
1680888
先端炭素材料の世界市場(2025年~2035年)The Global Market for Advanced Carbon Materials 2025-2035 |
||||||
|
|||||||
|
|||||||


| 先端炭素材料の世界市場(2025年~2035年) |
|
出版日: 2025年03月17日
発行: Future Markets, Inc.
ページ情報: 英文 1074 Pages, 245 Tables, 185 Figures
納期: 即納可能
|

全表示
- 概要
- 図表
- 目次
当レポートでは、従来の炭素繊維からグラフェンやカーボンナノチューブのような最先端のナノ材料まで、炭素材料のエコシステム全体を詳細に分析しています。持続可能な開発とグリーンエネルギーへの移行が推進される中、先端炭素材料は次世代技術を実現する上でますます重要な役割を果たしています。高い強度対重量比、熱伝導性、電気伝導性、化学的安定性など、その卓越した特性は、さまざまな産業における複雑な工学的課題への対応に不可欠なものとなっています。
当レポートでは、世界の先端炭素材料市場について調査分析し、炭素材料の技術的、商業的、市場的側面を検証し、生産技術、サプライチェーン、競合情勢、成長機会に関する戦略的な知見を提供しています。
目次
第1章先端炭素材料市場
- 市場の概要
- 主な用途
- グリーン移行における先端炭素材料の役割
第2章 炭素繊維
- 炭素繊維の特性
- 前駆体材料の種類
- 市場と用途
- 市場の分析
- 企業プロファイル
第3章 カーボンブラック
- 市販のカーボンブラック
- 特性
- 製造プロセス
- 市場と用途
- 特殊カーボンブラック
- 回収カーボンブラック(rCB)
- 市場の分析
- 企業プロファイル(企業51社のプロファイル)
第4章 黒鉛
- 黒鉛の種類
- 天然黒鉛
- 合成黒鉛
- 新しい技術
- 黒鉛材料のリサイクル
- 市場と用途
- 黒鉛の価格
- 世界の黒鉛生産
- 世界の黒鉛の市場需要:最終用途市場別(2016年~2035年)
- 黒鉛の需要:最終用途市場別(2023年)
- 黒鉛の需要:最終用途市場別(2035年)
- 需要:地域別
- 黒鉛市場の成長促進要因
- 黒鉛市場の成長抑制要因
- 主要市場企業
- 市場サプライチェーン
- 企業プロファイル(企業102社のプロファイル)
第5章 バイオ炭
- バイオ炭とは
- 炭素隔離
- バイオ炭の特性
- 市場と用途
- バイオ炭の生産
- 原料
- 生産プロセス
- カーボンクレジット
- バイオ炭の市場
- 市場の分析
- 世界市場
- 企業プロファイル(企業130社のプロファイル)
第6章 グラフェン
- グラフェンの種類
- 特性
- 市場の分析
- 企業プロファイル(企業368社のプロファイル)
第7章 カーボンナノチューブ
- 特性
- 多層カーボンナノチューブ(MWCNT)
- 単層カーボンナノチューブ(SWCNT)
- その他のタイプ
第8章 カーボンナノファイバー
- 特性
- 合成
- 市場
- 市場の分析
- 世界市場の収益
- 企業(企業12社のプロファイル)
第9章 フラーレン
- 特性
- 市場と用途
- 技術成熟度(TRL)
- 市場の分析
- メーカー(企業20社のプロファイル)
第10章 ナノダイヤモンド
- イントロダクション
- 種類
- 市場と用途
- 市場の分析
- 企業プロファイル(企業30社のプロファイル)
第11章 グラフェン量子ドット
- 量子ドットとの比較
- 特性
- 合成
- 用途
- グラフェン量子ドットの価格設定
- グラフェン量子ドットメーカー(企業9社のプロファイル)
第12章 カーボンフォーム
- 種類
- 特性
- 用途
- 企業プロファイル(企業9社のプロファイル)
第13章 ダイヤモンドライクカーボン(DLC)コーティング
- 特性
- 用途と市場
- 世界の市場規模
- 企業プロファイル(企業9社のプロファイル)
第14章 活性炭
- 概要
- 種類
- 生産
- 市場と用途
- 市場の分析
- 世界市場の収益(2020年~2035年)
- 企業(企業22社のプロファイル)
第15章 カーボンエアロゲル、キセロゲル
- 概要
- 種類
- 市場と用途
- 市場の分析
- 世界市場
- 企業(企業10社のプロファイル)
第16章 炭素回収・利用由来の炭素材料
- 点源からのCO2回収
- 主な炭素回収プロセス
- 炭素分離技術
- 直接空気回収(DAC)
- 企業(企業4社のプロファイル)
第17章 調査手法
第18章 参考文献
List of Tables
- Table 1. The advanced carbon materials market
- Table 2.Carbon-Based Thermal Management Materials
- Table 3. Carbon-Based Battery Additives
- Table 4. Classification and types of the carbon fibers
- Table 5. Summary of carbon fiber properties
- Table 6. Modulus classifications of carbon fiber
- Table 7. Comparison of main precursor fibers
- Table 8. Properties of lignins and their applications
- Table 9. Lignin-derived anodes in lithium batteries
- Table 10. Fiber properties of polyolefin-based CFs
- Table 11. Summary of carbon fiber (CF) recycling technologies. Advantages and disadvantages
- Table 12. Retention rate of tensile properties of recovered carbon fibres by different recycling processes
- Table 13. Recycled carbon fiber producers, technology and capacity
- Table 14. Methods for direct fiber integration
- Table 15. Continuous fiber 3D printing producers
- Table 16. Summary of markets and applications for CFRPs
- Table 17. Comparison of CFRP to competing materials
- Table 18. The market for carbon fibers in wind energy-market drivers, applications, desirable properties, pricing and key players
- Table 19. The market for carbon fibers in sports & leisure-market drivers, applications, desirable properties, pricing and key players
- Table 20. The market for carbon fibers in automotive-market drivers, applications, desirable properties, pricing and key players
- Table 21. The market for carbon fibers in pressure vessels-market drivers, desirable properties of CF, applications, pricing, key players
- Table 22. The market for carbon fibers in oil and gas-market drivers, desirable properties, applications, pricing and key players
- Table 23. Market drivers and trends in carbon fibers
- Table 24. Regulations pertaining to carbon fibers
- Table 25. Price and costs analysis for carbon fibers
- Table 26. Carbon fibers supply chain
- Table 27. Key players, carbon fiber supplied, manufacturing methods and target markets
- Table 28. Production capacities of carbon fiber producers, in metric tonnes, current and planned
- Table 29. Future Outlook by End-Use Market
- Table 30. Addressable market size for carbon fibers by market
- Table 31. Market challenges in the CF and CFRP market
- Table 32. Global market revenues for carbon fibers 2020-2025 (MILLIONS USD), by market
- Table 33. Global carbon fiber demand 2016-2035, by industry (MT)
- Table 34. Global carbon fiber revenues 2016-2035, by industry (MT)
- Table 35. Global carbon fiber revenues 2016-2035, by region (MT)
- Table 36. Main Toray production sites and capacities
- Table 37. Commercially available carbon black grades
- Table 38. Properties of carbon black and influence on performance
- Table 39. Carbon black compounds
- Table 40. Carbon black manufacturing processes, advantages and disadvantages
- Table 41: Market drivers for carbon black in the tire industry
- Table 42. Global market for carbon black in tires (Million metric tons), 2018 to 2033
- Table 43. Carbon black non-tire applications
- Table 44. Specialty carbon black demand, 2018-2035 (000s Tons), by market
- Table 45. Categories for recovered carbon black (rCB) based on key properties and intended applications
- Table 46. rCB post-treatment technologies
- Table 47. Recovered carbon black producers
- Table 48. Recovered carbon black demand, 2018-2035 (000s Tons), by market
- Table 49. Market Growth Drivers and Trends in Carbon Black
- Table 50. Regulations pertaining to carbon black
- Table 51. Market supply chain for carbon black
- Table 52 Pricing of carbon black
- Table 53. Carbon black capacities, by producer
- Table 54. Future outlook for carbon black by end use market
- Table 55. Customer Segmentation: Carbon Black
- Table 56. Addressable market size for carbon black by market
- Table 57. Risks and Opportunities in Carbon Black
- Table 58. Global market for carbon black 2018-2035, by end user market (100,000 tons)
- Table 59. Global market for carbon black 2018-2035, by end user market (billion USD)
- Table 60. Global market for carbon black 2018-2035, by region (100,000 tons)
- Table 61. Selected physical properties of graphite
- Table 62. Characteristics of natural and synthetic graphite
- Table 63. Comparison between Natural and Synthetic Graphite
- Table 64. Natural graphite size categories, their advantages, average prices, and applications
- Table 65. Classification of natural graphite with its characteristics
- Table 66. Applications of flake graphite
- Table 67. Amorphous graphite applications
- Table 68. Crystalline vein graphite applications
- Table 69. Characteristics of synthetic graphite
- Table 70: Main markets and applications of isostatic graphite
- Table 71. Current or planned production capacities for isostatic graphite
- Table 72. Main graphite electrode producers and capacities (MT/year)
- Table 73. Extruded graphite applications
- Table 74. Applications of Vibration Molded Graphite
- Table 75. Applicaitons of Die-molded graphite
- Table 76. Recycled refractory graphite applications
- Table 77. Markets and applications of graphite
- Table 78. Classification, application and price of graphite as a function of size
- Table 79. Pricing by graphite type, 2020-2024
- Table 80. Fine Flake Graphite Prices (-100 mesh, 90-97% C)
- Table 81. Spherical Graphite Prices (99.95% C)
- Table 82. +32 Mesh Natural Flake Graphite Prices (>500 micrometer m, 94-97% C)
- Table 83. Estimated global mine Production of natural graphite 2020-2023, by country (tons)
- Table 84. Global production of graphite 2016-2023, MT
- Table 85. Estimated global graphite production in tonnes, 2024-2035, by type
- Table 86. Demand for synthetic graphite in Asia-Pacific 2016-2035, tonnes
- Table 87. Demand for natural graphite in Asia-Pacific 2016-2035, tonnes
- Table 88. Demand for synthetic graphite in North America 2016-2035, tonnes
- Table 89. Demand for natural graphite in North America 2016-2035, tonnes
- Table 90. Demand for synthetic graphite in Europe 2018-2035, tonnes
- Table 91. Demand for natural graphite in Europe 2016-2035, tonnes
- Table 92. Main natural graphite producers
- Table 93. Main synthetic graphite producers
- Table 94. Graphite production capacities by producer
- Table 95. Next Resources graphite flake products
- Table 96. Summary of key properties of biochar
- Table 97. Biochar physicochemical and morphological properties
- Table 98. Markets and applications for biochar
- Table 99. Biochar feedstocks-source, carbon content, and characteristics
- Table 100. Biochar production technologies, description, advantages and disadvantages
- Table 101. Comparison of slow and fast pyrolysis for biomass
- Table 102. Comparison of thermochemical processes for biochar production
- Table 103. Biochar production equipment manufacturers
- Table 104. Competitive materials and technologies that can also earn carbon credits
- Table 105. Biochar applications in agriculture and livestock farming
- Table 106. Effect of biochar on different soil properties
- Table 107. Fertilizer products and their associated N, P, and K content
- Table 108. Application of biochar in construction
- Table 109. Process and benefits of biochar as an amendment in cement
- Table 110. Application of biochar in asphalt
- Table 111. Biochar applications for wastewater treatment
- Table 112. Biochar in carbon capture overview
- Table 113. Biochar in cosmetic products
- Table 114. Biochar in textiles
- Table 115. Biochar in additive manufacturing
- Table 116. Biochar in ink
- Table 117. Biochar in packaging
- Table 118. Companies using biochar in packaging
- Table 119. Biochar in steel and metal
- Table 120. Summary of applications of biochar in energy
- Table 121. Market Growth Drivers and Trends in biochar
- Table 122. Regulations pertaining to biochar
- Table 123. Biochar supply chain
- Table 124. Key players, manufacturing methods and target markets
- Table 125. Future outlook for biochar by end use market
- Table 126. Customer Segmentation for Biochar
- Table 127. Addressable market size for biochar by market
- Table 128. Risk and opportunities in Biochar
- Table 129. Global demand for biochar 2018-2035 (1,000 tons), by market
- Table 130. Global demand for biochar 2018-2035 (1,000 tons), by region
- Table 131. Biochar production by feedstocks in China (1,000 tons), 2023-2035
- Table 132. Biochar production by feedstocks in Asia-Pacific (1,000 tons), 2023-2035
- Table 133. Biochar production by feedstocks in North America (1,000 tons), 2023-2035
- Table 134. Biochar production by feedstocks in Europe (1,000 tons), 2023-2035
- Table 135. Properties of graphene, properties of competing materials, applications thereof
- Table 136. Market Growth Drivers and Trends in graphene
- Table 137. Regulations pertaining to graphene
- Table 138. Types of graphene and typical prices
- Table 139. Pristine graphene flakes pricing by producer
- Table 140. Few-layer graphene pricing by producer
- Table 141. Graphene nanoplatelets pricing by producer
- Table 142. Graphene oxide and reduced graphene oxide pricing, by producer
- Table 143. Multi-layer graphene pricing by producer
- Table 144. Graphene ink pricing by producer
- Table 145. Market and applications for graphene in automotive
- Table 146. Graphene supply chain
- Table 147. Future outlook for graphene by end use market
- Table 148. Addressable market size for graphene by market
- Table 149. Risks and Opportunities in Graphene
- Table 150. Global graphene demand by type of graphene material, 2018-2035 (tons)
- Table 151. Global graphene demand by market, 2018-2035 (tons)
- Table 152. Global graphene demand, by region, 2018-2035 (tons)
- Table 153. Performance criteria of energy storage devices
- Table 154. Typical properties of SWCNT and MWCNT
- Table 155. Properties of CNTs and comparable materials
- Table 156. Applications of MWCNTs
- Table 157. Comparative properties of MWCNT and SWCNT
- Table 158. Markets, benefits and applications of Single-Walled Carbon Nanotubes
- Table 159. Chasm SWCNT products
- Table 160. Thomas Swan SWCNT production
- Table 161. Properties of carbon nanotube paper
- Table 162. Applications of Double-walled carbon nanotubes
- Table 163. Markets and applications for Vertically aligned CNTs (VACNTs)
- Table 164. Markets and applications for few-walled carbon nanotubes (FWNTs)
- Table 165. Markets and applications for carbon nanohorns
- Table 166. Comparative properties of BNNTs and CNTs
- Table 167. Applications of BNNTs
- Table 168. Carbon Nanofibers from Biomass Analysis
- Table 169. Market Growth Drivers and Trends in Carbon Nanofibers
- Table 170. Price and Cost Analysis for Carbon Nanofibers
- Table 171. Carbon nanofibers supply chain
- Table 172. Future outlook for CNFs by end use market
- Table 173. Addressable market size for CNFs by market
- Table 174. Risks and Opportunities Analysis for Carbon Nanofibers
- Table 175. Global market revenues for carbon nanofibers 2020-2035 (MILLIONS USD), by market
- Table 176. Market overview for fullerenes-Selling grade particle diameter, usage, advantages, average price/ton, high volume applications, low volume applications and novel applications
- Table 177. Types of fullerenes and applications
- Table 178. Products incorporating fullerenes
- Table 179. Markets, benefits and applications of fullerenes
- Table 180. Market Growth Drivers and Trends in Fullerenes
- Table 181. Price and costs analysis for Fullerenes
- Table 182. Fullerenes supply chain
- Table 183. Future outlook for Fullerenes by end use market
- Table 184. Addressable market size for Fullerenes by market
- Table 185. Risks and Opportunities Analysis
- Table 186. Global market demand for fullerenes, 2018-2035 (tons)
- Table 187. Properties of nanodiamonds
- Table 188. Summary of types of NDS and production methods-advantages and disadvantages
- Table 189. Markets, benefits and applications of nanodiamonds
- Table 190. Market Growth Drivers and Trends in Nanodiamonds
- Table 191. Regulations pertaining to Nanodiamonds
- Table 192. Price and costs analysis for Nanodiamonds
- Table 193. Price of nanodiamonds by producer
- Table 194. Nanodiamonds supply chain
- Table 195. Future outlook for Nanodiamonds by end use market
- Table 196. Risks and Opportunities in Nanodiamonds
- Table 197. Demand for nanodiamonds (metric tonnes), 2018-2035
- Table 198. Production methods, by main ND producers
- Table 199. Adamas Nanotechnologies, Inc. nanodiamond product list
- Table 200. Carbodeon Ltd. Oy nanodiamond product list
- Table 201. Daicel nanodiamond product list
- Table 202. FND Biotech Nanodiamond product list
- Table 203. JSC Sinta nanodiamond product list
- Table 204. Plasmachem product list and applications
- Table 205. Ray-Techniques Ltd. nanodiamonds product list
- Table 206. Comparison of ND produced by detonation and laser synthesis
- Table 207. Comparison of graphene QDs and semiconductor QDs
- Table 208. Advantages and disadvantages of methods for preparing GQDs
- Table 209. Applications of graphene quantum dots
- Table 210. Prices for graphene quantum dots
- Table 211. Properties of carbon foam materials
- Table 212. Applications of carbon foams
- Table 213. Properties of Diamond-like carbon (DLC) coatings
- Table 214. Applications and markets for Diamond-like carbon (DLC) coatings
- Table 215. Global revenues for DLC coatings, 2018-2035 (Billion USD)
- Table 216. Markets and Applications for Activated Carbon
- Table 217. Market Growth Drivers and Trends in Activated Carbon
- Table 218. Regulations pertaining to Activated Carbon
- Table 219. Price and costs analysis for Activated Carbon
- Table 220. Activated Carbon supply chain
- Table 221. Future outlook for Activated Carbon by end use market
- Table 222. Addressable market size for Activated Carbon by market
- Table 223. Risks and Opportunities in Activated Carbon
- Table 224. Global market revenues for Activated Carbon 2020-2035 (millions USD), by market
- Table 225. Markets and Applications for Carbon Aerogels and Xerogels
- Table 226. Market Growth Drivers and Trends in Carbon Aerogels and Xerogels
- Table 227. Regulations pertaining to Carbon Aerogels and Xerogels
- Table 228. Price and costs analysis for Carbon Aerogels and Xerogels
- Table 229. Carbon Aerogels and Xerogels supply chain
- Table 230. Future outlook for Carbon Aerogels and Xerogels by end use market
- Table 231. Addressable market size for Carbon Aerogels and Xerogels by market
- Table 232. Risks and Opportunities in Carbon Aerogels
- Table 233. Global market revenues for Carbon Aerogels and Xerogels 2020-2035 (millions USD), by market
- Table 234. Point source examples
- Table 235. Assessment of carbon capture materials
- Table 236. Chemical solvents used in post-combustion
- Table 237. Commercially available physical solvents for pre-combustion carbon capture
- Table 238. Main capture processes and their separation technologies
- Table 239. Absorption methods for CO2 capture overview
- Table 240. Commercially available physical solvents used in CO2 absorption
- Table 241. Adsorption methods for CO2 capture overview
- Table 242. Membrane-based methods for CO2 capture overview
- Table 243. Comparison of main separation technologies
- Table 244. CO2 derived products via electrochemical conversion-applications, advantages and disadvantages
- Table 245. Advantages and disadvantages of DAC
List of Figures
- Figure 1. Manufacturing process of PAN type carbon fibers
- Figure 2. Production processes for pitch-based carbon fibers
- Figure 3. Lignin/celluose precursor
- Figure 4. Process of preparing CF from lignin
- Figure 5. Carbon fiber manufacturing capacity in 2023, by company (metric tonnes)
- Figure 6. Neustark modular plant
- Figure 7. CR-9 carbon fiber wheel
Advanced carbon materials are transforming industries through applications in:
- Lightweight, high-strength composites for aerospace and automotive
- Next-generation batteries and supercapacitors
- Thermal management in electronics
- Medical implants and drug delivery systems
- Water purification and environmental remediation
- Sensors and electronic components
Their commercial importance continues to grow as manufacturing processes mature, reducing costs and enabling broader adoption across multiple sectors where conventional materials cannot meet increasingly demanding performance requirements. "The Global Market for Advanced Carbon Materials 2025-2035" provides an in-depth analysis of the entire carbon materials ecosystem, from traditional carbon fibers to cutting-edge nanomaterials like graphene and carbon nanotubes. With the push for sustainable development and the transition to green energy, advanced carbon materials are playing an increasingly critical role in enabling next-generation technologies. Their exceptional properties-including high strength-to-weight ratios, thermal and electrical conductivity, and chemical stability-make them indispensable in addressing complex engineering challenges across multiple industries.
This report examines the technical, commercial, and market aspects of carbon materials, offering strategic insights into production technologies, supply chains, competitive landscapes, and growth opportunities.
Report contents include:
- Market Analysis and Forecasts:
- Comprehensive market sizing and growth projections through 2035 for all advanced carbon material categories
- Detailed regional analysis covering North America, Europe, Asia-Pacific, and emerging markets
- End-user industry breakdown with application-specific forecasts
- Pricing trends and cost analyses across the entire carbon materials spectrum
- Production capacities by material type and leading manufacturers
- Material Coverage:
- Carbon Fibers: PAN-based, pitch-based, bio-based, and recycled carbon fibers
- Carbon Black: Conventional, specialty, and recovered carbon black
- Graphite: Natural flake, synthetic, spherical, and expandable graphite
- Graphene: Few-layer, multi-layer, graphene oxide, and graphene nanoplatelets
- Carbon Nanotubes: Single-walled, multi-walled, and vertically aligned CNTs
- Nanodiamonds: Detonation nanodiamonds and fluorescent nanodiamonds
- Other Carbon Materials: Carbon aerogels, fullerenes, carbon nanofibers, and biochar
- Application Analysis:
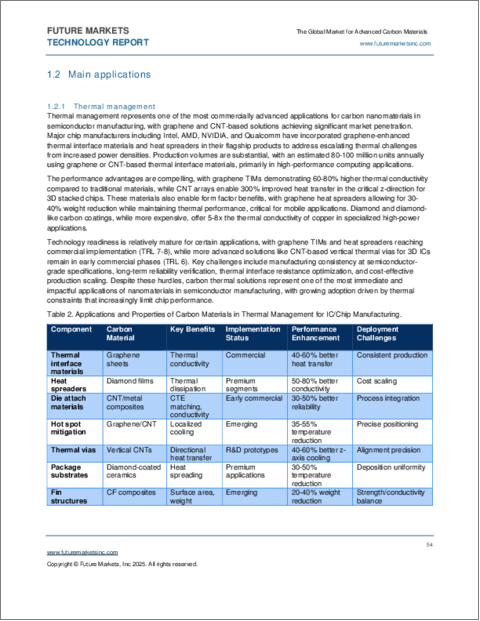
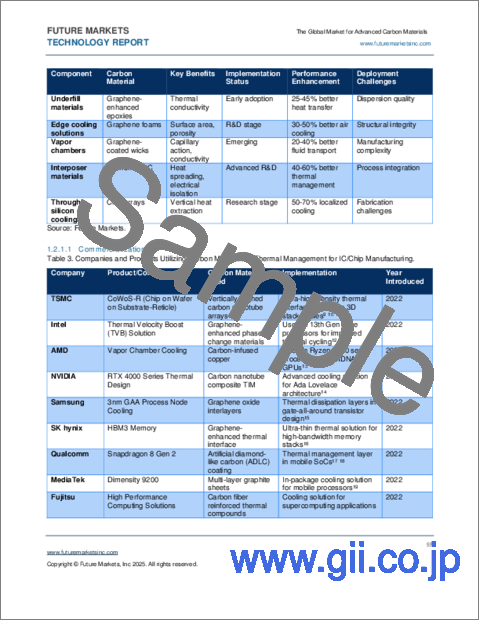
- Thermal Management: Interface materials, heat spreaders, and thermal solutions
- Energy Storage: Battery additives, supercapacitors, and fuel cell components
- Composites: Aerospace, automotive, wind energy, and sporting goods
- Electronics: Conductive inks, sensors, EMI shielding, and flexible electronics
- Environmental Technologies: Carbon capture, water purification, and remediation
- Technology Assessment:
- Manufacturing processes and innovations for each carbon material type
- Technology readiness levels (TRL) and commercialization timelines
- Emerging synthesis methods and their potential impact on markets
- Key technical challenges and R&D priorities
- Competitive Landscape:
- Detailed profiles of 1000+ companies across the carbon materials value chain. Companies profiled include Arkema, Birla Carbon, Black Bear Carbon, Black Semiconductor GmbH, C12, Carbon Conversions, Carbice, Cabot Corporation, Directa Plus, DowAksa, Eden Innovations, First Graphene, Fujitsu Laboratories, GrafTech International, Graphene Manufacturing Group, Graphenea, GraphEnergy Tech, Graphjet Technology, Hexcel Corporation, Huntsman Corporation, HydroGraph, Imerys, INBRAIN Neuroelectronics, Levidian Nanosystems, Lyten, Mersen, Nanocomp Technologies, Naieel Technology, NanoXplore, NDB Technology, OCSiAl Group, Paragraf, Perpetuus Carbon Group, Premier Graphene, Resonac, Samsung, SGL Carbon, Skeleton Technologies, Syrah Resources, Talga Resources, Teijin Limited, Thomas Swan, Toray Industries, TrimTabs, Universal Matter, Vartega, Versarien, and Zeon Specialty Materials.
- Strategic analysis of key market players including producers and product developers, including product portfolios and business models
- Mergers, acquisitions, and strategic partnerships reshaping the industry
- Emerging start-ups and innovators disrupting traditional markets
- Sustainability and Regulatory Analysis:
- Environmental impact assessments of production processes
- Carbon footprint comparisons across material types
- Regulatory frameworks affecting carbon materials globally
- Recycling and circular economy initiatives
TABLE OF CONTENTS
1. THE ADVANCED CARBON MATERIALS MARKET
- 1.1. Market overview
- 1.2. Main Applications
- 1.2.1. Thermal Management in Electronics
- 1.2.2. Conductive Battery Additives and Electrodes
- 1.2.3. Composites
- 1.3. Role of advanced carbon materials in the green transition
2. CARBON FIBERS
- 2.1. Properties of carbon fibers
- 2.1.1. Types by modulus
- 2.1.2. Types by the secondary processing
- 2.2. Precursor material types
- 2.2.1. PAN: Polyacrylonitrile
- 2.2.1.1. Spinning
- 2.2.1.2. Stabilizing
- 2.2.1.3. Carbonizing
- 2.2.1.4. Surface treatment
- 2.2.1.5. Sizing
- 2.2.1.6. Pitch-based carbon fibers
- 2.2.1.7. Isotropic pitch
- 2.2.1.8. Mesophase pitch
- 2.2.1.9. Viscose (Rayon)-based carbon fibers
- 2.2.2. Bio-based and alternative precursors
- 2.2.2.1. Lignin
- 2.2.2.2. Polyethylene
- 2.2.2.3. Vapor grown carbon fiber (VGCF)
- 2.2.2.4. Textile PAN
- 2.2.3. Recycled carbon fibers (r-CF)
- 2.2.3.1. Recycling processes
- 2.2.3.2. Companies
- 2.2.4. Carbon Fiber 3D Printing
- 2.2.5. Plasma oxidation
- 2.2.6. Carbon fiber reinforced polymer (CFRP)
- 2.2.6.1. Applications
- 2.2.1. PAN: Polyacrylonitrile
- 2.3. Markets and applications
- 2.3.1. Aerospace
- 2.3.2. Wind energy
- 2.3.3. Sports & leisure
- 2.3.4. Automotive
- 2.3.5. Pressure vessels
- 2.3.6. Oil and gas
- 2.4. Market analysis
- 2.4.1. Market Growth Drivers and Trends
- 2.4.2. Regulations
- 2.4.3. Price and Costs Analysis
- 2.4.4. Supply Chain
- 2.4.5. Competitive Landscape
- 2.4.5.1. Annual capacity, by producer
- 2.4.5.2. Market share, by capacity
- 2.4.6. Future Outlook
- 2.4.7. Addressable Market Size
- 2.4.8. Risks and Opportunities
- 2.4.9. Global market
- 2.4.9.1. Global carbon fiber demand 2016-2035, by industry (MT)
- 2.4.9.2. Global carbon fiber revenues 2016-2035, by industry (billions USD)
- 2.4.9.3. Global carbon fiber demand 2016-2035, by region (MT)
- 2.5. Company profiles
- 2.5.1. Carbon fiber producers (29 company profiles)
- 2.5.2. Carbon Fiber composite producers (62 company profiles)
- 2.5.3. Carbon fiber recyclers (16 company profiles)
3. CARBON BLACK
- 3.1. Commercially available carbon black
- 3.2. Properties
- 3.2.1. Particle size distribution
- 3.2.2. Structure-Aggregate size
- 3.2.3. Surface chemistry
- 3.2.4. Agglomerates
- 3.2.5. Colour properties
- 3.2.6. Porosity
- 3.2.7. Physical form
- 3.3. Manufacturing processes
- 3.4. Markets and applications
- 3.4.1. Tires and automotive
- 3.4.2. Non-Tire Rubber (Industrial rubber)
- 3.4.3. Other markets
- 3.5. Specialty carbon black
- 3.5.1. Global market size for specialty CB
- 3.6. Recovered carbon black (rCB)
- 3.6.1. Pyrolysis of End-of-Life Tires (ELT)
- 3.6.2. Discontinuous ("batch") pyrolysis
- 3.6.3. Semi-continuous pyrolysis
- 3.6.4. Continuous pyrolysis
- 3.6.5. Key players
- 3.6.6. Global market size for Recovered Carbon Black
- 3.7. Market analysis
- 3.7.1. Market Growth Drivers and Trends
- 3.7.2. Regulations
- 3.7.3. Supply chain
- 3.7.4. Price and Costs Analysis
- 3.7.4.1. Feedstock
- 3.7.4.2. Commercial carbon black
- 3.7.5. Competitive Landscape
- 3.7.5.1. Production capacities
- 3.7.6. Future Outlook
- 3.7.7. Customer Segmentation
- 3.7.8. Addressable Market Size
- 3.7.9. Risks and Opportunities
- 3.7.10. Global market
- 3.7.10.1. By market (tons)
- 3.7.10.2. By market (revenues)
- 3.7.10.3. By region (Tons)
- 3.8. Company profiles (51 company profiles)
4. GRAPHITE
- 4.1. Types of graphite
- 4.1.1. Natural vs synthetic graphite
- 4.2. Natural graphite
- 4.2.1. Classification
- 4.2.2. Processing
- 4.2.3. Flake
- 4.2.3.1. Grades
- 4.2.3.2. Applications
- 4.2.3.3. Spherical graphite
- 4.2.3.4. Expandable graphite
- 4.2.4. Amorphous graphite
- 4.2.4.1. Applications
- 4.2.5. Crystalline vein graphite
- 4.2.5.1. Applications
- 4.3. Synthetic graphite
- 4.3.1. Classification
- 4.3.1.1. Primary synthetic graphite
- 4.3.1.2. Secondary synthetic graphite
- 4.3.2. Processing
- 4.3.2.1. Processing for battery anodes
- 4.3.3. Issues with synthetic graphite production
- 4.3.4. Isostatic Graphite
- 4.3.4.1. Description
- 4.3.4.2. Markets
- 4.3.4.3. Producers and production capacities
- 4.3.5. Graphite electrodes
- 4.3.6. Extruded Graphite
- 4.3.7. Vibration Molded Graphite
- 4.3.8. Die-molded graphite
- 4.3.1. Classification
- 4.4. New technologies
- 4.5. Recycling of graphite materials
- 4.6. Markers and applications
- 4.7. Graphite pricing (ton)
- 4.7.1. Pricing in 2024
- 4.8. Global production of graphite
- 4.8.1. The graphite market in 2024 and beyond
- 4.8.2. China dominance
- 4.8.3. United States subsidies/loans and tariffs on Chinese imports
- 4.8.4. Global mine production and reserves of natural graphite
- 4.8.5. Global graphite production in tonnes, 2016-2023
- 4.8.6. Estimated global graphite production in tonnes, 2024-2035
- 4.8.7. Synthetic graphite supply
- 4.9. Global market demand for graphite by end use market 2016-2035, tonnes
- 4.9.1. Natural graphite
- 4.9.2. Synthetic graphite
- 4.10. Demand for graphite by end use markets, 2023
- 4.11. Demand for graphite by end use markets, 2035
- 4.12. Demand by region
- 4.12.1. China
- 4.12.1.1. Diversification of global supply and production
- 4.12.2. Asia-Pacific
- 4.12.2.1. Synthetic graphite
- 4.12.2.2. Natural graphite
- 4.12.3. North America
- 4.12.3.1. Synthetic graphite
- 4.12.3.2. Natural graphite
- 4.12.4. Europe
- 4.12.4.1. Natural graphite
- 4.12.5. Brazil
- 4.12.1. China
- 4.13. Factors that aid graphite market growth
- 4.14. Factors that hinder graphite market growth
- 4.15. Main market players
- 4.15.1. Natural graphite
- 4.15.2. Synthetic graphite
- 4.16. Market supply chain
- 4.17. Company profiles (102 company profiles)
5. BIOCHAR
- 5.1. What is biochar?
- 5.2. Carbon sequestration
- 5.3. Properties of biochar
- 5.4. Markets and applications
- 5.5. Biochar production
- 5.6. Feedstocks
- 5.7. Production processes
- 5.7.1. Sustainable production
- 5.7.2. Pyrolysis
- 5.7.2.1. Slow pyrolysis
- 5.7.2.2. Fast pyrolysis
- 5.7.3. Gasification
- 5.7.4. Hydrothermal carbonization (HTC)
- 5.7.5. Torrefaction
- 5.7.6. Equipment manufacturers
- 5.8. Carbon credits
- 5.8.1. Overview
- 5.8.2. Removal and reduction credits
- 5.8.3. The advantage of biochar
- 5.8.4. Price
- 5.8.5. Buyers of biochar credits
- 5.8.6. Competitive materials and technologies
- 5.8.6.1. Geologic carbon sequestration
- 5.8.6.2. Bioenergy with Carbon Capture and Storage (BECCS)
- 5.8.6.3. Direct Air Carbon Capture and Storage (DACCS)
- 5.8.6.4. Enhanced mineral weathering with mineral carbonation
- 5.8.6.5. Ocean alkalinity enhancement
- 5.8.6.6. Forest preservation and afforestation
- 5.9. Markets for biochar
- 5.9.1. Agriculture & livestock farming
- 5.9.1.1. Market drivers and trends
- 5.9.1.2. Applications
- 5.9.2. Construction materials
- 5.9.2.1. Market drivers and trends
- 5.9.2.2. Applications
- 5.9.3. Wastewater treatment
- 5.9.3.1. Market drivers and trends
- 5.9.3.2. Applications
- 5.9.4. Filtration
- 5.9.4.1. Market drivers and trends
- 5.9.4.2. Applications
- 5.9.5. Carbon capture
- 5.9.5.1. Market drivers and trends
- 5.9.5.2. Applications
- 5.9.6. Cosmetics
- 5.9.6.1. Market drivers and trends
- 5.9.6.2. Applications
- 5.9.7. Textiles
- 5.9.7.1. Market drivers and trends
- 5.9.7.2. Applications
- 5.9.8. Additive manufacturing
- 5.9.8.1. Market drivers and trends
- 5.9.8.2. Applications
- 5.9.9. Ink
- 5.9.9.1. Market drivers and trends
- 5.9.9.2. Applications
- 5.9.10. Polymers
- 5.9.10.1. Market drivers and trends
- 5.9.10.2. Applications
- 5.9.11. Packaging
- 5.9.11.1. Market drivers and trends
- 5.9.11.2. Applications
- 5.9.12. Steel and metal
- 5.9.12.1. Market drivers and trends
- 5.9.12.2. Applications
- 5.9.13. Energy
- 5.9.13.1. Market drivers and trends
- 5.9.13.2. Applications
- 5.9.1. Agriculture & livestock farming
- 5.10. Market analysis
- 5.10.1. Market Growth Drivers and Trends
- 5.10.2. Regulations
- 5.10.3. Price and Costs Analysis
- 5.10.4. Supply Chain
- 5.10.5. Competitive Landscape
- 5.10.6. Future Outlook
- 5.10.7. Customer Segmentation
- 5.10.8. Addressable Market Size
- 5.10.9. Risks and Opportunities
- 5.11. Global market
- 5.11.1. By market
- 5.11.2. By region
- 5.11.3. By feedstocks
- 5.11.3.1. China and Asia-Pacific
- 5.11.3.2. North America
- 5.11.3.3. Europe
- 5.11.3.4. South America
- 5.11.3.5. Africa
- 5.11.3.6. Middle East
- 5.12. Company profiles (130 company profiles)
6. GRAPHENE
- 6.1. Types of graphene
- 6.2. Properties
- 6.3. Market analysis
- 6.3.1. Market Growth Drivers and Trends
- 6.3.2. Regulations
- 6.3.3. Price and Costs Analysis
- 6.3.3.1. Pristine graphene flakes pricing/CVD graphene
- 6.3.3.2. Few-Layer graphene pricing
- 6.3.3.3. Graphene nanoplatelets pricing
- 6.3.3.4. Graphene oxide (GO) and reduced Graphene Oxide (rGO) pricing
- 6.3.3.5. Multi-Layer graphene (MLG) pricing
- 6.3.3.6. Graphene ink
- 6.3.4. Markets and applications
- 6.3.4.1. Batteries
- 6.3.4.2. Supercapacitors
- 6.3.4.3. Polymer additives
- 6.3.4.4. Sensors
- 6.3.4.5. Conductive inks
- 6.3.4.6. Transparent conductive films
- 6.3.4.7. Transistors and integrated circuits
- 6.3.4.8. Filtration
- 6.3.4.9. Thermal management
- 6.3.4.10. 3D printing
- 6.3.4.11. Adhesives
- 6.3.4.12. Aerospace
- 6.3.4.13. Automotive
- 6.3.4.14. Fuel cells
- 6.3.4.15. Biomedical and healthcare
- 6.3.4.16. Paints and coatings
- 6.3.4.17. Photovoltaics
- 6.3.5. Supply Chain
- 6.3.6. Future Outlook
- 6.3.7. Addressable Market Size
- 6.3.8. Risks and Opportunities
- 6.3.9. Global demand 2018-2035, tons
- 6.3.9.1. Global demand by graphene material (tons)
- 6.3.9.2. Global demand by end user market
- 6.3.9.3. Graphene market, by region
- 6.4. Company profiles (368 company profiles)
7. CARBON NANOTUBES
- 7.1. Properties
- 7.1.1. Comparative properties of CNTs
- 7.2. Multi-walled carbon nanotubes (MWCNTs)
- 7.2.1. Properties
- 7.2.2. Markets and applications
- 7.3. Single-walled carbon nanotubes (SWCNTs)
- 7.3.1. Properties
- 7.3.2. Markets and applications
- 7.3.3. Company profiles (152 company profiles)
- 7.4. Other types
- 7.4.1. Double-walled carbon nanotubes (DWNTs)
- 7.4.1.1. Properties
- 7.4.1.2. Applications
- 7.4.2. Vertically aligned CNTs (VACNTs)
- 7.4.2.1. Properties
- 7.4.2.2. Applications
- 7.4.3. Few-walled carbon nanotubes (FWNTs)
- 7.4.3.1. Properties
- 7.4.3.2. Applications
- 7.4.4. Carbon Nanohorns (CNHs)
- 7.4.4.1. Properties
- 7.4.4.2. Applications
- 7.4.5. Carbon Onions
- 7.4.5.1. Properties
- 7.4.5.2. Applications
- 7.4.6. Boron Nitride nanotubes (BNNTs)
- 7.4.6.1. Properties
- 7.4.6.2. Applications
- 7.4.6.3. Production
- 7.4.7. Companies (6 company profiles)
- 7.4.1. Double-walled carbon nanotubes (DWNTs)
8. CARBON NANOFIBERS
- 8.1. Properties
- 8.2. Synthesis
- 8.2.1. Chemical vapor deposition
- 8.2.2. Electrospinning
- 8.2.3. Template-based
- 8.2.4. From biomass
- 8.3. Markets
- 8.3.1. Energy storage
- 8.3.1.1. Batteries
- 8.3.1.2. Supercapacitors
- 8.3.1.3. Fuel cells
- 8.3.2. CO2 capture
- 8.3.3. Composites
- 8.3.4. Filtration
- 8.3.5. Catalysis
- 8.3.6. Sensors
- 8.3.7. Electromagnetic Interference (EMI) Shielding
- 8.3.8. Biomedical
- 8.3.9. Concrete
- 8.3.1. Energy storage
- 8.4. Market analysis
- 8.4.1. Market Growth Drivers and Trends
- 8.4.2. Price and Costs Analysis
- 8.4.3. Supply Chain
- 8.4.4. Future Outlook
- 8.4.5. Addressable Market Size
- 8.4.6. Risks and Opportunities
- 8.5. Global market revenues
- 8.6. Companies (12 company profiles)
9. FULLERENES
- 9.1. Properties
- 9.2. Markets and applications
- 9.3. Technology Readiness Level (TRL)
- 9.4. Market analysis
- 9.4.1. Market Growth Drivers and Trends
- 9.4.2. Price and Costs Analysis
- 9.4.3. Supply Chain
- 9.4.4. Future Outlook
- 9.4.5. Customer Segmentation
- 9.4.6. Addressable Market Size
- 9.4.7. Risks and Opportunities
- 9.4.8. Global market demand
- 9.5. Producers (20 company profiles)
10. NANODIAMONDS
- 10.1. Introduction
- 10.2. Types
- 10.2.1. Detonation Nanodiamonds
- 10.2.2. Fluorescent nanodiamonds (FNDs)
- 10.3. Markets and applications
- 10.4. Market analysis
- 10.4.1. Market Growth Drivers and Trends
- 10.4.2. Regulations
- 10.4.3. Price and Costs Analysis
- 10.4.4. Supply Chain
- 10.4.5. Future Outlook
- 10.4.6. Risks and Opportunities
- 10.4.7. Global demand 2018-2035, tonnes
- 10.5. Company profiles (30 company profiles)
11. GRAPHENE QUANTUM DOTS
- 11.1. Comparison to quantum dots
- 11.2. Properties
- 11.3. Synthesis
- 11.3.1. Top-down method
- 11.3.2. Bottom-up method
- 11.4. Applications
- 11.5. Graphene quantum dots pricing
- 11.6. Graphene quantum dot producers (9 company profiles)
12. CARBON FOAM
- 12.1. Types
- 12.1.1. Carbon aerogels
- 12.1.1.1. Carbon-based aerogel composites
- 12.1.1. Carbon aerogels
- 12.2. Properties
- 12.3. Applications
- 12.4. Company profiles (9 company profiles)
13. DIAMOND-LIKE CARBON (DLC) COATINGS
- 13.1. Properties
- 13.2. Applications and markets
- 13.3. Global market size
- 13.4. Company profiles (9 company profiles)
14. ACTIVATED CARBON
- 14.1. Overview
- 14.2. Types
- 14.2.1. Powdered Activated Carbon (PAC)
- 14.2.2. Granular Activated Carbon (GAC)
- 14.2.3. Extruded Activated Carbon (EAC)
- 14.2.4. Impregnated Activated Carbon
- 14.2.5. Bead Activated Carbon (BAC
- 14.2.6. Polymer Coated Carbon
- 14.3. Production
- 14.3.1. Coal-based Activated Carbon
- 14.3.2. Wood-based Activated Carbon
- 14.3.3. Coconut Shell-based Activated Carbon
- 14.3.4. Fruit Stone and Nutshell-based Activated Carbon
- 14.3.5. Polymer-based Activated Carbon
- 14.3.6. Activated Carbon Fibers (ACFs)
- 14.4. Markets and applications
- 14.4.1. Water Treatment
- 14.4.2. Air Purification
- 14.4.3. Food and Beverage Processing
- 14.4.4. Pharmaceutical and Medical Applications
- 14.4.5. Chemical and Petrochemical Industries
- 14.4.6. Mining and Precious Metal Recovery
- 14.4.7. Environmental Remediation
- 14.5. Market analysis
- 14.5.1. Market Growth Drivers and Trends
- 14.5.2. Regulations
- 14.5.3. Price and Costs Analysis
- 14.5.4. Supply Chain
- 14.5.5. Future Outlook
- 14.5.6. Customer Segmentation
- 14.5.7. Addressable Market Size
- 14.5.8. Risks and Opportunities
- 14.6. Global market revenues 2020-2035
- 14.7. Companies (22 company profiles)
15. CARBON AEROGELS AND XEROGELS
- 15.1. Overview
- 15.2. Types
- 15.2.1. Resorcinol-Formaldehyde (RF) Carbon Aerogels and Xerogels
- 15.2.2. Phenolic-Furfural (PF) Carbon Aerogels and Xerogels
- 15.2.3. Melamine-Formaldehyde (MF) Carbon Aerogels and Xerogels
- 15.2.4. Biomass-derived Carbon Aerogels and Xerogels
- 15.2.5. Doped Carbon Aerogels and Xerogels
- 15.2.6. Composite Carbon Aerogels and Xerogels
- 15.3. Markets and applications
- 15.3.1. Energy Storage
- 15.3.2. Thermal Insulation
- 15.3.3. Catalysis
- 15.3.4. Environmental Remediation
- 15.3.5. Other Applications
- 15.4. Market analysis
- 15.4.1. Market Growth Drivers and Trends
- 15.4.2. Regulations
- 15.4.3. Price and Costs Analysis
- 15.4.4. Supply Chain
- 15.4.5. Future Outlook
- 15.4.6. Customer Segmentation
- 15.4.7. Addressable Market Size
- 15.4.8. Risks and Opportunities
- 15.5. Global market
- 15.6. Companies(10 company profiles)
16. CARBON MATERIALS FROM CARBON CAPTURE AND UTILIZATION
- 16.1. CO2 capture from point sources
- 16.1.1. Transportation
- 16.1.2. Global point source CO2 capture capacities
- 16.1.3. By source
- 16.1.4. By endpoint
- 16.2. Main carbon capture processes
- 16.2.1. Materials
- 16.2.2. Post-combustion
- 16.2.3. Oxy-fuel combustion
- 16.2.4. Liquid or supercritical CO2: Allam-Fetvedt Cycle
- 16.2.5. Pre-combustion
- 16.3. Carbon separation technologies
- 16.3.1. Absorption capture
- 16.3.2. Adsorption capture
- 16.3.3. Membranes
- 16.3.4. Liquid or supercritical CO2 (Cryogenic) capture
- 16.3.5. Chemical Looping-Based Capture
- 16.3.6. Calix Advanced Calciner
- 16.3.7. Other technologies
- 16.3.7.1. Solid Oxide Fuel Cells (SOFCs)
- 16.3.8. Comparison of key separation technologies
- 16.3.9. Electrochemical conversion of CO2
- 16.3.9.1. Process overview
- 16.4. Direct air capture (DAC)
- 16.4.1. Description
- 16.5. Companies (4 company profiles)

