|
|
市場調査レポート
商品コード
1423509
説明可能なAI(XAI)の世界市場-2024-2031Global Explainable AI Market - 2024-2031 |
||||||
|
|
|||||||
カスタマイズ可能
適宜更新あり
|
|||||||


| 説明可能なAI(XAI)の世界市場-2024-2031 |
|
出版日: 2024年02月09日
発行: DataM Intelligence
ページ情報: 英文 245 Pages
納期: 即日から翌営業日
|

- 全表示
- 概要
- 目次
概要
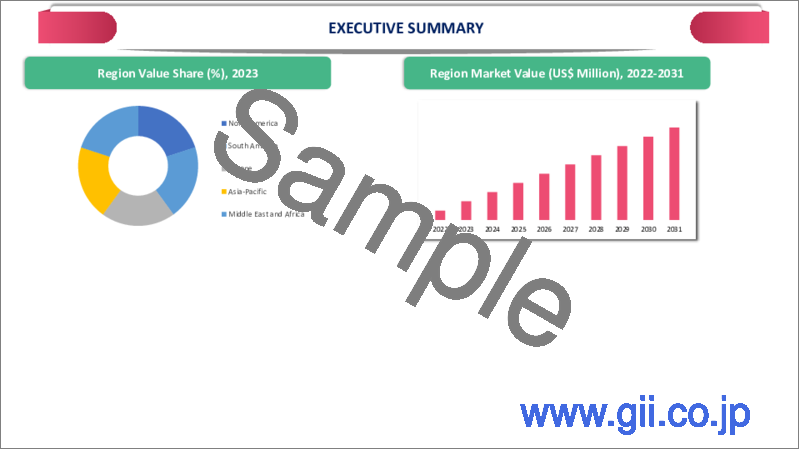
世界の説明可能なAI(XAI)市場は2023年に52億米ドルに達し、2031年には221億米ドルに達すると予測され、予測期間2024-2031年のCAGRは20.2%で成長します。
現在、国民の約28%がAIシステム全般を信頼したいと考えています。AIに対する信頼の欠如が拡大しているため、欧州連合(EU)と米国の両方で規制強化の要求が高まっています。規制当局は現在、AIモデルが特定のレベルの説明可能性を順守することを義務付ける法制化に向けて進んでおり、AIの結果を解釈し解明する能力を包含しているため、この要求は効果的なようです。
プロジェクト・インテリジェンスの主要プレーヤーによる製品投入の増加は、予測期間中の市場成長を後押しします。例えば、2022年12月30日、Digite, Inc.は、エンタープライズ・プロジェクト・インテリジェンス向けの世界初の説明可能なAI製品を発売しました。RISHIは、eXplainable AIと機械学習システムを統合したDigiteの先進的なエンタープライズ・プロジェクト・インテリジェンス製品です。CXO、デリバリー責任者、PMO、意思決定者向けに開発されたRISHIは、Digiteの広範なIT分野の経験に由来する知識システムと最先端のML機能を組み合わせたものです。
北米は、金融分野における説明可能なAIの採用が拡大しているため、市場を独占している地域です。説明可能なAIに対する政府のイニシアチブの高まりが、予測期間中の同地域の市場成長を後押ししています。説明可能な人工知能とも呼ばれる深層学習の不透明な性質の理解を向上させるアプローチは、需要が高まっています。
米国国防高等研究計画庁とAssociation for Computing MachineryのFairness, Accountability and Transparency会議は、説明可能なAI活動の2つの顕著な例です。医療画像の分野では、Computer-Assisted Interventionが主催し、International Conference on Medical Image Computingでは、医療画像コンピューティングにおける機械知能の解釈可能性をテーマとした年次セッションが開催されています。
ダイナミクス
リスク管理における説明可能なAI(XAI)の採用拡大
銀行、ヘルスケア、サイバーセキュリティを含む多くのビジネスで重要なのはリスク管理です。説明可能なAIのアプローチがリスク評価や意思決定プロセスでますます使用されるようになるにつれ、組織はAIモデルがどのように知見に到達するかについて理解を深めています。規制当局、顧客、社内の意思決定者は、このような信頼性の向上によって信頼が強化される利害関係者の一人です。
説明可能なAIシステムは、特に銀行やヘルスケアのような複雑な分野において、多くのビジネスで規制当局から求められています。説明可能なAIは、AI主導のアクションに理解しやすい正当性を提供し、組織が規制基準を遵守するのに役立ちます。説明可能なAIリスク管理システムの使用は、このような法律の遵守によってさらに促進されます。組織は、説明可能なAI技術を使用することで、リスク評価に使用されるAIモデルのバイアスやエラーを特定し、削減します。説明可能なAIは、モデルの予測に対する説明を提供することで、根底にあるバイアスや不正確さを認識することを支援します。これにより、組織は是正措置を講じ、リスク管理手順の精度と公平性を高めることができます。
4.O産業の急成長
第4次産業革命(4.0)産業の急速な拡大は、世界の説明可能AI市場の成長に大きく寄与しています。産業がデジタル変革を遂げ、AIのような先進技術を業務に統合するにつれ、透明で解釈可能なAIソリューションの必要性が極めて重要になっています。説明可能なAIは、信頼性、説明責任、規制遵守に関する懸念に対処し、4.0産業に不可欠なものとなっています。インダストリー4.0の原動力は、モノのインターネット(IoT)、人工知能(AI)、ビッグデータ分析などのデジタル技術を製造部門で活用することにあります。
インダストリー4.0が勢いを増すにつれ、製造業はかつてないレベルの効率化を経験しています。MPIグループによると、製造業者の32%は、インダストリー4.0がプロセス、工場、サプライチェーンに及ぼす影響により、収益性が10%以上向上すると予測しています。2023年に近づくにつれ、デジタル・エンゲージメントを活用して業務を強化する製造業者が増えています。具体的には、56%のメーカーが、品質指標のリアルタイム共有を促進するために、サプライヤーとのデジタル・エンゲージメントに前向きです。
AIモデルの複雑さ
洗練されたAIモデルは通常、熟練したデータサイエンティスト、計算能力、長い開発期間とトレーニング期間といった多大なリソースを必要とします。高額な開発費用と長期の時間枠は、リソースに制約のある中小企業や組織がAIモデルを採用することを躊躇させる可能性があります。
特に、膨大な計算リソースに依存していたり、膨大なデータ量を効率的に処理するのに苦労していたりする場合、実世界のシナリオで高度に複雑なAIモデルを展開すると、スケーラビリティの課題に直面する可能性があります。スケーラビリティの制約は、多様な業界や用途におけるAIモデルの普及を妨げる可能性があります。
AIモデルが複雑化すると、その解釈可能性と説明可能性は一般的に低下します。透明性の欠如は、規制上の義務や倫理的な懸念から、ヘルスケア、金融、法律分野など、解釈可能性が重要な分野での採用を妨げる可能性があります。複雑なAIモデルは、特定のタスクや領域において優れた性能を発揮することが多い一方で、性能と、解釈可能性、公平性、頑健性といった他の重要な要素とのバランスを取ることが難しい場合があります。これらの要素間のトレードオフは、複雑なAIモデルの実用的な適用を制限する可能性があります。
目次
第1章 調査手法と調査範囲
第2章 定義と概要
第3章 エグゼクティブサマリー
第4章 市場力学
- 影響要因
- 促進要因
- 技術の進歩
- 消費者のE-Waste意識の高まり
- 抑制要因
- 初期導入コストの高さ
- 機会
- 影響分析
- 促進要因
第5章 産業分析
- ポーターのファイブフォース分析
- サプライチェーン分析
- 価格分析
- 規制分析
- ロシア・ウクライナ戦争の影響分析
- DMIの見解
第6章 COVID-19分析
第7章 オファリング別
- ソリューション
- サービス別
第8章 展開別
- クラウド
- オンプレミス
第9章 組織規模別
- 中小企業
- 大企業
第10章 テクノロジー別
- 機械学習(ML)
- 自然言語処理(NLP)
- コンピュータ・ビジョン
- ビッグデータ分析
- その他
第11章 用途別
- 不正・異常検知
- 創薬・診断
- 予知保全
- サプライチェーン管理
- アイデンティティとアクセス管理
- その他
第12章 エンドユーザー別
- ヘルスケア
- BFSI
- 航空宇宙・防衛
- 小売・eコマース
- 公共部門と公益事業
- IT・通信
- 自動車
- その他
第13章 地域別
- 北米
- 米国
- カナダ
- メキシコ
- 欧州
- ドイツ
- 英国
- フランス
- イタリア
- スペイン
- その他欧州
- 南米
- ブラジル
- アルゼンチン
- その他南米
- アジア太平洋
- 中国
- インド
- 日本
- オーストラリア
- その他アジア太平洋地域
- 中東・アフリカ
第14章 競合情勢
- 競合シナリオ
- 市況/シェア分析
- M&A分析
第15章 企業プロファイル
- Kyndi
- 会社概要
- 製品ポートフォリオと説明
- 財務概要
- 主な発展
- Alphabet, Inc.
- IBM Corporation
- Microsoft Corporation
- Amelia US LLC
- BuildGroup
- DataRobot, Inc.
- Ditto AI Ltd
- DarwinAI
- Factmata
第16章 付録
Overview
Global Explainable AI Market reached US$ 5.2 Billion in 2023 and is expected to reach US$ 22.1 Billion by 2031, growing with a CAGR of 20.2% during the forecast period 2024-2031.
Nowadays about 28% of the citizens are willing to trust AI systems in general. The growing lack of trust in AI is prompting demands for heightened regulation in both the European Union (EU) and United States. The calls seem to be effective, as regulatory authorities are now progressing towards legislation mandating that AI models adhere to specific levels of explainability, encompassing the capacity to interpret and elucidate AI outcomes.
The growing product launches by the major key players for project intelligence help boost market growth over the forecast period. For instance, on December 30, 2022, Digite, Inc. launched the world's first Explainable AI product for Enterprise Project Intelligence. RISHI represents Digite's advanced Enterprise Project Intelligence product, integrating eXplainable AI and Machine Learning systems. Tailored for CXOs, Delivery Heads, PMOs and decision-makers, RISHI combines a knowledge system derived from Digite's extensive IT domain experience with state-of-the-art ML capabilities.
North America is a dominating region in the market due to the growing adoption of explainable AI in the finance sector. Growing Government's initiatives for explainable AI help to boost regional market growth over the forecast period. Approaches that improve understanding of the opaque nature of deep learning also referred to as explainable artificial intelligence are becoming more in demand.
U.S. Defence Advanced Research Projects Agency and the Association for Computing Machinery's Fairness, Accountability and Transparency conferences are two notable examples of explainable AI activities. Within the field of medical imaging Computer-Assisted Intervention hosts and the International Conference on Medical Image Computing an annual session devoted to the Interpretability of Machine Intelligence in Medical Image Computing.
Dynamics
Growing Adoption Of Explainable AI (XAI) For Risk Management
An important part of many businesses, including banking, healthcare and cybersecurity, is risk management. As explainable AI approaches are increasingly being used in risk assessment and decision-making processes organizations are gaining more understanding of how AI models arrive at their findings. Regulators, customers and internal decision-makers are among the stakeholders whose trust is strengthened by this increased authenticity.
Explicable AI systems are required by regulatory organizations in many businesses, particularly in complex fields like banking and healthcare. Explainable AI offers comprehensible justifications for AI-driven actions, which can help organizations comply with regulatory standards. The use of explainable AI risk management systems is further encouraged by this adherence to laws. Organizations identify and reduce biases and errors in AI models used for risk assessment by using explainable AI techniques. Explainable AI assists in recognizing underlying biases and inaccuracies by offering explanations for model predictions. The enables organizations to take corrective measures and enhance the precision and equity of risk management procedures.
Rapid growth in the 4.O industry
The rapid expansion of the Fourth Industrial Revolution (4.0) industry contributes significantly to the growth of the global Explainable AI market. As industries undergo digital transformation and integrate advanced technologies like AI into their operations, the need for transparent and interpretable AI solutions becomes crucial. Explainable AI addresses concerns related to trust, accountability and regulatory compliance, making it indispensable in the 4.0 industry. The driving force behind Industry 4.0 lies in the utilization of digital technologies, including the Internet of Things (IoT), Artificial Intelligence (AI) and big data analytics, within the manufacturing sector.
As Industry 4.0 gains momentum, manufacturers are experiencing unprecedented levels of efficiency. According to the MPI Group, 32% of manufacturers anticipate that Industry 4.0's influence on processes, plants and supply chains will lead to a profitability increase of over 10%. As we approach 2023, an increasing number of manufacturers are leveraging digital engagement to enhance their operations. Specifically, 56% of manufacturers are inclined to engage digitally with suppliers to facilitate real-time sharing of quality metrics.
Complexity of AI Models
Sophisticated AI models typically demand substantial resources such as proficient data scientists, computational capabilities and lengthy development and training periods. The elevated development expenses and extended timeframes may discourage smaller businesses or organizations with constrained resources from embracing AI models.
The deployment of highly intricate AI models in real-world scenarios can encounter scalability challenges, particularly if they rely on substantial computational resources or struggle to handle extensive data volumes efficiently. The scalability constraints may impede the widespread adoption of AI models across diverse industries and applications.
As AI models increase in complexity, their interpretability and explainability typically decrease. The lack of transparency can impede adoption in sectors where interpretability is vital, such as healthcare, finance and legal fields, due to regulatory mandates or ethical concerns. While complex AI models often excel in specific tasks or domains, they may encounter difficulties in achieving a balance between performance and other essential factors like interpretability, fairness and robustness. Trade-offs among these factors can restrict the practical applicability of complex AI models.
Segment Analysis
The global explainable AI market is segmented based on offering, deployment, organization size, technology, application, end-user and region.
Growing Demand for Explainable AI Services
Based on the offering, the explainable AI market is segmented into solutions and services. The explainable AI services segment accounted largest market share in the market due to its growing adoption in the finance sector. Rising regulations and compliance needs in sectors like finance, healthcare and retail are driving the requirement for AI systems capable of offering transparent and interpretable explanations for their decisions. Both businesses and consumers are seeking AI systems they can trust and comprehend and explainable AI services play a crucial role in providing transparency into the decision-making processes of AI models, thereby fostering trust and confidence in their utilization.
Some of the major key players in the market follow merger and acquisition strategies to expand their explainable AI operations in the finance industry. For instance, on December 07, 2022, Deutsche Bank partnered with NVIDIA to embed AI into Financial Services. The partnership helps to accelerate the use of AI to improve financial services. Deutsche Bank and NVIDIA have partnered to develop applications aimed at enhancing risk management, increasing operational efficiency and improving customer service through the utilization of NVIDIA AI Enterprise software.
Geographical Penetration
North America is Dominating the Explainable AI Market
North America has a well-established ecosystem that supports the growth of the technical industry. The includes a strong network of academic institutions, startups, research centers and established corporations collaborating on AI research and development. Growing demand for cutting-edge AI solutions in North America further helps to boost regional market growth. Collaboration between industry players, research institutions and government bodies can foster innovation and the widespread adoption of Explainable AI. North America has a history of such collaborations, driving advancements in technology.
The growing adoption of the explainable AI in the finance sector of North America helps to boost regional market growth. Financial services firms are progressively leveraging artificial intelligence to create solutions that bolster their operations, encompassing tasks such as credit score assignments, liquidity balance predictions and optimization of investment portfolios. AI enhances the speed, accuracy and efficiency of human endeavors associated with these processes, automating labor-intensive data management tasks.
Competitive Landscape
The major global players in the market include Kyndi, Alphabet, Inc., IBM Corporation, Microsoft Corporation, Amelia US LLC, BuildGroup, DataRobot, Inc., Ditto AI Ltd, DarwinAI and Factmata.
COVID-19 Impact Analysis
The COVID-19 pandemic has caused disruptions in supply chains that affect the production and distribution of technology components of explainable AI. The impacted the availability of software and hardware necessary for Explainable AI solutions. Organizations slow down or may postpone their adoption of Explainable AI technologies due to economic uncertainties and a focus on immediate operational needs.
The shift to remote work may present challenges in implementing and maintaining Explainable AI systems, especially if they require on-site installations or extensive collaboration. The importance of the global health issue has accelerated the digital transformation of several companies. Demand for Explainable AI solutions to meet pandemic-related needs, including supply chain optimization or healthcare analytics spike. Financial limitations and the fluctuating state of the economy lead organizations to decide to evaluate their investments in emerging technologies, which could affect the adoption of Explainable AI.
Russia-Ukraine War Impact Analysis
Geopolitical tensions and conflicts disrupt global supply chains. If key players in the Explainable AI market have dependencies on resources, components or talent from the regions affected by the conflict, it may lead to supply chain disruptions. Geopolitical instability often contributes to economic uncertainty. Businesses may become more cautious in their investments and decision-making, potentially affecting the demand for Explainable AI solutions.
Wars and geopolitical events can impact currency values. Changes in currency values have the potential to impact the expenses associated with importing and exporting technology, thereby influencing pricing strategies on a global scale. Geopolitical occurrences often result in alterations to regulations, trade policies and data protection laws. Entities engaged in the Explainable AI market may find it necessary to adjust to emerging regulatory landscapes. The confrontation between Russia and Ukraine has wider global ramifications, impacting markets around the globe.
By Offering
- Solution
- Services
By Deployment
- Cloud
- On-premises
By Organization Size
- Small and Medium-sized Enterprises
- Large Enterprises
By Technology
- Machine Learning (ML)
- Natural Language Processing (NLP)
- Computer Vision
- Big Data Analytics
- Others
By Application
- Fraud and Anomaly Detection
- Drug Discovery and Diagnostics
- Predictive Maintenance
- Supply Chain Management
- Identity and Access Management
- Others
By End-User
- Healthcare
- BFSI
- Aerospace and Defense
- Retail and E-commerce
- Public Sector and Utilities
- IT and Telecommunication
- Automotive
- Others
By Region
- North America
- U.S.
- Canada
- Mexico
- Europe
- Germany
- UK
- France
- Italy
- Spain
- Rest of Europe
- South America
- Brazil
- Argentina
- Rest of South America
- Asia-Pacific
- China
- India
- Japan
- Australia
- Rest of Asia-Pacific
- Middle East and Africa
Key Developments
- On July 05, 2023, Fujitsu collaborated with Informa D&B to incorporate explainable AI technology for financial-commercial information industry. The partnership heralds a new era in decision-making by integrating explainable AI technology.
- On September 06, 2023, Temenos launched Generative AI solution for banks using Generative Artificial Intelligence (AI) to automatically classify customers' banking transactions. The categorization of transactions assists banks in delivering personalized insights and recommendations, creating more captivating and user-friendly digital banking experiences and fostering customer loyalty by presenting more pertinent products and offers.
- On December 30, 2022, Digite, Inc. launched RISHI-XAI the world's first EXplainable AI product for Enterprise Project Intelligence. RISHI, Digite's advanced Enterprise Project Intelligence product with eXplainable AI capabilities, is designed to meet the needs of CXOs, Delivery Heads, PMOs and other decision-makers. It integrates a knowledge system derived from Digite's extensive domain expertise in IT, a state-of-the-art Machine Learning (ML) system and eXplainable AI.
Why Purchase the Report?
- To visualize the global explainable AI market segmentation based on offering, deployment, organization size, technology, application, end-user and region, as well as understand key commercial assets and players.
- Identify commercial opportunities by analyzing trends and co-development.
- Excel data sheet with numerous data points of explainable AI market-level with all segments.
- PDF report consists of a comprehensive analysis after exhaustive qualitative interviews and an in-depth study.
- Product mapping available as excel consisting of key products of all the major players.
The global explainable AI market report would provide approximately 86 tables, 90 figures and 245 Pages.
Target Audience 2024
- Manufacturers/ Buyers
- Industry Investors/Investment Bankers
- Research Professionals
- Emerging Companies
Table of Contents
1. Methodology and Scope
- 1.1. Research Methodology
- 1.2. Research Objective and Scope of the Report
2. Definition and Overview
3. Executive Summary
- 3.1. Snippet by Offering
- 3.2. Snippet by Deployment
- 3.3. Snippet by Organization Size
- 3.4. Snippet by Technology
- 3.5. Snippet by Application
- 3.6. Snippet by End-User
- 3.7. Snippet by Region
4. Dynamics
- 4.1. Impacting Factors
- 4.1.1. Drivers
- 4.1.1.1. Growing Technological Advancements
- 4.1.1.2. Growing Consumer's E-Waste Awareness
- 4.1.2. Restraints
- 4.1.2.1. Initial High Implementation Costs
- 4.1.3. Opportunity
- 4.1.4. Impact Analysis
- 4.1.1. Drivers
5. Industry Analysis
- 5.1. Porter's Five Force Analysis
- 5.2. Supply Chain Analysis
- 5.3. Pricing Analysis
- 5.4. Regulatory Analysis
- 5.5. Russia-Ukraine War Impact Analysis
- 5.6. DMI Opinion
6. COVID-19 Analysis
- 6.1. Analysis of COVID-19
- 6.1.1. Scenario Before COVID
- 6.1.2. Scenario During COVID
- 6.1.3. Scenario Post COVID
- 6.2. Pricing Dynamics Amid COVID-19
- 6.3. Demand-Supply Spectrum
- 6.4. Government Initiatives Related to the Market During Pandemic
- 6.5. Manufacturers Strategic Initiatives
- 6.6. Conclusion
7. By Offering
- 7.1. Introduction
- 7.1.1. Market Size Analysis and Y-o-Y Growth Analysis (%), By Offering
- 7.1.2. Market Attractiveness Index, By Offering
- 7.2. Solution*
- 7.2.1. Introduction
- 7.2.2. Market Size Analysis and Y-o-Y Growth Analysis (%)
- 7.3. Services
8. By Deployment
- 8.1. Introduction
- 8.1.1. Market Size Analysis and Y-o-Y Growth Analysis (%), By Deployment
- 8.1.2. Market Attractiveness Index, By Deployment
- 8.2. Cloud*
- 8.2.1. Introduction
- 8.2.2. Market Size Analysis and Y-o-Y Growth Analysis (%)
- 8.3. On-premises
9. By Organization Size
- 9.1. Introduction
- 9.1.1. Market Size Analysis and Y-o-Y Growth Analysis (%), By Organization Size
- 9.1.2. Market Attractiveness Index, By Organization Size
- 9.2. Small and Medium-sized Enterprises*
- 9.2.1. Introduction
- 9.2.2. Market Size Analysis and Y-o-Y Growth Analysis (%)
- 9.3. Large Enterprises
10. By Technology
- 10.1. Introduction
- 10.1.1. Market Size Analysis and Y-o-Y Growth Analysis (%), By Technology
- 10.1.2. Market Attractiveness Index, By Technology
- 10.2. Machine Learning (ML)*
- 10.2.1. Introduction
- 10.2.2. Market Size Analysis and Y-o-Y Growth Analysis (%)
- 10.3. Natural Language Processing (NLP)
- 10.4. Computer Vision
- 10.5. Big Data Analytics
- 10.6. Others
11. By Application
- 11.1. Introduction
- 11.1.1. Market Size Analysis and Y-o-Y Growth Analysis (%), By Application
- 11.1.2. Market Attractiveness Index, By Application
- 11.2. Fraud and Anomaly Detection*
- 11.2.1. Introduction
- 11.2.2. Market Size Analysis and Y-o-Y Growth Analysis (%)
- 11.3. Drug Discovery and Diagnostics
- 11.4. Predictive Maintenance
- 11.5. Supply Chain Management
- 11.6. Identity and Access Management
- 11.7. Others
12. By End-User
- 12.1. Introduction
- 12.1.1. Market Size Analysis and Y-o-Y Growth Analysis (%), By End-User
- 12.1.2. Market Attractiveness Index, By End-User
- 12.2. Healthcare*
- 12.2.1. Introduction
- 12.2.2. Market Size Analysis and Y-o-Y Growth Analysis (%)
- 12.3. BFSI
- 12.4. Aerospace and Defense
- 12.5. Retail and E-commerce
- 12.6. Public Sector and Utilities
- 12.7. IT and Telecommunication
- 12.8. Automotive
- 12.9. Others
13. By Region
- 13.1. Introduction
- 13.1.1. Market Size Analysis and Y-o-Y Growth Analysis (%), By Region
- 13.1.2. Market Attractiveness Index, By Region
- 13.2. North America
- 13.2.1. Introduction
- 13.2.2. Key Region-Specific Dynamics
- 13.2.3. Market Size Analysis and Y-o-Y Growth Analysis (%), By Offering
- 13.2.4. Market Size Analysis and Y-o-Y Growth Analysis (%), By Deployment
- 13.2.5. Market Size Analysis and Y-o-Y Growth Analysis (%), By Organization Size
- 13.2.6. Market Size Analysis and Y-o-Y Growth Analysis (%), By Technology
- 13.2.7. Market Size Analysis and Y-o-Y Growth Analysis (%), By Application
- 13.2.8. Market Size Analysis and Y-o-Y Growth Analysis (%), By End-User
- 13.2.9. Market Size Analysis and Y-o-Y Growth Analysis (%), By Country
- 13.2.9.1. U.S.
- 13.2.9.2. Canada
- 13.2.9.3. Mexico
- 13.3. Europe
- 13.3.1. Introduction
- 13.3.2. Key Region-Specific Dynamics
- 13.3.3. Market Size Analysis and Y-o-Y Growth Analysis (%), By Offering
- 13.3.4. Market Size Analysis and Y-o-Y Growth Analysis (%), By Deployment
- 13.3.5. Market Size Analysis and Y-o-Y Growth Analysis (%), By Organization Size
- 13.3.6. Market Size Analysis and Y-o-Y Growth Analysis (%), By Technology
- 13.3.7. Market Size Analysis and Y-o-Y Growth Analysis (%), By Application
- 13.3.8. Market Size Analysis and Y-o-Y Growth Analysis (%), By End-User
- 13.3.9. Market Size Analysis and Y-o-Y Growth Analysis (%), By Country
- 13.3.9.1. Germany
- 13.3.9.2. UK
- 13.3.9.3. France
- 13.3.9.4. Italy
- 13.3.9.5. Spain
- 13.3.9.6. Rest of Europe
- 13.4. South America
- 13.4.1. Introduction
- 13.4.2. Key Region-Specific Dynamics
- 13.4.3. Market Size Analysis and Y-o-Y Growth Analysis (%), By Offering
- 13.4.4. Market Size Analysis and Y-o-Y Growth Analysis (%), By Deployment
- 13.4.5. Market Size Analysis and Y-o-Y Growth Analysis (%), By Organization Size
- 13.4.6. Market Size Analysis and Y-o-Y Growth Analysis (%), By Technology
- 13.4.7. Market Size Analysis and Y-o-Y Growth Analysis (%), By Application
- 13.4.8. Market Size Analysis and Y-o-Y Growth Analysis (%), By End-User
- 13.4.9. Market Size Analysis and Y-o-Y Growth Analysis (%), By Country
- 13.4.9.1. Brazil
- 13.4.9.2. Argentina
- 13.4.9.3. Rest of South America
- 13.5. Asia-Pacific
- 13.5.1. Introduction
- 13.5.2. Key Region-Specific Dynamics
- 13.5.3. Market Size Analysis and Y-o-Y Growth Analysis (%), By Offering
- 13.5.4. Market Size Analysis and Y-o-Y Growth Analysis (%), By Deployment
- 13.5.5. Market Size Analysis and Y-o-Y Growth Analysis (%), By Organization Size
- 13.5.6. Market Size Analysis and Y-o-Y Growth Analysis (%), By Technology
- 13.5.7. Market Size Analysis and Y-o-Y Growth Analysis (%), By Application
- 13.5.8. Market Size Analysis and Y-o-Y Growth Analysis (%), By End-User
- 13.5.9. Market Size Analysis and Y-o-Y Growth Analysis (%), By Country
- 13.5.9.1. China
- 13.5.9.2. India
- 13.5.9.3. Japan
- 13.5.9.4. Australia
- 13.5.9.5. Rest of Asia-Pacific
- 13.6. Middle East and Africa
- 13.6.1. Introduction
- 13.6.2. Key Region-Specific Dynamics
- 13.6.3. Market Size Analysis and Y-o-Y Growth Analysis (%), By Offering
- 13.6.4. Market Size Analysis and Y-o-Y Growth Analysis (%), By Deployment
- 13.6.5. Market Size Analysis and Y-o-Y Growth Analysis (%), By Organization Size
- 13.6.6. Market Size Analysis and Y-o-Y Growth Analysis (%), By Technology
- 13.6.7. Market Size Analysis and Y-o-Y Growth Analysis (%), By Application
- 13.6.8. Market Size Analysis and Y-o-Y Growth Analysis (%), By End-User
14. Competitive Landscape
- 14.1. Competitive Scenario
- 14.2. Market Positioning/Share Analysis
- 14.3. Mergers and Acquisitions Analysis
15. Company Profiles
- 15.1. Kyndi*
- 15.1.1. Company Overview
- 15.1.2. Product Portfolio and Description
- 15.1.3. Financial Overview
- 15.1.4. Key Developments
- 15.2. Alphabet, Inc.
- 15.3. IBM Corporation
- 15.4. Microsoft Corporation
- 15.5. Amelia US LLC
- 15.6. BuildGroup
- 15.7. DataRobot, Inc.
- 15.8. Ditto AI Ltd
- 15.9. DarwinAI
- 15.10. Factmata
LIST NOT EXHAUSTIVE
16. Appendix
- 16.1. About Us and Services
- 16.2. Contact Us
