|
|
市場調査レポート
商品コード
1285054
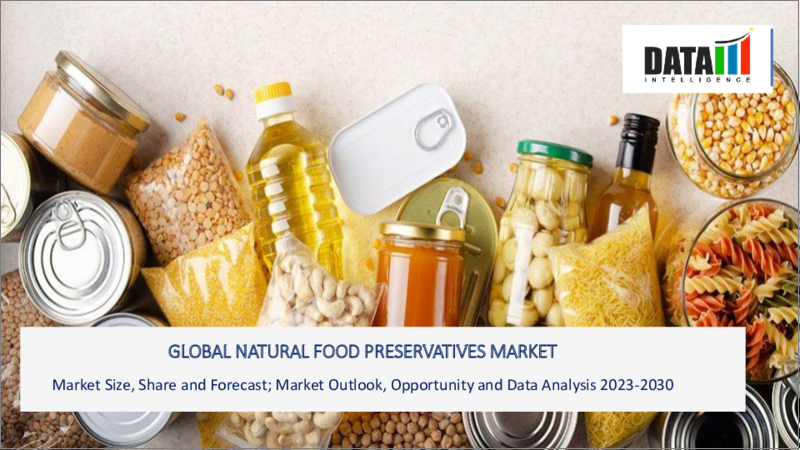
天然食品保存料の世界市場- 2023-2030年Global Natural Food Preservatives Market - 2023-2030 |
||||||
カスタマイズ可能
適宜更新あり
|
|||||||
| 天然食品保存料の世界市場- 2023-2030年 |
|
出版日: 2023年06月05日
発行: DataM Intelligence
ページ情報: 英文 190 Pages
納期: 即日から翌営業日
|
- 全表示
- 概要
- 目次
市場概要
世界の天然食品保存料市場は、2022年に11億3,300万米ドルに達し、2030年には最大17億6,600万米ドルに達することで有利な成長を遂げると予測されています。同市場は、予測期間中(2023年~2030年)に5.7%のCAGRを示すと予想されています。
食品を加工する際、安定性を高め、腐敗を防ぎ、保存期間を延ばすために、動植物由来の天然食品保存料が添加されます。薬草から作られる天然物質の抽出物、塩、砂糖、香辛料がこれらの保存料の主成分です。これらの保存料は、組織学的および栄養学的な品質を損なうことなく、微生物学的および安全性の品質を向上させます。
一般社会の健康志向の高まりにより、より良い選択肢を求める声が高まり、天然保存料の使用も増加しています。米国農務省は、2020年にはオーガニック食品の売上が12.4%増加すると予測しています。食品に含まれる化学農薬の存在がもたらす悪影響のため、消費者は健康志向を強めています。これらの要因が、天然食品保存料市場の成長を後押ししています。
市場力学
飲食品分野での消費者需要の増加が市場成長を牽引しています
消費者が台所に立つ時間を節約し、腐敗による出費を抑え、スケールメリットによるコストダウンを図るために三次加工や作成された食品は、コンビニエンスフードと呼ばれます。その結果、小売りのコンビニエンス・ミールの需要が高まっています。天然食品保存料の人気は、ミレニアル世代の人口の増加、働く女性の数の増加、多忙な仕事のスケジュール、外出先での消費パターンなどの要因によって、さらに後押しされています。
全米コンビニエンスストア協会の報告によると、コンビニエンスフードの売上増加により、天然食品保存料のニーズは2022年に13%上昇し、これも天然食品保存料市場の成長を促す要因となっています。
天然食品保存料に関連する健康リスクなど、潜在的な市場成長の障害となるもの
食品の鮮度、風味、保存性を維持するために、保存料は製造会社の在庫の中で重要な要素となっています。保存料の市場は、クイックフードや調理済み食品の人気の高まりに後押しされています。しかし、そのような食事に関連する重大な健康被害は、全体的な改善を阻害すると予想されます。プロピオン酸ナトリウム、カリウム、カルシウムなどの合成物質でできた保存料は、免疫系の異常、がん、肺の問題、心臓の問題、肺の問題などと関連しています。
世界保健機関(WHO)が報告した約1,000万人のがん関連死を考慮し、製造業者は保存料の使用を減らしており、これが天然食品保存料市場の拡大を遅らせています。さらに、米国疾病管理予防センター(CDC)によると、米国では毎年、食中毒により4,800万人が発症し、12万8000人が入院、3000人が死亡しており、食品保存料の使用が制限され、結果として市場の収益が低下しています。
COVID-19の影響分析
COVID-19分析では、COVID前シナリオ、COVIDシナリオ、COVID後シナリオに加え、価格ダイナミクス(パンデミック発生時および発生後の価格変動をCOVID前シナリオと比較)、需要-供給スペクトラム(取引制限、封鎖およびその後の問題による需要と供給のシフト)、政府イニシアティブ(政府機関による市場、分野、業界の活性化イニシアティブ)、メーカー戦略イニシアティブ(メーカーはCOVID問題の軽減のために何をしたかをここでカバー)。
目次
第1章 調査手法と範囲
- 調査手法
- 調査目的および調査範囲
第2章 市場の定義と概要
第3章 エグゼクティブサマリー
- 市場内訳:製品タイプ別
- 市場内訳:機能別
- 市場内訳:用途別
- 市場内訳:地域別
第4章 市場力学
- 市場影響要因
- 促進要因
- 抑制要因
- 機会
- 影響分析
第5章 産業分析
- ポーターのファイブフォース分析
- サプライチェーン分析
- 価格分析
- 法規制の分析
第6章 COVID-19の分析
- COVID-19の市場に関する分析
- COVID-19市場参入前のシナリオ
- COVID-19の市場導入時のシナリオ
- COVID-19の後、または将来のシナリオ
- COVID-19の中での価格・ダイナミクス
- 需給バランス
- パンデミック時の市場に関連する政府の取り組み
- メーカーの戦略的な取り組み
- サマリー
第7章 製品タイプ別
- 塩分
- 砂糖
- 油脂
- 蜂蜜
- クエン酸
- 酢
- その他
第8章 機能別
- 抗菌剤
- 酸化防止剤
- その他
第9章 用途別
- 海産物
- 食肉・家禽類
- ベーカリー製品
- 乳製品
- スナック菓子
- 飲料
- 野菜・果実
- その他
第10章 地域別
- 北米
- 米国
- カナダ
- メキシコ
- 欧州
- ドイツ
- 英国
- フランス
- イタリア
- スペイン
- その他欧州
- 南米
- ブラジル
- アルゼンチン
- その他南米地域
- アジア太平洋地域
- 中国
- インド
- 日本
- オーストラリア
- その他アジア太平洋地域
- 中東・アフリカ地域
第11章 競合情勢
- 競合シナリオ
- 市況/シェア分析
- M&A(合併・買収)分析
第12章 企業プロファイル
- Koninklijke DSM N.V
- 会社概要
- 製品ポートフォリオと説明
- 財務概要
- 主な発展状況
- Cargill, Inc
- Kemin Industries, Inc.
- Archer Daniels Midland Company
- Tate & Lyle PLC.
- BASF SE
- Corbion NV
- Galactic SA
- Biosecur Lab(Foodguard)
- ITA 3 S.r.l.
第13章 付録
Market Overview
The global natural food preservatives market reached US$ 1,133 million in 2022 and is projected to witness lucrative growth by reaching up to US$ 1,766 million by 2030. The market is expected to exhibit a CAGR of 5.7% during the forecast period (2023-2030).
The moment food is processed, natural food preservatives from plants and animals are added to increase stability, stop spoilage, and lengthen the shelf life of processed food products. Extracts of natural substances produced from medicinal plants, salt, sugar, and spices are the main components of these preservatives. They enhance the microbiological and safety quality without compromising the organoleptic and nutritional quality.
The general community's growing health consciousness has led to an increase in demand for better options, which has increased the use of natural preservatives. The United States Department of Agriculture estimates that in 2020, sales of organic food will increase by 12.4%. Due to the negative consequences brought on by the presence of chemical pesticides in food goods, consumers are becoming increasingly health-conscious. These factors are driving the natural food preservatives market growth.
Market Dynamics
Increasing Consumer Demand from the Food and Beverages Sector is Driving the Market Growth.
Foods that are tertiary processed or created to save consumers time in the kitchen, lower expenses due to spoilage, and lower costs through economies of scale are referred to as convenience foods. The demand for retail convenience meals has increased as a result. The popularity of natural food preservatives is further boosted by factors including the rising millennial population, the rise in the number of working women, hectic work schedules, and on-the-go consumption patterns.
The National Association of Convenience Stores reports that the need for natural food preservatives climbed by 13% in 2022 due to an increase in convenience food sales, which is another factor driving the natural food preservatives market growth.
Potential Market Growth Obstacles Include Health Risks Associated with Natural Food Preservatives
In order to preserve food's freshness, flavor, and shelf life, preservatives have become a crucial component of manufacturing companies' inventories. The market for preservatives is being pushed by the increase in popularity of quick or prepared foods. The significant health hazards connected to such diets, however, are anticipated to inhibit overall improvement. Preservatives made of synthetic materials, such as sodium, potassium, and calcium propionate, have been associated with immune system abnormalities, cancer, lung issues, cardiac issues, and lung problems.
In consideration of the about 10 million cancer-related deaths reported by the World Health Organisation, manufacturers are using fewer preservatives, which in turn is slowing the natural food preservatives market expansion. Additionally, according to the Centres for Disease Control and Prevention (CDC), foodborne illnesses in the United States result in 48 million illnesses, 128,000 hospital admissions, and 3,000 fatalities each year, which restricts the use of food preservative ingredients and consequently lowers market revenue.
COVID-19 Impact Analysis
The COVID-19 analysis includes Pre-COVID Scenario, COVID Scenario and Post-COVID Scenario along with pricing dynamics (including pricing change during and post-pandemic comparing it with pre-COVID scenarios), demand-supply spectrum (shift in demand and supply owing to trading restrictions, lockdown, and subsequent issues), government initiatives (initiatives to revive market, sector or industry by government bodies) and manufacturers strategic initiatives (what manufacturers did to mitigate the COVID issues will be covered here).
Segment Analysis
The global natural food preservatives market is segmented based on product type, function, application, and region.
Rising Demand for Meat and Poultry Products is Expected to Drive the Application Segment growth.
The global natural food preservatives market has been segmented by application into sea food, meat and poultry, bakery products, dairy products, snacks, beverages, fruits and vegetables, others. The meat and poultry segment held the largest natural food preservatives market share of 38.4% in 2022 in the natural food preservatives market analysis report.
According to World Animal Foundation, there were only 21% vegetarians in 2021. Considering the fact that a sizeable portion of the world's population is not vegetarian, the growth can be linked to enormous consumption. People's disposable income or purchasing power is increasing as globalization is dominating and trade between nations is booming. As a result, consumers' purchasing habits are changing, and more people are able to afford such expenditures. On the other hand, because meat has a short shelf life, preservatives must be used.
Geographical Analysis
The Increasing Demand for Natural Food Preservatives in Asia-Pacific Region.
The Asia-Pacific natural food preservatives market is regarded as the fastest growing region with market share of 32.5% in 2022 in the natural food preservatives market analysis. As urbanization, disposable income, and the working population is increasing in the region, demand for convenience and processed food is increasing among consumers. According to World Bank data from 2021, the per capita income in India was USD 1,053.77.
The demand for on-the-go food is increasing due to busy work schedules, resulting in an increase in the production of convenience foods and beverages. Furthermore, consumer awareness about clean-label and natural ingredients in food is growing, leading to an increase in demand for natural, organic, and plant-based additives and preservatives in the region.
Competitive Landscape
The major global players in the market include: Koninklijke DSM N. V, Cargill, Inc., Kemin Industries, Inc., Archer Daniels Midland Company, Tate & Lyle PLC., BASF SE, Corbion NV, Galactic SA, Biosecur Lab (Foodguard), and ITA 3 S.r.l.
Global Recession/Ukraine-Russia War/COVID-19, and Artificial Intelligence Impact Analysis:
COVID-19 Impact:
As a consequence of travel limitations brought on by the COVID-19 epidemic, retail and long-shelf products saw increased sales on the global market. As a result, the vast majority of people in the world are busy hoarding foodstuffs and other food items for their families. Due to the increase in demand for processed foods, this eventually had a favorable effect on the industrial need for food preservatives. Additionally, there has been an increase in the demand for ready-to-eat (RTE) meals, creating new business opportunities for businesses that produce food preservatives.
Why Purchase the Report?
- To visualize the global natural food preservatives market segmentation based on type, source, gender, application, distribution channel, and region, as well as understand key commercial assets and players.
- Identify commercial opportunities in the market by analyzing trends and co-development.
- Excel data sheet with numerous data points of natural food preservatives market-level with all segments.
- The PDF report consists of cogently put-together market analysis after exhaustive qualitative interviews and in-depth market study.
- Product mapping is available as Excel consists of key products of all the major market players.
The global natural food preservatives market report would provide approximately 93 tables, 109 figures and 190 Pages.
Target Audience 2023
- Manufacturers/ Buyers
- Industry Investors/Investment Bankers
- Research Professionals
- Emerging Companies
Table of Contents
1. Methodology and Scope
- 1.1. Research Methodology
- 1.2. Research Objective and Scope of the Report
2. Market Definition and Overview
3. Executive Summary
- 3.1. Market Snippet, by Product Type
- 3.2. Market Snippet, by Function
- 3.3. Market Snippet, by Application
- 3.4. Market Snippet, by Region
4. Market Dynamics
- 4.1. Market Impacting Factors
- 4.1.1. Drivers
- 4.1.2. Restraints
- 4.1.3. Opportunity
- 4.1.4. Impact Analysis
5. Industry Analysis
- 5.1. Porter's Five Forces Analysis
- 5.2. Supply Chain Analysis
- 5.3. Pricing Analysis
- 5.4. Regulatory Analysis
6. COVID-19 Analysis
- 6.1. Analysis of COVID-19 on the Market
- 6.1.1. Scenario Before COVID-19 Market
- 6.1.2. Scenario During COVID-19 Market
- 6.1.3. Post COVID-19 or Future Scenario
- 6.2. Pricing Dynamics Amid COVID-19
- 6.3. Demand-Supply Spectrum
- 6.4. Government Initiatives Related to the Market During Pandemic
- 6.5. Manufacturers Strategic Initiatives
- 6.6. Conclusion
7. By Product Type
- 7.1. Introduction
- 7.1.1. Market Size Analysis and Y-o-Y Growth Analysis (%), By Product Type
- 7.1.2. Market Attractiveness Index, By Product Type
- 7.2. Salt*
- 7.2.1. Introduction
- 7.2.2. Market Size Analysis and Y-o-Y Growth Analysis (%)
- 7.3. Sugar
- 7.4. Oil
- 7.5. Honey
- 7.6. Citric Acid
- 7.7. Vinegar
- 7.8. Others
8. By Function
- 8.1. Introduction
- 8.1.1. Market Size Analysis and Y-o-Y Growth Analysis (%), By Function
- 8.1.2. Market Attractiveness Index, By Function
- 8.2. Antimicrobial*
- 8.2.1. Introduction
- 8.2.2. Market Size Analysis and Y-o-Y Growth Analysis (%)
- 8.3. Antioxidants
- 8.4. Others
9. By Application
- 9.1. Introduction
- 9.1.1. Market Size Analysis and Y-o-Y Growth Analysis (%), By Application
- 9.1.2. Market Attractiveness Index, By Application
- 9.2. Sea Food
- 9.3. Meat and Poultry
- 9.4. Bakery Products
- 9.5. Dairy Products
- 9.6. Snacks
- 9.7. Beverages
- 9.8. Fruits and vegetables
- 9.9. Others
10. By Region
- 10.1. Introduction
- 10.1.1. Market Size Analysis and Y-o-Y Growth Analysis (%), By Region
- 10.1.2. Market Attractiveness Index, By Region
- 10.2. North America
- 10.2.1. Introduction
- 10.2.2. Key Region-Specific Dynamics
- 10.2.3. Market Size Analysis and Y-o-Y Growth Analysis (%), By Product Type
- 10.2.4. Market Size Analysis and Y-o-Y Growth Analysis (%), By Function
- 10.2.5. Market Size Analysis and Y-o-Y Growth Analysis (%), By Application
- 10.2.6. Market Size Analysis and Y-o-Y Growth Analysis (%), By Country
- 10.2.6.1. The U.S.
- 10.2.6.2. Canada
- 10.2.6.3. Mexico
- 10.3. Europe
- 10.3.1. Introduction
- 10.3.2. Key Region-Specific Dynamics
- 10.3.3. Market Size Analysis and Y-o-Y Growth Analysis (%), By Product Type
- 10.3.4. Market Size Analysis and Y-o-Y Growth Analysis (%), By Function
- 10.3.5. Market Size Analysis and Y-o-Y Growth Analysis (%), By Application
- 10.3.6. Market Size Analysis and Y-o-Y Growth Analysis (%), By Country
- 10.3.6.1. Germany
- 10.3.6.2. The U.K.
- 10.3.6.3. France
- 10.3.6.4. Italy
- 10.3.6.5. Spain
- 10.3.6.6. Rest of Europe
- 10.4. South America
- 10.4.1. Introduction
- 10.4.2. Key Region-Specific Dynamics
- 10.4.3. Market Size Analysis and Y-o-Y Growth Analysis (%), By Product Type
- 10.4.4. Market Size Analysis and Y-o-Y Growth Analysis (%), By Function
- 10.4.5. Market Size Analysis and Y-o-Y Growth Analysis (%), By Application
- 10.4.6. Market Size Analysis and Y-o-Y Growth Analysis (%), By Country
- 10.4.6.1. Brazil
- 10.4.6.2. Argentina
- 10.4.6.3. Rest of South America
- 10.5. Asia-Pacific
- 10.5.1. Introduction
- 10.5.2. Key Region-Specific Dynamics
- 10.5.3. Market Size Analysis and Y-o-Y Growth Analysis (%), By Product Type
- 10.5.4. Market Size Analysis and Y-o-Y Growth Analysis (%), By Function
- 10.5.5. Market Size Analysis and Y-o-Y Growth Analysis (%), By Application
- 10.5.6. Market Size Analysis and Y-o-Y Growth Analysis (%), By Country
- 10.5.6.1. China
- 10.5.6.2. India
- 10.5.6.3. Japan
- 10.5.6.4. Australia
- 10.5.6.5. Rest of Asia-Pacific
- 10.6. Middle East and Africa
- 10.6.1. Introduction
- 10.6.2. Key Region-Specific Dynamics
- 10.6.3. Market Size Analysis and Y-o-Y Growth Analysis (%), By Product Type
- 10.6.4. Market Size Analysis and Y-o-Y Growth Analysis (%), By Function
- 10.6.5. Market Size Analysis and Y-o-Y Growth Analysis (%), By Application
11. Competitive Landscape
- 11.1. Competitive Scenario
- 11.2. Market Positioning/Share Analysis
- 11.3. Mergers and Acquisitions Analysis
12. Company Profiles
- 12.1. Koninklijke DSM N.V
- 12.1.1. Company Overview
- 12.1.2. Product Portfolio and Description
- 12.1.3. Financial Overview
- 12.1.4. Key Developments
- 12.2. Cargill, Inc
- 12.3. Kemin Industries, Inc.
- 12.4. Archer Daniels Midland Company
- 12.5. Tate & Lyle PLC.
- 12.6. BASF SE
- 12.7. Corbion NV
- 12.8. Galactic SA
- 12.9. Biosecur Lab (Foodguard)
- 12.10. ITA 3 S.r.l.
LIST NOT EXHAUSTIVE
13. Appendix
- 13.1. About Us and Services
- 13.2. Contact Us


