|
|
市場調査レポート
商品コード
1769474
欧州のデータセンター冷却市場:製品別、用途別、国別 - 分析と予測(2025年~2035年)Europe Data Center Cooling Market: Focus on Product, Application, and Country-Level Analysis - Analysis and Forecast, 2025-2035 |
||||||
|
|||||||
カスタマイズ可能
|
|||||||


| 欧州のデータセンター冷却市場:製品別、用途別、国別 - 分析と予測(2025年~2035年) |
|
出版日: 2025年07月14日
発行: BIS Research
ページ情報: 英文 150 Pages
納期: 1~5営業日
|

全表示
- 概要
- 図表
- 目次
欧州のデータセンター冷却の市場規模は、2024年の67億6,000万米ドルから2035年には205億5,000万米ドルに達し、予測期間の202年~2035年のCAGRは10.18%になると予測されています。
データ世代の増加、クラウドコンピューティング、デジタルインフラの拡大が、欧州のデータセンター冷却産業を牽引しています。高性能コンピューティングのニーズが高まる中、機器の信頼性と稼働時間を維持するために効率的な冷却システムが不可欠となっています。EUの厳格な規則や持続可能性の目標が市場に影響を与え、低エネルギーで環境に優しい冷却技術への移行が進んでいます。同地域では、高額の初期投資やシステムの複雑さといった障害が依然として存在しますが、継続的な技術革新とエネルギー使用量削減へのプレッシャーの高まりにより、高度でエネルギー効率の高い冷却ソリューションの採用が加速しています。
| 主要市場統計 | |
|---|---|
| 予測期間 | 202年~2035年 |
| 2025年の評価 | 78億米ドル |
| 2035年の予測 | 205億5,000万米ドル |
| CAGR | 10.18% |
市場イントロダクション
欧州のデータセンター冷却市場は、人工知能、クラウドコンピューティング、データ生産に関連するワークロードの急激な増加により、急速に変化しています。データセンターが大規模化・複雑化する中で、ハードウェアの寿命、運用の継続性、規制への準拠を維持するためには、効果的な熱管理が不可欠となっています。冷却システムはデータセンター全体のエネルギー消費の最大40%を占める可能性があるため、エネルギー効率の高いソリューションは、この地域の事業者にとって戦略的な焦点となっています。
これには、環境にほとんど影響を与えずに高密度コンピューティングを管理するために作られた、ダイレクト・ツー・チップ・システム、液体冷却、自由空冷などが含まれます。EUの気候規則、再生可能エネルギー指令、欧州グリーン・ディールによって持続可能性が推進された結果、低炭素で水効率が高く、環境に優しい冷却技術がこの地域で普及しつつあります。
欧州の多様な気候は、冷房戦術にも影響を与えています。南部の国々では、暑い条件下でも効率を維持できる耐久性の高いソリューションが必要とされる一方、北部の地域では、機械システムへの依存を軽減するために、周囲の冷気から利益を得ることができます。欧州のデータセンター冷却市場は、規制圧力の高まりとデジタルインフラの成長に伴い、今後も革新と成長を続けると予想されます。
市場セグメンテーション
セグメンテーション1:エンドユーザー業界別
- IT・電気通信
- ヘルスケア
- 小売
- 銀行、金融サービス、保険
- 政府・公共機関
- 製造業
- その他
セグメンテーション2:データセンタータイプ別
- 集中型データセンター
- ハイパースケール
- コロケーション
- エンタープライズ
- エッジデータセンター
セグメンテーション3:応用分野別
- 人工知能(AI)
- 高性能コンピューティング(HPC)
- クラウド・コンピューティング
- エッジ・コンピューティング
- その他
セグメント4:ソリューション別
- 空冷
- エアコン
- エアハンドリングユニット
- チラー
- 冷却塔
- エコノマイザーシステム
- その他
- 液体冷却
- 直接冷却
- リアドア式熱交換器(RDHX)
- フリークーリング
セグメント5:ラック密度別
- 低ラック密度(1~4 kW)
- 中型ラック密度(5~9 kW)
- 高ラック密度(9 kW以上)
セグメンテーション6:国別
- ドイツ
- フランス
- 英国
- イタリア
- オランダ
- スペイン
- その他
欧州データセンター冷却市場の市場動向・促進要因・課題
- 高密度のAIおよびHPCワークロードを管理するための液冷および液浸冷却へのシフト
- ESGとカーボンニュートラルの目標を達成するため、エネルギー効率が高く持続可能な冷却システムへの注目が高まる
- 北欧のような寒冷地では、エネルギー消費を削減するために自由冷却とエコノマイザが採用されている
- リアルタイムの熱管理と予知保全のためのAIと自動化の利用拡大
- モジュール式およびプレハブ式冷却ソリューションの統合別迅速な導入と拡張性の向上
- 再生可能エネルギーと環境に優しい冷却技術別グリーンデータセンターの増加
市場促進要因
- データトラフィックとクラウドコンピューティング需要の急増が欧州全域でのデータセンター拡大を促進
- エネルギー効率に関する厳しいEU規制(EN50600、EUタクソノミーなど)が、事業者に環境に優しいソリューションの採用を促す
- 低炭素インフラ開発を支援する政府のインセンティブと持続可能性の義務化
- 運用コスト、特に冷却に関連するエネルギー費用(総エネルギー使用量の最大40%)を削減する必要性
- コンパクトで効率的な冷却システムを必要とするエッジデータセンターやコロケーション施設の増加
市場の課題
- 液浸や断熱システムなどの高度な冷却技術には高い初期費用がかかる
- 欧州各国における規制の複雑さとばらつき別コンプライアンスの難しさ
- 特に干ばつの影響を受けやすい地域での水使用に関する懸念が、水ベースの冷却の実行可能性を制限している
- 次世代冷却方式への移行を遅らせるレガシーインフラの制限
- 地域全体の冷却システム設計、統合、メンテナンスにおける熟練労働者の不足
製品/イノベーション戦略:当レポートは、欧州データセンター冷却市場の包括的な製品/イノベーション戦略を提供し、市場参入、技術採用、持続的成長の機会を特定します。当レポートは、企業が環境基準を満たし、競合優位性を獲得し、さまざまな業界で高まる環境に優しいソリューションへの需要を活用するための実用的な考察を提供します。
成長/マーケティング戦略:当レポートは、欧州データセンター冷却市場に特化して設計された包括的な成長・マーケティング戦略を提供します。特化した市場セグメントの特定、競合優位性の確立、市場シェアと財務業績の最適化を目指した創造的なマーケティング施策の実施など、的を絞ったアプローチを提示しています。これらの戦略的提言を活用することで、企業は市場での存在感を高め、新たな展望をつかみ、効率的に収益拡大を推進することができます。
競合戦略:当レポートは、欧州データセンター冷却市場に合わせた強力な競争戦略を構築します。市場のライバルを評価し、際立つための方法を提案し、競争力を維持するための指針を示します。これらの戦略的指針に従うことで、企業は市場競争の中で効果的なポジションを確立し、持続的な繁栄と収益性を確保することができます。
主要市場参入企業と競合情勢
欧州データセンター冷却市場でプロファイルされている企業は、主要専門家から収集した情報、企業のカバレッジ、製品ポートフォリオ、市場浸透度の分析に基づいて選定されています。
目次
エグゼクティブサマリー
第1章 市場
- 動向:現状と将来への影響評価
- データセンター冷却市場を形成する動向
- データ要件の増加
- 環境に優しい冷却システムの需要の増加
- 2024~2034年における液冷導入に向けたデータセンターの動向
- データセンター向け蒸発冷却市場の概要
- サプライチェーンの概要
- 研究開発レビュー
- エコシステムと進行中のプログラム
- 市場力学の概要
- 欧州データセンター冷却市場における主要スタートアップ企業
第2章 地域
- 地域サマリー
- 欧州
- 欧州の主要市場参入企業
- ビジネス上の促進要因
- ビジネス上の課題
- 用途
- 製品
- 欧州(国別)
第3章 競合ベンチマーキングと企業プロファイル
- 今後の見通し
- 地理的評価
- 競合情勢
- 企業プロファイル
- Schneider Electric
- Asetek, Inc.
- Submer
- Munters
- ALFA LAVAL
- Condair Group
- Danfoss
- Johnson Controls International plc
- STULZ GMBH
- DCX Liquid Cooling Systems
- Rittal GmbH & Co. KG
- その他の主要な市場参入企業
第4章 調査手法
List of Figures
- Figure 1: Data Center Cooling Market (by Region), $Billion, 2024, 2029, and 2035
- Figure 2: Europe Data Center Cooling Market (by End-Use Industry), $Billion 2024, 2029, and 2035
- Figure 3: Europe Data Center Cooling Market (by Data Center Type), $Billion, 2024, 2029, and 2035
- Figure 4: Europe Data Center Cooling Market (by Application Area), $Billion, 2024, 2029, and 2035
- Figure 5: Europe Data Center Cooling Market (by Solution), $Billion 2024, 2029, and 2035
- Figure 6: Europe Data Center Cooling Market (by Air Cooling), $Billion, 2024, 2029, and 2035
- Figure 7: Europe Data Center Cooling Market (by Liquid Cooling), $Billion, 2024, 2029, and 2035
- Figure 8: Europe Data Center Cooling Market (by Direct Liquid Cooling), $Billion, 2024, 2029, and 2035
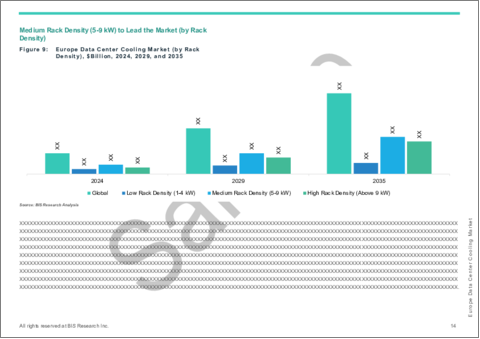
- Figure 9: Europe Data Center Cooling Market (by Rack Density), $Billion, 2024, 2029, and 2035
- Figure 10: Europe Data Center Cooling Market, Recent Developments
- Figure 11: Projected Growth in Global Data Center Power Demand (including and excluding AI), 2021-2030
- Figure 12: Global Population Coverage by Technology, 2023 and 2029
- Figure 13: Future Market Analysis: Estimated Share of Liquid Cooling Deployment in Global Data Centers with AI Workload Impact, 2024-2034
- Figure 14: Europe Evaporative Cooling Market for Data Center, $Million, 2024-2035
- Figure 15: Historical Analysis: Estimated Number of Evaporative Cooling Deployed Data Centers Globally (2018-2022)
- Figure 16: Supply Chain Analysis for Data Center Cooling Market
- Figure 17: Patent Filed (by Country), January 2021-April 2025
- Figure 18: Patent Filed (by Company), January 2021-April 2025
- Figure 19: Impact Analysis of Data Center Cooling Market Navigating Factors, 2023-2034
- Figure 20: Outages Costing over $1 Million Increasing, 2019-2024
- Figure 21: Cost Comparison of Traditional Cooling vs. Liquid Cooling Systems
- Figure 22: Information Technology (IT) Spending on Data Centers, 2012 to 2023
- Figure 23: Water Utility and Wastewater Cost Comparison in Data Center
- Figure 24: Improved PUE with Data Center's Free Cooling System Retrofit
- Figure 25: Power Usage Efficiency Comparison
- Figure 26: Suppliers' Expected Number of Edge Data Centers Expansion from 2021 to 2024
- Figure 27: Germany Data Center Cooling Market, $Billion, 2024-2035
- Figure 28: France Data Center Cooling Market, $Billion, 2024-2035
- Figure 29: U.K. Data Center Cooling Market, $Billion, 2024-2035
- Figure 30: Italy Data Center Cooling Market, $Billion, 2024-2035
- Figure 31: Netherlands Data Center Cooling Market, $Billion, 2024-2035
- Figure 32: Spain Data Center Cooling Market, $Billion, 2024-2035
- Figure 33: Rest-of-Europe Data Center Cooling Market, $Billion, 2024-2035
- Figure 34: Strategic Initiatives, January 2021-July 2024
- Figure 35: Share of Strategic Initiatives, January 2021-July 2024
- Figure 36: Data Triangulation
- Figure 37: Top-Down and Bottom-Up Approach
- Figure 38: Assumptions and Limitations
List of Tables
- Table 1: Market Snapshot
- Table 2: Europe Data Center Cooling Market, Opportunities
- Table 3: Key Associations and Consortiums in the Data Center Cooling Market
- Table 4: Government Programs and Initiatives Landscape
- Table 5: Claimed AI-Based Energy-Saving Effects for HVAC Systems across Different Companies
- Table 6: Key Start-Ups in the Europe Data Center Cooling Market
- Table 7: Data Center Cooling Market (by Region), $Billion, 2024-2035
- Table 8: Europe Data Center Cooling Market (by End-Use Industry), $Billion, 2024-2035
- Table 9: Europe Data Center Cooling Market (by Data Center Type), $Billion, 2024-2035
- Table 10: Europe Data Center Cooling Market (by Centralized Data Center), $Billion, 2024-2035
- Table 11: Europe Data Center Cooling Market (by Application Area), $Billion, 2024-2035
- Table 12: Europe Data Center Cooling Market (by Solution), $Billion, 2024-2035
- Table 13: Europe Data Center Cooling Market (by Air Cooling), $Billion, 2024-2035
- Table 14: Europe Data Center Cooling Market (by Liquid Cooling), $Billion, 2024-2035
- Table 15: Europe Data Center Cooling Market (by Direct), $Billion, 2024-2035
- Table 16: Europe Data Center Cooling Market (by Rack Density), $Billion, 2024-2035
- Table 17: Germany Data Center Cooling Market (by End-Use Industry), $Billion, 2024-2035
- Table 18: Germany Data Center Cooling Market (by Data Center Type), $Billion, 2024-2035
- Table 19: Germany Data Center Cooling Market (by Centralized Data Center), $Billion, 2024-2035
- Table 20: Germany Data Center Cooling Market (by Application Area), $Billion, 2024-2035
- Table 21: Germany Data Center Cooling Market (by Solution), $Billion, 2024-2035
- Table 22: Germany Data Center Cooling Market (by Air Cooling), $Billion, 2024-2035
- Table 23: Germany Data Center Cooling Market (by Liquid Cooling), $Billion, 2024-2035
- Table 24: Germany Data Center Cooling Market (by Direct), $Billion, 2024-2035
- Table 25: Germany Data Center Cooling Market (by Rack Density), $Billion, 2024-2035
- Table 26: France Data Center Cooling Market (by End-Use Industry), $Billion, 2024-2035
- Table 27: France Data Center Cooling Market (by Data Center Type), $Billion, 2024-2035
- Table 28: France Data Center Cooling Market (by Centralized Data Center), $Billion, 2024-2035
- Table 29: France Data Center Cooling Market (by Application Area), $Billion, 2024-2035
- Table 30: France Data Center Cooling Market (by Solution), $Billion, 2024-2035
- Table 31: France Data Center Cooling Market (by Air Cooling), $Billion, 2024-2035
- Table 32: France Data Center Cooling Market (by Liquid Cooling), $Billion, 2024-2035
- Table 33: France Data Center Cooling Market (by Direct), $Billion, 2024-2035
- Table 34: France Data Center Cooling Market (by Rack Density), $Billion, 2024-2035
- Table 35: U.K. Data Center Cooling Market (by End-Use Industry), $Billion, 2024-2035
- Table 36: U.K. Data Center Cooling Market (by Data Center Type), $Billion, 2024-2035
- Table 37: U.K. Data Center Cooling Market (by Centralized Data Center), $Billion, 2024-2035
- Table 38: U.K. Data Center Cooling Market (by Application Area), $Billion, 2024-2035
- Table 39: U.K. Data Center Cooling Market (by Solution), $Billion, 2024-2035
- Table 40: U.K. Data Center Cooling Market (by Air Cooling), $Billion, 2024-2035
- Table 41: U.K. Data Center Cooling Market (by Liquid Cooling), $Billion, 2024-2035
- Table 42: U.K. Data Center Cooling Market (by Direct), $Billion, 2024-2035
- Table 43: U.K. Data Center Cooling Market (by Rack Density), $Billion, 2024-2035
- Table 44: Italy Data Center Cooling Market (by End-Use Industry), $Billion, 2024-2035
- Table 45: Italy Data Center Cooling Market (by Data Center Type), $Billion, 2024-2035
- Table 46: Italy Data Center Cooling Market (by Centralized Data Center), $Billion, 2024-2035
- Table 47: Italy Data Center Cooling Market (by Application Area), $Billion, 2024-2035
- Table 48: Italy Data Center Cooling Market (by Solution), $Billion, 2024-2035
- Table 49: Italy Data Center Cooling Market (by Air Cooling), $Billion, 2024-2035
- Table 50: Italy Data Center Cooling Market (by Liquid Cooling), $Billion, 2024-2035
- Table 51: Italy Data Center Cooling Market (by Direct), $Billion, 2024-2035
- Table 52: Italy Data Center Cooling Market (by Rack Density), $Billion, 2024-2035
- Table 53: Netherlands Data Center Cooling Market (by End-Use Industry), $Billion, 2024-2035
- Table 54: Netherlands Data Center Cooling Market (by Data Center Type), $Billion, 2024-2035
- Table 55: Netherlands Data Center Cooling Market (by Centralized Data Center), $Billion, 2024-2035
- Table 56: Netherlands Data Center Cooling Market (by Application Area), $Billion, 2024-2035
- Table 57: Netherlands Data Center Cooling Market (by Solution), $Billion, 2024-2035
- Table 58: Netherlands Data Center Cooling Market (by Air Cooling), $Billion, 2024-2035
- Table 59: Netherlands Data Center Cooling Market (by Liquid Cooling), $Billion, 2024-2035
- Table 60: Netherlands Data Center Cooling Market (by Direct), $Billion, 2024-2035
- Table 61: Netherlands Data Center Cooling Market (by Rack Density), $Billion, 2024-2035
- Table 62: Spain Data Center Cooling Market (by End-Use Industry), $Billion, 2024-2035
- Table 63: Spain Data Center Cooling Market (by Data Center Type), $Billion, 2024-2035
- Table 64: Spain Data Center Cooling Market (by Centralized Data Center), $Billion, 2024-2035
- Table 65: Spain Data Center Cooling Market (by Application Area), $Billion, 2024-2035
- Table 66: Spain Data Center Cooling Market (by Solution), $Billion, 2024-2035
- Table 67: Spain Data Center Cooling Market (by Air Cooling), $Billion, 2024-2035
- Table 68: Spain Data Center Cooling Market (by Liquid Cooling), $Billion, 2024-2035
- Table 69: Spain Data Center Cooling Market (by Direct), $Billion, 2024-2035
- Table 70: Spain Data Center Cooling Market (by Rack Density), $Billion, 2024-2035
- Table 71: Rest-of-Europe Data Center Cooling Market (by End-Use Industry), $Billion, 2024-2035
- Table 72: Rest-of-Europe Data Center Cooling Market (by Data Center Type), $Billion, 2024-2035
- Table 73: Rest-of-Europe Data Center Cooling Market (by Centralized Data Center), $Billion, 2024-2035
- Table 74: Rest-of-Europe Data Center Cooling Market (by Application Area), $Billion, 2024-2035
- Table 75: Rest-of-Europe Data Center Cooling Market (by Solution), $Billion, 2024-2035
- Table 76: Rest-of-Europe Data Center Cooling Market (by Air Cooling), $Billion, 2024-2035
- Table 77: Rest-of-Europe Data Center Cooling Market (by Liquid Cooling), $Billion, 2024-2035
- Table 78: Rest-of-Europe Data Center Cooling Market (by Direct), $Billion, 2024-2035
- Table 79: Rest-of-Europe Data Center Cooling Market (by Rack Density), $Billion, 2024-2035
- Table 80: Market Share, 2023
This report can be delivered in 2 working days.
Introduction to Europe Data Center Cooling Market
The Europe data center cooling market is projected to reach $20.55 billion by 2035 from $6.76 billion in 2024, growing at a CAGR of 10.18% during the forecast period 2025-2035. The rise in data generation, cloud computing, and the expansion of digital infrastructure are driving the data centre cooling industry in Europe. Efficient cooling systems are becoming essential for preserving equipment reliability and uptime as the need for high-performance computing rises. Strict EU rules and sustainability goals have impacted the market, leading to a move towards low-energy, eco-friendly cooling technology. The region's adoption of sophisticated, energy-efficient cooling solutions is accelerating due to ongoing innovation and mounting pressure to cut energy usage, even while obstacles like high initial investment and system complexity still exist.
| KEY MARKET STATISTICS | |
|---|---|
| Forecast Period | 2025 - 2035 |
| 2025 Evaluation | $7.80 Billion |
| 2035 Forecast | $20.55 Billion |
| CAGR | 10.18% |
Market Introduction
The market for data centre cooling in Europe is changing quickly because to the exponential rise in workloads related to artificial intelligence, cloud computing, and data production. Effective thermal management has become essential for maintaining hardware longevity, operational continuity, and regulatory compliance as data centres grow in size and complexity. Energy-efficient solutions are a strategic focus for operators throughout the region because cooling systems can contribute up to 40% of a data center's overall energy consumption.
The adoption of cutting-edge cooling technologies is mostly being driven by European nations, especially Germany, the Netherlands, Ireland, and the Nordics.
These include direct-to-chip systems, liquid cooling, and free air cooling, which are made to manage high-density computing with little effect on the environment. Low-carbon, water-efficient, and environmentally friendly cooling techniques are becoming more popular in the region as a result of the push for sustainability brought about by EU climate rules, the Renewable Energy Directive, and the European Green Deal.
Europe's diverse climates have an impact on cooling tactics as well. While southern nations need more durable solutions to sustain efficiency in hot conditions, northern locations benefit from ambient cold air to lessen reliance on mechanical systems. The European data centre cooling market is expected to continue to innovate and grow as regulatory pressure increases and digital infrastructure keeps growing.
Market Segmentation
Segmentation 1: by End-Use Industry
- IT and Telecom
- Healthcare
- Retail
- Banking, Financial Services, and Insurance
- Government and Public Sector
- Manufacturing
- Others
Segmentation 2: by Data Center Type
- Centralized Data Center
- Hyperscale
- Colocation
- Enterprise
- Edge Data Center
Segmentation 3: by Application Area
- Artificial Intelligence (AI)
- High-Performance Computing (HPC)
- Cloud Computing
- Edge Computing
- Others
Segmentation 4: by Solution
- Air Cooling
- Air Conditioner
- Air Handling Unit
- Chiller
- Cooling Tower
- Economizer System
- Others
- Liquid Cooling
- Direct
- Rear Door Heat Exchangers (RDHX)
- Free Cooling
Segmentation 5: by Rack Density
- Low Rack Density (1-4 kW)
- Medium Rack Density (5-9 kW)
- High Rack Density (Above 9 kW)
Segmentation 6: by Country
- Germany
- France
- U.K.
- Italy
- Netherlands
- Spain
- Rest-of-Europe
Market trends, Drivers and Challenges of Europe Data Center Cooling Market Market Trends
- Shift toward liquid and immersion cooling to manage high-density AI and HPC workloads
- Rising focus on energy-efficient and sustainable cooling systems to meet ESG and carbon neutrality goals
- Adoption of free cooling and economizers in colder regions like Scandinavia to reduce energy consumption
- Growing use of AI and automation for real-time thermal management and predictive maintenance
- Integration of modular and prefabricated cooling solutions for faster deployment and scalability
- Increase in green data centers powered by renewable energy and eco-friendly cooling technologies
Market Drivers
- Surge in data traffic and cloud computing demand driving data center expansion across Europe
- Stringent EU regulations on energy efficiency (e.g., EN50600, EU Taxonomy) pushing operators to adopt greener solutions
- Government incentives and sustainability mandates supporting low-carbon infrastructure development
- Need to reduce operational costs, particularly energy expenses tied to cooling (up to 40% of total energy use)
- Rise in edge data centers and colocation facilities, requiring compact and efficient cooling systems
Market Challenges
- High upfront costs for advanced cooling technologies like liquid immersion and adiabatic systems
- Regulatory complexity and variations across European countries creating compliance difficulties
- Water usage concerns, especially in drought-prone regions, limiting the viability of water-based cooling
- Legacy infrastructure limitations slowing the transition to next-gen cooling methods
- Skilled labor shortage in cooling system design, integration, and maintenance across the region
How can this report add value to an organization?
Product/Innovation Strategy: This report provides a comprehensive product/innovation strategy for the Europe data center cooling market, identifying opportunities for market entry, technology adoption, and sustainable growth. It offers actionable insights, helping organizations to meet environmental standards, gain a competitive edge, and capitalize on the increasing demand for eco-friendly solutions in various industries.
Growth/Marketing Strategy: This report offers a comprehensive growth and marketing strategy designed specifically for the Europe data center cooling market. It presents a targeted approach to identifying specialized market segments, establishing a competitive advantage, and implementing creative marketing initiatives aimed at optimizing market share and financial performance. By harnessing these strategic recommendations, organizations can elevate their market presence, seize emerging prospects, and efficiently propel revenue expansion.
Competitive Strategy: This report crafts a strong competitive strategy tailored to the Europe data center cooling market. It evaluates market rivals, suggests methods to stand out, and offers guidance for maintaining a competitive edge. By adhering to these strategic directives, companies can position themselves effectively in the face of market competition, ensuring sustained prosperity and profitability.
Key Market Players and Competition Synopsis
The companies that are profiled in the Europe data center cooling market have been selected based on input gathered from primary experts and analyzing company coverage, product portfolio, and market penetration.
Some of the prominent names in this market are:
- Schneider Electric
- Asetek, Inc.
- Submer
- Munters
- ALFA LAVAL
- Condair Group
- Danfoss
- Johnson Controls International plc
- STLUZ GMBH
- DCX Liquid Cooling Systems
- Rittal GmbH & Co. KG
Table of Contents
Executive Summary
Scope and Definition
1 Markets
- 1.1 Trends: Current and Future Impact Assessment
- 1.1.1 Trends Shaping Data Center Cooling Market
- 1.1.2 Increase in Data Requirements
- 1.1.2.1 Increasing Rack Power Density - New Data Center Reality
- 1.1.2.2 5G Services to Drive Exponential Growth in Data Centers
- 1.1.3 Growth in Demand for Environment-Friendly Cooling Systems
- 1.1.3.1 Carbon Neutrality
- 1.1.3.2 Utilization of Renewable Energies
- 1.1.3.3 Green Initiatives by Government Body
- 1.1.4 New Data Center Trends toward Adoption of Liquid Cooling, 2024-2034
- 1.1.4.1 Case Study
- 1.1.4.1.1 Immersion Cooling Technology
- 1.1.4.1.1.1 Advancing Data Center Cooling Efficiency: The University of Leeds' Adoption of Fully Immersed Liquid-Cooled Servers
- 1.1.4.1.1.2 PeaSoup Cloud: Pioneering Eco-Friendly Cloud Services with Immersion Cooling Technology
- 1.1.4.1.1 Immersion Cooling Technology
- 1.1.4.1 Case Study
- 1.2 Evaporative Cooling Market for Data Center Overview
- 1.2.1 Regional Overview of Evaporative Cooling Market for Data Center
- 1.2.1.1 Europe
- 1.2.1 Regional Overview of Evaporative Cooling Market for Data Center
- 1.3 Supply Chain Overview
- 1.3.1 Value Chain Analysis
- 1.3.2 Market Map
- 1.3.2.1 Data Center Cooling Market - Product (by Solution)
- 1.3.2.1.1 Air Cooling
- 1.3.2.1.2 Liquid Cooling
- 1.3.2.1 Data Center Cooling Market - Product (by Solution)
- 1.4 Research and Development Review
- 1.4.1 Patent Filing Trend (by Country and Company)
- 1.5 Ecosystem and Ongoing Programs
- 1.5.1 Government Programs and Initiatives Landscape
- 1.5.1.1 Europe
- 1.5.1 Government Programs and Initiatives Landscape
- 1.6 Market Dynamics Overview
- 1.6.1 Market Drivers
- 1.6.1.1 High-Efficient Cooling Systems
- 1.6.1.1.1 Emerging Technologies Promote Cost-Effectiveness
- 1.6.1.1.2 AI-Assisted Automatic Cooling Control
- 1.6.1.1.3 Power Usage Effectiveness (PUE) Optimization with Economic Cooling Solutions
- 1.6.1.2 Increasing Number of Data Centers and Spendings
- 1.6.1.3 Thermal Energy Recovery Conversion from Data Centers
- 1.6.1.4 Water Usage Effectiveness Driving Adoption of Alternate Cooling Solutions
- 1.6.1.5 Retrofitting to a Free Cooling Data Center
- 1.6.1.1 High-Efficient Cooling Systems
- 1.6.2 Market Restraints
- 1.6.2.1 High Investment Costs for Non-Conventional Cooling Systems
- 1.6.2.2 Technical Challenges to Cooling Systems
- 1.6.2.2.1 Air and Free Cooling Systems Adaption Complexities
- 1.6.2.2.2 Reliability Limitations with Immersion Liquid Cooling
- 1.6.3 Business Opportunities
- 1.6.3.1 Growing Emphasis for Retrofit Data Center
- 1.6.3.2 Data Center Infrastructure Management for Power Management
- 1.6.3.3 Increasing Number of Distributed or Edge Data Centers
- 1.6.1 Market Drivers
- 1.7 Key Start-Ups in the Europe Data Center Cooling Market
2 Regions
- 2.1 Regional Summary
- 2.2 Europe
- 2.2.1 Key Market Participants in Europe
- 2.2.2 Business Drivers
- 2.2.3 Business Challenges
- 2.2.4 Application
- 2.2.5 Product
- 2.2.6 Europe (By Country)
- 2.2.6.1 Germany
- 2.2.6.1.1 Application
- 2.2.6.1.2 Product
- 2.2.6.2 France
- 2.2.6.2.1 Application
- 2.2.6.2.2 Product
- 2.2.6.3 U.K.
- 2.2.6.3.1 Application
- 2.2.6.3.2 Product
- 2.2.6.4 Italy
- 2.2.6.4.1 Application
- 2.2.6.4.2 Product
- 2.2.6.5 Netherlands
- 2.2.6.5.1 Application
- 2.2.6.5.2 Product
- 2.2.6.6 Spain
- 2.2.6.6.1 Application
- 2.2.6.6.2 Product
- 2.2.6.7 Rest-of-Europe
- 2.2.6.7.1 Application
- 2.2.6.7.2 Product
- 2.2.6.1 Germany
3 Competitive Benchmarking & Company Profiles
- 3.1 Next Frontiers
- 3.2 Geographic Assessment
- 3.3 Competitive Landscape
- 3.4 Company Profiles
- 3.4.1 Schneider Electric
- 3.4.1.1 Overview
- 3.4.1.2 Top Products/Product Portfolio
- 3.4.1.3 Top Competitors
- 3.4.1.4 Target Customers
- 3.4.1.5 Key Personnel
- 3.4.1.6 Analyst View
- 3.4.1.7 Market Share, 2024
- 3.4.2 Asetek, Inc.
- 3.4.2.1 Overview
- 3.4.2.2 Top Products/Product Portfolio
- 3.4.2.3 Top Competitors
- 3.4.2.4 Target Customers/End-Use Industries
- 3.4.2.5 Key Personnel
- 3.4.2.6 Analyst View
- 3.4.2.7 Market Share, 2024
- 3.4.3 Submer
- 3.4.3.1 Overview
- 3.4.3.2 Top Products/Product Portfolio
- 3.4.3.3 Top Competitors
- 3.4.3.4 Target Customers
- 3.4.3.5 Key Personnel
- 3.4.3.6 Analyst View
- 3.4.3.7 Market Share, 2024
- 3.4.4 Munters
- 3.4.4.1 Overview
- 3.4.4.2 Top Products/Product Portfolio
- 3.4.4.3 Top Competitors
- 3.4.4.4 Target Customers
- 3.4.4.5 Key Personnel
- 3.4.4.6 Analyst View
- 3.4.4.7 Market Share, 2024
- 3.4.5 ALFA LAVAL
- 3.4.5.1 Overview
- 3.4.5.2 Top Products/Product Portfolio
- 3.4.5.3 Top Competitors
- 3.4.5.4 Target Customers/End-Use Industries
- 3.4.5.5 Key Personnel
- 3.4.5.6 Analyst View
- 3.4.5.7 Market Share, 2024
- 3.4.6 Condair Group
- 3.4.6.1 Overview
- 3.4.6.2 Top Products/Product Portfolio
- 3.4.6.3 Top Competitors
- 3.4.6.4 Target Customers/End-Use Industries
- 3.4.6.5 Key Personnel
- 3.4.6.6 Analyst View
- 3.4.6.7 Market Share, 2024
- 3.4.7 Danfoss
- 3.4.7.1 Overview
- 3.4.7.2 Top Products/Product Portfolio
- 3.4.7.3 Top Competitors
- 3.4.7.4 Target Customers/End-Use Industries
- 3.4.7.5 Key Personnel
- 3.4.7.6 Analyst View
- 3.4.7.7 Market Share, 2024
- 3.4.8 Johnson Controls International plc
- 3.4.8.1 Overview
- 3.4.8.2 Top Products/Product Portfolio
- 3.4.8.3 Top Competitors
- 3.4.8.4 Target Customers
- 3.4.8.5 Key Personnel
- 3.4.8.6 Analyst View
- 3.4.8.7 Market Share, 2024
- 3.4.9 STULZ GMBH
- 3.4.9.1 Overview
- 3.4.9.2 Top Products/Product Portfolio
- 3.4.9.3 Top Competitors
- 3.4.9.4 Target Customers
- 3.4.9.5 Key Personnel
- 3.4.9.6 Analyst View
- 3.4.9.7 Market Share, 2023
- 3.4.10 DCX Liquid Cooling Systems
- 3.4.10.1 Overview
- 3.4.10.2 Top Products/Product Portfolio
- 3.4.10.3 Top Competitors
- 3.4.10.4 Target Customers
- 3.4.10.5 Key Personnel
- 3.4.10.6 Analyst View
- 3.4.10.7 Market Share, 2024
- 3.4.11 Rittal GmbH & Co. KG
- 3.4.11.1 Overview
- 3.4.11.2 Top Products/Product Portfolio
- 3.4.11.3 Top Competitors
- 3.4.11.4 Target Customers
- 3.4.11.5 Key Personnel
- 3.4.11.6 Analyst View
- 3.4.11.7 Market Share, 2024
- 3.4.1 Schneider Electric
- 3.5 Other Key Market Participants
4 Research Methodology
- 4.1 Data Sources
- 4.1.1 Primary Data Sources
- 4.1.2 Secondary Data Sources
- 4.1.3 Data Triangulation
- 4.2 Market Estimation and Forecast

