|
|
市場調査レポート
商品コード
1271996
個別化栄養 (パーソナライズドニュートリション) の世界市場Personalized Nutrition: Global Markets |
||||||
|
|
|||||||
|
|||||||


| 個別化栄養 (パーソナライズドニュートリション) の世界市場 |
|
出版日: 2023年05月05日
発行: BCC Research
ページ情報: 英文 148 Pages
納期: 即納可能
|

- 全表示
- 概要
- 図表
- 目次
当レポートでは、世界の個別化栄養 (パーソナライズドニュートリション) の市場規模は、2022年の122億米ドルから、2022年から2027年にかけて12.5%のCAGRで推移し、2027年には251億米ドルの規模に成長すると予測されています。
北米地域は、2022年の50億米ドルから、11.8%のCAGRで推移し、2027年には99億米ドルの規模に成長すると予測されています。
また、アジア太平洋地域は、2022年の22億米ドルから、15.1%のCAGRで推移し、2027年には52億米ドルの規模に成長すると予測されています。
当レポートでは、世界の個別化栄養 (パーソナライズドニュートリション) の市場を調査し、市場概要、市場規模の推移・予測、各種区分・地域別の詳細分析、特許動向、市場影響因子の分析、競合環境、主要企業のプロファイルなどをまとめています。
目次
第1章 イントロダクション
第2章 サマリーおよびハイライト
第3章 個別化栄養 (パーソナライズドニュートリション):市場概要
- ポーターのファイブフォース分析
- PESTLE分析
- 特許分析
- SWOT分析
- COVID-19の影響
第4章 個別化栄養 (パーソナライズドニュートリション):市場力学
- 市場促進要因
- 市場抑制要因
- 市場機会
第5章 市場内訳:コンポーネントタイプ別
- 概要
- サービス
- ハードウェア
- ソフトウェア
第6章 市場内訳:評価タイプ別
- 概要
- 標準測定
- アクティブ測定
第7章 市場内訳:サプリメントタイプ別
- 概要
- 疾患ベースのサプリメント
第8章 市場内訳:チャネルタイプ別
- 概要
- 病院・診療所
- ウェルネス&フィットネスセンター
- D2C
- 機関
第9章 市場内訳:地域別
- 概要
- 北米
- 欧州
- アジア太平洋
- その他の地域
第10章 競合情勢
- 主要企業
- 戦略分析
- 主要市場動向
- 主な資金
第11章 企業プロファイル
- AMWAY CORP.
- ATLAS BIOMED GROUP LIMITED
- BACTOLAC PHARMACEUTICAL INC.
- BALCHEM CORP.
- CUREFIT HEALTHCARE PRIVATE LIMITED
- DAYTWO INC.
- DNALYSIS BIOTECHNOLOGY
- GENOPLAN INC.
- HEALTHIFYME WELLNESS PRIVATE LIMITED
- HERBALIFE NUTRITION LTD.
- KONINKLIJKE DSM N.V.
- MYGENOMEBOX CORP.
- NOHO HEALTH INC.
- NUTRIGENOMIX
- PRENETICS EMEA LIMITED
- VIOME LIFE SCIENCES INC.
- ZIPONGO INC.
- ZYWIE VENTURES PRIVATE LIMITED
List of Tables
- Summary Table : Global Market for Personalized Nutrition, by Region, Through 2028
- Table 1 : Porter's Five Forces Analysis: Overview
- Table 2 : Personalized Nutrition Patents Share, 2019-2023
- Table 3 : Global Market for Personalized Nutrition, by Component Type, Through 2028
- Table 4 : Global Market for Services in Personalized Nutrition, by Region, Through 2028
- Table 5 : Global Market for Hardware in Personalized Nutrition, by Region, Through 2028
- Table 6 : Global Market for Software in Personalized Nutrition, by Region, Through 2028
- Table 7 : Global Market for Personalized Nutrition, by Assessment Type, Through 2028
- Table 8 : Global Market for Standard Measurements Type in Personalized Nutrition, by Region, Through 2028
- Table 9 : Global Market for Active Measurements Type in Personalized Nutrition, by Region, Through 2028
- Table 10 : Global Market for Personalized Nutrition, by Supplement Type, Through 2028
- Table 11 : Global Market for Standard Supplements in Personalized Nutrition, by Region, Through 2028
- Table 12 : Global Market for Disease-Based Supplements in Personalized Nutrition, by Region, Through 2028
- Table 13 : Global Market for Personalized Nutrition, by Channel Type, Through 2028
- Table 14 : Global Market for Hospitals and Clinics in Personalized Nutrition, by Region, Through 2028
- Table 15 : Global Market for Wellness and Fitness Centers in Personalized Nutrition, by Region, Through 2028
- Table 16 : Global Market for Direct-to-Consumer in Personalized Nutrition, by Region, Through 2028
- Table 17 : Global Market for Institutions in Personalized Nutrition, by Region, Through 2028
- Table 18 : Global Market for Personalized Nutrition, by Region, Through 2028
- Table 19 : North American Market for Personalized Nutrition, by Country, Through 2028
- Table 20 : North American Market for Personalized Nutrition, by Component Type, Through 2028
- Table 21 : North American Market for Personalized Nutrition, by Assessment Type, Through 2028
- Table 22 : North American Market for Personalized Nutrition, by Supplement Type, Through 2028
- Table 23 : North American Market for Personalized Nutrition, by Channel Type, Through 2028
- Table 24 : European Market for Personalized Nutrition, by Country, Through 2028
- Table 25 : European Market for Personalized Nutrition, by Component Type, Through 2028
- Table 26 : European Market for Personalized Nutrition, by Assessment Type, Through 2028
- Table 27 : European Market for Personalized Nutrition, by Supplement Type, Through 2028
- Table 28 : European Market for Personalized Nutrition, by Channel Type, Through 2028
- Table 29 : Asia-Pacific Market for Personalized Nutrition, by Country, Through 2028
- Table 30 : Asia-Pacific Market for Personalized Nutrition, by Component Type, Through 2028
- Table 31 : Asia-Pacific Market for Personalized Nutrition, by Assessment Type, Through 2028
- Table 32 : Asia-Pacific Market for Personalized Nutrition, by Supplement Type, Through 2028
- Table 33 : Asia-Pacific Market for Personalized Nutrition, by Channel Type, Through 2028
- Table 34 : RoW Market for Personalized Nutrition, by Sub-Region, Through 2028
- Table 35 : RoW Market for Personalized Nutrition, by Component Type, Through 2028
- Table 36 : RoW Market for Personalized Nutrition, by Assessment Type, Through 2028
- Table 37 : RoW Market for Personalized Nutrition, by Supplement Type, Through 2028
- Table 38 : RoW Market for Personalized Nutrition, by Channel Type, Through 2028
- Table 39 : Personalized Nutrition Market Developments
- Table 40 : Personalized Nutrition Recent Fundings, 2020-2022
- Table 41 : Amway Corp.: Key Management
- Table 42 : Amway Corp.: Product Portfolio
- Table 43 : Amway Corp.: Recent Developments, 2020-2022
- Table 44 : Atlas Biomed Group Limited: Key Management
- Table 45 : Atlas Biomed Group Limited: Product Portfolio
- Table 46 : Bactolac Pharmaceutical Inc.: Key Management
- Table 47 : Bactolac Pharmaceutical Inc.: Product Portfolio
- Table 48 : Balchem Corp.: Key Management
- Table 49 : Balchem Corp.: Financials, 2019-2021
- Table 50 : Balchem Corp.: Product Portfolio
- Table 51 : Balchem Corp.: Recent Developments, 2020-2022
- Table 52 : Curefit Healthcare Private Limited: Key Management
- Table 53 : Curefit Healthcare Private Limited: Product Portfolio
- Table 54 : Curefit Healthcare Private Limited: Recent Key Developments, 2020-2022
- Table 55 : DayTwo Inc.: Key Management
- Table 56 : DayTwo Inc.: Product Portfolio
- Table 57 : DayTwo Inc.: Recent Key Developments, 2020-2022
- Table 58 : DNAlysis Biotechnology: Key Management
- Table 59 : DNAlysis Biotechnology: Product Portfolio
- Table 60 : HealthifyMe Wellness Private Limited: Key Management
- Table 61 : HealthifyMe Wellness Private Limited: Product Portfolio
- Table 62 : HealthifyMe Wellness Private Limited: Key Recent Developments, 2020-2022
- Table 63 : Herbalife Nutrition Ltd.: Key Management
- Table 64 : Herbalife Nutrition Ltd.: Financials, 2020-2022
- Table 65 : Herbalife Nutrition Ltd.: Product Portfolio
- Table 66 : Herbalife Nutrition Ltd.: Recent Key Developments, 2020-2022
- Table 67 : Koninklijke DSM N.V.: Key Management
- Table 68 : Koninklijke DSM N.V.: Financials, 2020-2022
- Table 69 : Koninklijke DSM N.V.: Product Portfolio
- Table 70 : Koninklijke DSM N.V.: Recent Key Developments, 2020-2022
- Table 71 : Prenetics EMEA Limited: Key Management
- Table 72 : Prenetics EMEA Limited: Product Portfolio
- Table 73 : Prenetics EMEA Limited: Recent Key Developments, 2020-2022
- Table 74 : Viome Life Sciences Inc.: Key Management
- Table 75 : Viome Life Sciences Inc.: Product Portfolio
- Table 76 : Viome Life Sciences Inc.: Recent Key Developments, 2020-2022
- Table 77 : Zipongo Inc.: Key Management
- Table 78 : Zipongo Inc.: Product Portfolio
- Table 79 : Zipongo Inc.: Recent Developments, 2020-2022
List of Figures
- Summary Figure : Global Market Shares of Personalized Nutrition, by Region, 2022
- Figure 1 : Global Markets for Personalized Nutrition, Porter's Five Forces Analysis
- Figure 2 : Global Markets for Personalized Nutrition, Power of Suppliers
- Figure 3 : Global Markets for Personalized Nutrition, Power of Buyers
- Figure 4 : Global Markets for Personalized Nutrition, Threat of New Entrants
- Figure 5 : Global Markets for Personalized Nutrition, Threat of Substitutes
- Figure 6 : Global Markets for Personalized Nutrition, Degree of Competition
- Figure 7 : Personalized Nutrition Patents, by Year, 2019-March 2022
- Figure 8 : Global Market Shares of Personalized Nutrition, by Component Type, 2022
- Figure 9 : Global Market Shares of Personalized Nutrition, by Component Type, 2028
- Figure 10 : Global Market Shares of Services in Personalized Nutrition, by Region, 2022
- Figure 11 : Global Market Shares of Services in Personalized Nutrition, by Region, 2028
- Figure 12 : Global Market Shares of Hardware in Personalized Nutrition, by Region, 2022
- Figure 13 : Global Market Shares of Hardware in Personalized Nutrition, by Region, 2028
- Figure 14 : Global Market Shares of Software in Personalized Nutrition, by Region, 2022
- Figure 15 : Global Market Shares of Software in Personalized Nutrition, by Region, 2028
- Figure 16 : Global Market Shares of Personalized Nutrition, by Assessment Type, 2022
- Figure 17 : Global Market Shares of Personalized Nutrition, by Assessment Type, 2028
- Figure 18 : Global Market Shares of Standard Measurements Type in Personalized Nutrition, by Region, 2022
- Figure 19 : Global Market Shares of Standard Measurements Type in Personalized Nutrition, by Region, 2028
- Figure 20 : Global Market Shares of Active Measurements Type in Personalized Nutrition, by Region, 2022
- Figure 21 : Global Market Shares of Active Measurements Type in Personalized Nutrition, by Region, 2028
- Figure 22 : Global Market Shares of Personalized Nutrition, by Supplement Type, 2022
- Figure 23 : Global Market Shares of Personalized Nutrition, by Supplement Type, 2028
- Figure 24 : Global Market Shares of Standard Supplements in Personalized Nutrition, by Region, 2022
- Figure 25 : Global Market Shares of Standard Supplements in Personalized Nutrition, by Region, 2028
- Figure 26 : Global Market Shares of Disease-Based Supplements in Personalized Nutrition, by Region, 2022
- Figure 27 : Global Market Shares of Disease-Based Supplements in Personalized Nutrition, by Region, 2028
- Figure 28 : Global Market Shares of Personalized Nutrition, by Channel Type, 2022
- Figure 29 : Global Market Shares of Personalized Nutrition, by Channel Type, 2028
- Figure 30 : Global Market Shares of Hospitals and Clinics in Personalized Nutrition, by Region, 2022
- Figure 31 : Global Market Shares of Hospitals and Clinics in Personalized Nutrition, by Region, 2028
- Figure 32 : Global Market Shares of Wellness and Fitness Centers in Personalized Nutrition, by Region, 2022
- Figure 33 : Global Market Shares of Wellness and Fitness Centers in Personalized Nutrition, by Region, 2028
- Figure 34 : Global Market Shares of Direct-to-Consumer in Personalized Nutrition, by Region, 2022
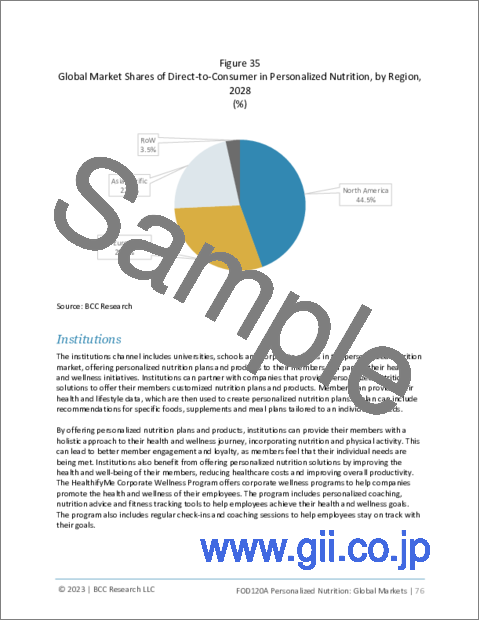
- Figure 35 : Global Market Shares of Direct-to-Consumer in Personalized Nutrition, by Region, 2028
- Figure 36 : Global Market Shares of Institutions in Personalized Nutrition, by Region, 2022
- Figure 37 : Global Market Shares of Institutions in Personalized Nutrition, by Region, 2028
- Figure 38 : Global Market for Personalized Nutrition, by Region
- Figure 39 : Global Market Shares of Personalized Nutrition, by Region, 2022
- Figure 40 : Global Market Shares of Personalized Nutrition, by Region, 2028
- Figure 41 : North American Market Shares of Personalized Nutrition, by Country, 2022
- Figure 42 : North American Market Shares of Personalized Nutrition, by Country, 2028
- Figure 43 : U.S. Market for Personalized Nutrition, 2022-2028
- Figure 44 : Canadian Market for Personalized Nutrition, 2022-2028
- Figure 45 : Mexican Market for Personalized Nutrition, 2022-2028
- Figure 46 : European Market Shares of Personalized Nutrition, by Country, 2022
- Figure 47 : European Market Shares of Personalized Nutrition, by Country, 2028
- Figure 48 : U.K. Market for Personalized Nutrition, 2022-2028
- Figure 49 : German Market for Personalized Nutrition, 2022-2028
- Figure 50 : French Market for Personalized Nutrition, 2022-2028
- Figure 51 : Italian Market for Personalized Nutrition, 2022-2028
- Figure 52 : Rest of European Market for Personalized Nutrition, 2022-2028
- Figure 53 : Asia-Pacific Market Shares of Personalized Nutrition, by Country, 2022
- Figure 54 : Asia-Pacific Market Shares of Personalized Nutrition, by Country, 2028
- Figure 55 : Chinese Market for Personalized Nutrition, 2022-2028
- Figure 56 : Japanese Market for Personalized Nutrition, 2022-2028
- Figure 57 : Indian Market for Personalized Nutrition, 2022-2028
- Figure 58 : Rest of Asia-Pacific Market for Personalized Nutrition, 2022-2028
- Figure 59 : RoW Market Shares of Personalized Nutrition, by Sub-Region, 2022
- Figure 60 : RoW Market Shares of Personalized Nutrition, by Sub-Region, 2028
- Figure 61 : South American Market for Personalized Nutrition, 2022-2028
- Figure 62 : Middle Eastern Market for Personalized Nutrition, 2022-2028
- Figure 63 : African Market for Personalized Nutrition, 2022-2028
- Figure 64 : Amway Corp.: Financials, 2019-2021
- Figure 65 : Balchem Corp.: Revenue Share, by Business Segment, 2021
- Figure 66 : Balchem Corp.: Revenue Share, by Region, 2021
- Figure 67 : Curefit Healthcare Private Limited: Financials, 2019-2021
- Figure 68 : Herbalife Nutrition Ltd.: Revenue Share, by Business Segment, 2022
- Figure 69 : Herbalife Nutrition Ltd.: Revenue Share, by Region, 2022
- Figure 70 : Koninklijke DSM N.V.: Revenue Share, by Business Segment, 2022
Highlights:
The global personalized nutrition market reached $12.2 billion in 2022 and should reach $25.1 billion by 2028, with a compound annual growth rate (CAGR) of 12.5% during the forecast period of 2023-2028.
North American personalized nutrition market reached $5 billion in 2022 and should reach $9.9 billion by 2028, with a CAGR of 11.8% during the forecast period of 2023-2028.
Asia-Pacific personalized nutrition market reached $2.2 billion in 2022 and should reach $5.2 billion by 2028, with a CAGR of 15.1% during the forecast period of 2023-2028.
Report Scope:
This report segments the personalized nutrition market by assessment type, supplement type, channel type, component type and region. It provides an overview of the personalized nutrition global market and analyzes market trends. Using 2023 as the base year, the report estimates market data from 2023 through 2028.
Based on assessment type, the personalized nutrition global market has been categorized into active and standard measurements. Based on supplement type, the market has been divided into standard and disease-based supplements. The personalized nutrition market is segmented by channel type into direct-to-consumer, wellness and fitness centers, hospitals and clinics, and institutions. Geographical regions in the report include North America, Europe, Asia-Pacific, and the Rest of the World (RoW), which includes South America, the Middle East and Africa. Revenue forecasts from 2023 to 2028 are given for all global market segments, with estimated values derived from solutions and service providers' total revenue.
Report Includes:
- 40 data tables and 40 additional tables
- A brief descriptive overview of the global market for personalized nutrition
- Analyses of the global market trends, with market revenue for 2022, estimates for 2023, and projections of compound annual growth rates (CAGRs) through 2028
- Discussion of industry growth driving factors and major technology issues and challenges affecting the market for personalized nutrition as a basis for projecting demand in the next few years (2023-2028)
- Estimation of the actual market size and revenue forecast for the global personalized nutrition market, and corresponding market share analysis based on component, supplement type, sales channel, type of assessment, and region
- A comparative study of Porter's Five Forces analysis and PESTLE analysis considering both micro- and macro- environmental factors prevailing in the global market for personalized nutrition
- Holistic review of the impact of the COVID-19 pandemic and the Russia-Ukraine war on the global market for ballast water treatment equipment and technologies
- Identification of major stakeholders and analysis of the company competitive landscape based on their recent developments, financial performance, segmental revenues, and operational integration
- Company profiles of major players within the industry, including Amway Corp., Balchem Corp., Curefit Healthcare Private Limited, Herbalife Nutrition Ltd., and Koninklijke DSM N.V.
Table of Contents
Chapter 1 Introduction
- 1.1 Study Goals and Objectives
- 1.2 Reasons for Doing This Study
- 1.3 Scope of Report
- 1.4 Intended Audiences
- 1.5 Information Sources
- 1.6 Methodology
- 1.7 Geographic Breakdown
- 1.8 Analyst's Credentials
- 1.9 BCC Custom Research
- 1.10 Related BCC Research Reports
Chapter 2 Summary and Highlights
Chapter 3 Personalized Nutrition: Market Overview
- 3.1 Porter's Five Forces Analysis
- 3.1.1 Power of Suppliers
- 3.1.2 Power of Buyers
- 3.1.3 Threat of New Entrants
- 3.1.4 Threat of Substitutes
- 3.1.5 Degree of Competition
- 3.2 PESTLE Analysis
- 3.2.1 Political
- 3.2.2 Economic
- 3.2.3 Sociocultural
- 3.2.4 Technological
- 3.2.5 Legal
- 3.2.6 Environmental
- 3.3 Patent Analysis
- 3.3.1 Recent Patents
- 3.4 SWOT Analysis
- 3.4.1 Strengths
- 3.4.2 Weakness
- 3.4.3 Opportunities
- 3.4.4 Threats
- 3.5 Impact of COVID-19
Chapter 4 Personalized Nutrition: Market Dynamics
- 4.1 Market Drivers
- 4.1.1 Growing Interest in Preventive Healthcare
- 4.1.2 Increasing Use of Advanced Technology
- 4.1.3 Growing Consumer Income Levels
- 4.1.4 Increase in Aging Population
- 4.2 Market Restraints
- 4.2.1 Higher Cost of the Personalized Nutrition Products
- 4.2.2 Lack of Standardization
- 4.2.3 Privacy Concerns
- 4.3 Market Opportunities
- 4.3.1 Rising Cost of Health Expenditure
- 4.3.2 Increasing Research and Development
- 4.3.3 Increasing Awareness and Education
- 4.3.4 Expansion into Emerging Markets
Chapter 5 Market Breakdown by Component Type
- 5.1 Overview
- 5.2 Services
- 5.3 Hardware
- 5.4 Software
Chapter 6 Market Breakdown by Assessment Type
- 6.1 Overview
- 6.2 Standard Measurements
- 6.3 Active Measurements
Chapter 7 Market Breakdown by Supplement Type
- 7.1 Overview
- 7.1.1 Standard Supplements
- 7.2 Disease-Based Supplements
Chapter 8 Market Breakdown by Channel Type
- 8.1 Overview
- 8.2 Hospitals and Clinics
- 8.3 Wellness and Fitness Centers
- 8.4 Direct-to-Consumer
- 8.5 Institutions
Chapter 9 Market Breakdown by Region
- 9.1 Overview
- 9.2 North America
- 9.2.1 U.S.
- 9.2.2 Canada
- 9.2.3 Mexico
- 9.3 Europe
- 9.3.1 U.K.
- 9.3.2 Germany
- 9.3.3 France
- 9.3.4 Italy
- 9.3.5 Rest of Europe
- 9.4 Asia-Pacific
- 9.4.1 China
- 9.4.2 Japan
- 9.4.3 India
- 9.4.4 Rest of Asia-Pacific
- 9.5 Rest of the World
- 9.5.1 South America
- 9.5.2 Middle East
- 9.5.3 Africa
Chapter 10 Competitive Landscape
- 10.1 Top Companies
- 10.2 Strategic Analysis
- 10.3 Key Market Developments
- 10.4 Key Fundings
Chapter 11 Company Profiles
- AMWAY CORP.
- ATLAS BIOMED GROUP LIMITED
- BACTOLAC PHARMACEUTICAL INC.
- BALCHEM CORP.
- CUREFIT HEALTHCARE PRIVATE LIMITED
- DAYTWO INC.
- DNALYSIS BIOTECHNOLOGY
- GENOPLAN INC.
- HEALTHIFYME WELLNESS PRIVATE LIMITED
- HERBALIFE NUTRITION LTD.
- KONINKLIJKE DSM N.V.
- MYGENOMEBOX CORP.
- NOHO HEALTH INC.
- NUTRIGENOMIX
- PRENETICS EMEA LIMITED
- VIOME LIFE SCIENCES INC.
- ZIPONGO INC.
- ZYWIE VENTURES PRIVATE LIMITED