|
|
市場調査レポート
商品コード
1132546
化粧品産業向けバイオベース製品の世界市場Bio-based Products in the Cosmetics Industry: Global Markets |
||||||
|
|
|||||||


| 化粧品産業向けバイオベース製品の世界市場 |
|
出版日: 2022年10月07日
発行: BCC Research
ページ情報: 英文 155 Pages
納期: 即納可能
|
- 全表示
- 概要
- 図表
- 目次
世界の化粧品産業向けバイオベース製品の市場規模は、2022年の74億米ドルから、2027年には105億米ドルを超える規模に拡大し、2022年から2027年までのCAGRは7.1%と予測されています。
スキンケアの部門は、2022年の34億米ドルから、2027年には48億米ドルを超える規模に増加し、2022年から2027年までのCAGRは6.9%と予測されています。また、デコラティブの部門は、2022年の24億米ドルから、2027年には36億米ドルを超える規模に増加し、2022年から2027年までのCAGRは7.9%と推定されています。
当レポートでは、世界の化粧品産業向けバイオベース製品の市場を調査し、市場の背景、市場影響因子の分析、製品の進歩・R&Dイニシアチブ、法規制環境、市場規模の推移・予測、各種区分・地域/主要国別の内訳、競合環境、主要企業のプロファイルなどをまとめています。
目次
第1章 イントロダクション
第2章 サマリー・ハイライト
第3章 市場概要
- 意味
- 市場の背景
- 製品の進歩・R&Dイニシアチブ
- バイオベースの化粧品成分の分析
- 原材料サプライヤーのリスト
- パッケージングの動向
第4章 市場力学
- 市場力学
- 成長指標・動向
- 課題
- 機会
- COVID-19の影響
- バリューチェーン分析
- ポーターのファイブフォース分析
- 規制分析
第5章 市場分析:タイプ別
- スキンケア
- ヘアケア
- デコラティブ
第6章 市場分析:流通チャネル別
- オンライン
- スーパーマーケット・ハイパーマーケット
- 専門店
- その他
第7章 市場分析:地域別
- 北米
- アジア太平洋
- 欧州
- ラテンアメリカ
- 中東・アフリカ
第8章 競合情勢
- 競合シナリオ分析
- 戦略的市場展開
第9章 企業プロファイル
- BLISSOMA BOTANICAL BEAUTY
- FANCL CORP.
- L'OCCITANE INTERNATIONAL S.A.
- LOREAL S.A.
- NATIVE
- NATURA & C.O.
- RMS BEAUTY
- SEPHORA USA INC.
- SHISEIDO COMPANY LIMITED
- THE CLOROX COMPANY
- THE ESTEE LAUDER COMPANIES INC.
- ULTA BEAUTY INC.
- UNILEVER
- WELEDA AG
第10章 付録:協会・政府機関のリスト
List of Tables
- Summary Table : Global Market for Bio-based Products in Cosmetics, by Type, Through 2027
- Table 1 : Major Petrochemical Ingredients Used in Cosmetic Formulations
- Table 2 : Ancient Cosmetics Industry Timeline
- Table 3 : List of key Biopolymers in Bio-based Cosmetics
- Table 4 : Bio-based Alternatives
- Table 5 : Key Manufacturers of Bio-based Cosmetic Ingredients, Globally
- Table 6 : Recycled Plastic Packaging Utilized by Key Players
- Table 7 : Environmental Performance Index, 2022
- Table 8 : Select Members of NATRUE
- Table 9 : Global Market for Bio-based Skincare Products in Cosmetics, by Region, Through 2027
- Table 10 : Global Market for Bio-based Haircare Products in Cosmetics, by Region, Through 2027
- Table 11 : Global Market for Bio-based Decorative Products in Cosmetics, by Region, Through 2027
- Table 12 : Global Market for Bio-based Products in Cosmetics, by Distribution Channel, Through 2027
- Table 13 : Global Market for Bio-based Decorative Products in Cosmetics, by Online Sales, Through 2027
- Table 14 : Global Market for Bio-based Decorative Products in Cosmetics, by Supermarkets and Hypermarkets, Through 2027
- Table 15 : Global Market for Bio-based Decorative Products in Cosmetics, by Specialty Stores, Through 2027
- Table 16 : Global Market for Bio-based Decorative Products in Cosmetics, by Others, Through 2027
- Table 17 : Global Market for Bio-based Products in Cosmetics, by Region, Through 2027
- Table 18 : North American Market for Bio-based Products in Cosmetics, by Country, Through 2027
- Table 19 : North American Market for Bio-based Products in Cosmetics, by Type, Through 2027
- Table 20 : North American Market for Bio-based Products in Cosmetics, by Distribution Channel, Through 2027
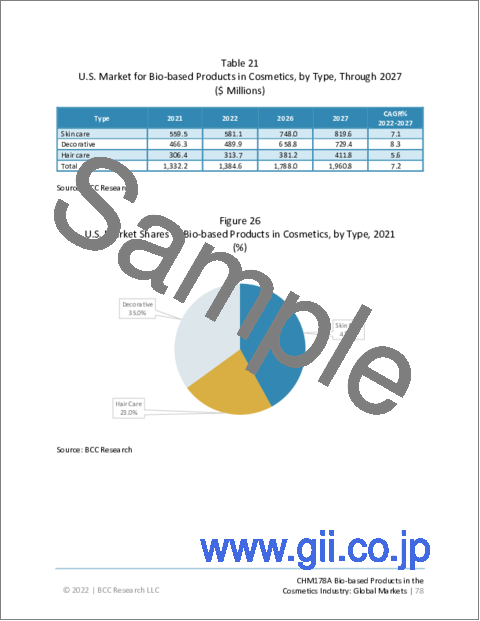
- Table 21 : U.S. Market for Bio-based Products in Cosmetics, by Type, Through 2027
- Table 22 : U.S. Market for Bio-based Products in Cosmetics, by Distribution Channel, Through 2027
- Table 23 : Canadian Market for Bio-based Products in Cosmetics, by Type, Through 2027
- Table 24 : Canadian Market for Bio-based Products in Cosmetics, by Distribution Channel, Through 2027
- Table 25 : Asia-Pacific Market for Bio-based Products in Cosmetics, by Country, Through 2027
- Table 26 : Asia-Pacific Market for Bio-based Products in Cosmetics, by Type, Through 2027
- Table 27 : Asia-Pacific Market for Bio-based Products in Cosmetics, by Distribution Channel, Through 2027
- Table 28 : Chinese Market for Bio-based Products in Cosmetics, by Type, Through 2027
- Table 29 : Chinese Market for Bio-based Products in Cosmetics, by Distribution Channel, Through 2027
- Table 30 : Indian Market for Bio-based Products in Cosmetics, by Type, Through 2027
- Table 31 : Indian Market for Bio-based Products in Cosmetics, by Distribution Channel, Through 2027
- Table 32 : Japanese Market for Bio-based Products in Cosmetics, by Type, Through 2027
- Table 33 : Japanese Market for Bio-based Products in Cosmetics, by Distribution Channel, Through 2027
- Table 34 : South Korean Market for Bio-based Products in Cosmetics, by Type, Through 2027
- Table 35 : South Korean Market for Bio-based Products in Cosmetics, by Distribution Channel, Through 2027
- Table 36 : Rest of Asia-Pacific Market for Bio-based Products in Cosmetics, by Type, Through 2027
- Table 37 : Rest of Asia-Pacific Market for Bio-based Products in Cosmetics, by Distribution Channel, Through 2027
- Table 38 : European Market for Bio-based Products in Cosmetics, by Country, Through 2027
- Table 39 : European Market for Bio-based Products in Cosmetics, by Type, Through 2027
- Table 40 : European Market for Bio-based Products in Cosmetics, by Distribution Channel, Through 2027
- Table 41 : German Market for Bio-based Products in Cosmetics, by Type, Through 2027
- Table 42 : German Market for Bio-based Products in Cosmetics, by Distribution Channel, Through 2027
- Table 43 : French Market for Bio-based Products in Cosmetics, by Type, Through 2027
- Table 44 : French Market for Bio-based Products in Cosmetics, by Distribution Channel, Through 2027
- Table 45 : U.K. Market for Bio-based Products in Cosmetics, by Type, Through 2027
- Table 46 : U.K. Market for Bio-based Products in Cosmetics, by Distribution Channel, Through 2027
- Table 47 : Italian Market for Bio-based Products in Cosmetics, by Type, Through 2027
- Table 48 : Italian Market for Bio-based Products in Cosmetics, by Distribution Channel, Through 2027
- Table 49 : Rest of European Market for Bio-based Products in Cosmetics, by Type, Through 2027
- Table 50 : Rest of European Market for Bio-based Products in Cosmetics, by Distribution Channel, Through 2027
- Table 51 : Latin American Market for Bio-based Products in Cosmetics, by Country, Through 2027
- Table 52 : Latin American Market for Bio-based Products in Cosmetics, by Type, Through 2027
- Table 53 : Latin American Market for Bio-based Products in Cosmetics, by Distribution Channel, Through 2027
- Table 54 : Brazilian Market for Bio-based Products in Cosmetics, by Type, Through 2027
- Table 55 : Brazilian Market for Bio-based Products in Cosmetics, by Distribution Channel, Through 2027
- Table 56 : Mexican Market for Bio-based Products in Cosmetics, by Type, Through 2027
- Table 57 : Mexican Market for Bio-based Products in Cosmetics, by Distribution Channel, Through 2027
- Table 58 : GDP forecasts from 2020 to 2021 (Real GDP Growth %)
- Table 59 : Rest of Latin American Market for Bio-based Products in Cosmetics, by Type, Through 2027
- Table 60 : Rest of Latin American Market for Bio-based Products in Cosmetics, by Distribution Channel, Through 2027
- Table 61 : Middle Eastern and African Market for Bio-based Products in Cosmetics, by Country, Through 2027
- Table 62 : Middle Eastern and African Market for Bio-based Products in Cosmetics, by Type, Through 2027
- Table 63 : Middle Eastern and African Market for Bio-based Products in Cosmetics, by Distribution Channel, Through 2027
- Table 64 : GCC Market for Bio-based Products in Cosmetics, by Type, Through 2027
- Table 65 : GCC Market for Bio-based Products in Cosmetics, by Distribution Channel, Through 2027
- Table 66 : Rest of Middle Eastern and African Market for Bio-based Products in Cosmetics, by Type, Through 2027
- Table 67 : Rest of Middle Eastern and African Market for Bio-based Products in Cosmetics, by Distribution Channel, Through 2027
- Table 68 : Recent Market Developments
- Table 69 : List of Associations
List of Figures
- Summary Figure : Global Market Shares of Bio-based Products in Cosmetics, by Type, 2021
- Figure 1 : Need for Biocosmetics
- Figure 2 : Recombinant DNA Technology
- Figure 3 : Types of Natural Waxes
- Figure 4 : Castor Oil Exports from India to the Rest of the World (2020-2021)
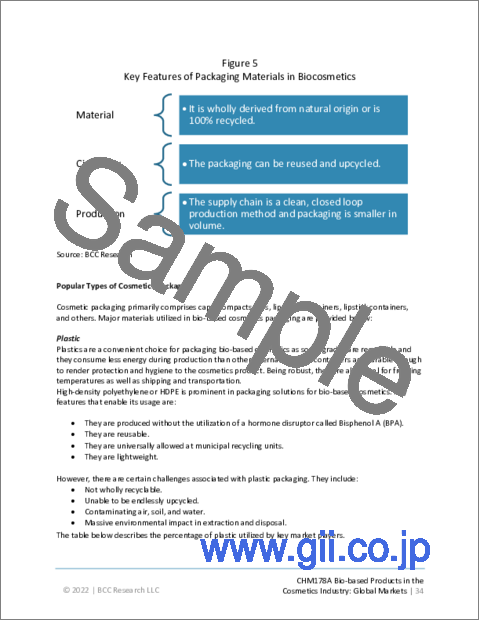
- Figure 5 : Key Features of Packaging Materials in Biocosmetics
- Figure 6 : Key Drivers and Challenges in the Bio-based Cosmetics Market
- Figure 7 : Key Consumer Trends in the Bio-based Cosmetics Market
- Figure 8 : Millennial Population (% Share of the Population), by Region
- Figure 9 : COVID-19 Impact on the Bio-Based Cosmetics Industry
- Figure 10 : Value Chain Analysis
- Figure 11 : Porter's Five Force Analysis
- Figure 12 : Global Market Shares of Bio-based Skincare Products in Cosmetics, by Region, 2021
- Figure 13 : Global Market Shares of Bio-based Haircare Products in Cosmetics, by Region, 2021
- Figure 14 : Global Market Shares of Bio-based Decorative Products in Cosmetics, by Region, 2021
- Figure 15 : Global Market Shares of Bio-based Products in Cosmetics, by Distribution Channel, 2021
- Figure 16 : Key Factors Driving Online Sales
- Figure 17 : Global Market Shares of Bio-based Decorative Products in Cosmetics, by Online Sales, 2021
- Figure 18 : Global Market Shares of Bio-based Decorative Products in Cosmetics, by Supermarkets and Hypermarkets, 2021
- Figure 19 : Global Market Shares of Bio-based Decorative Products in Cosmetics, by Specialty Stores, 2021
- Figure 20 : Global Market Shares of Bio-based Decorative Products in Cosmetics, by Others, 2021
- Figure 21 : Global Market Shares of Bio-based Products in Cosmetics, by Region, 2021
- Figure 22 : North American, Annual GDP growth-2017 to 2021
- Figure 23 : North American Market Shares of Bio-based Products in Cosmetics, by Country, 2021
- Figure 24 : North American Market Shares of Bio-based Products in Cosmetics, by Type, 2021
- Figure 25 : North American Market Shares of Bio-based Products in Cosmetics, by Distribution Channel, 2021
- Figure 26 : U.S. Market Shares of Bio-based Products in Cosmetics, by Type, 2021
- Figure 27 : U.S. Market Shares of Bio-based Products in Cosmetics, by Distribution Channel, 2021
- Figure 28 : Canadian Market Shares of Bio-based Products in Cosmetics, by Type, 2021
- Figure 29 : Canadian Market Shares of Bio-based Products in Cosmetics, by Distribution Channel, 2021
- Figure 30 : Asia-Pacific Market Shares of Bio-based Products in Cosmetics, by Country, 2021
- Figure 31 : Asia-Pacific Market Shares of Bio-based Products in Cosmetics, by Type, 2021
- Figure 32 : Asia-Pacific Market Shares of Bio-based Products in Cosmetics, by Type, 2021
- Figure 33 : Chinese Market Shares of Bio-based Products in Cosmetics, by Type, 2021
- Figure 34 : Chinese Market Shares of Bio-based Products in Cosmetics, by Distribution Channel, 2021
- Figure 35 : Indian Market Shares of Bio-based Products in Cosmetics, by Type, 2021
- Figure 36 : Indian Market Shares of Bio-based Products in Cosmetics, by Distribution Channel, 2021
- Figure 37 : Japanese Market Shares of Bio-based Products in Cosmetics, by Type, 2021
- Figure 38 : Japanese Market Shares of Bio-based Products in Cosmetics, by Distribution Channel, 2021
- Figure 39 : South Korean Market Shares of Bio-based Products in Cosmetics, by Type, 2021
- Figure 40 : South Korean Market Shares of Bio-based Products in Cosmetics, by Distribution Channel, 2021
- Figure 41 : Rest of Asia-Pacific Market Shares of Bio-based Products in Cosmetics, by Type, 2021
- Figure 42 : Rest of Asia-Pacific Market Shares of Bio-based Products in Cosmetics, by Distribution Channel, 2021
- Figure 43 : European Market Shares of Bio-based Products in Cosmetics, by Country, 2021
- Figure 44 : European Market Shares of Bio-based Products in Cosmetics, by Type, 2021
- Figure 45 : European Market Shares of Bio-based Products in Cosmetics, by Distribution Channel, 2021
- Figure 46 : German Market Shares of Bio-based Products in Cosmetics, by Type, 2021
- Figure 47 : German Market Shares of Bio-based Products in Cosmetics, by Distribution Channel, 2021
- Figure 48 : French Market Shares of Bio-based Products in Cosmetics, by Type, 2021
- Figure 49 : French Market Shares of Bio-based Products in Cosmetics, by Distribution Channel, 2021
- Figure 50 : U.K. Market Shares of Bio-based Products in Cosmetics, by Type, 2021
- Figure 51 : U.K. Market Shares of Bio-based Products in Cosmetics, by Distribution Channel, 2021
- Figure 52 : Italian Market Shares of Bio-based Products in Cosmetics, by Type, 2021
- Figure 53 : Italian Market Shares of Bio-based Products in Cosmetics, by Distribution Channel, 2021
- Figure 54 : Rest of European Market Shares of Bio-based Products in Cosmetics, by Type, 2021
- Figure 55 : Rest of European Market Shares of Bio-based Products in Cosmetics, by Distribution Channel, 2021
- Figure 56 : Latin American Market Shares of Bio-based Products in Cosmetics, by Country, 2021
- Figure 57 : Latin American Market Shares of Bio-based Products in Cosmetics, by Type, 2021
- Figure 58 : Latin American Market Shares of Bio-based Products in Cosmetics, by Distribution Channel, 2021
- Figure 59 : Brazilian Market Shares of Bio-based Products in Cosmetics, by Type, 2021
- Figure 60 : Brazilian Market Shares of Bio-based Products in Cosmetics, by Distribution Channel, 2021
- Figure 61 : Mexican Market Shares of Bio-based Products in Cosmetics, by Type, 2021
- Figure 62 : Mexican Market Shares of Bio-based Products in Cosmetics, by Distribution Channel, 2021
- Figure 63 : Rest of Latin American Market Shares of Bio-based Products in Cosmetics, by Type, 2021
- Figure 64 : Rest of Latin American Market Shares of Bio-based Products in Cosmetics, by Distribution Channel, 2021
- Figure 65 : Middle Eastern and African Market Shares of Bio-based Products in Cosmetics, by Country, 2021
- Figure 66 : Middle Eastern and African Market Shares of Bio-based Products in Cosmetics, by Type, 2021
- Figure 67 : Middle Eastern and African Market Shares of Bio-based Products in Cosmetics, by Distribution Channel, 2021
- Figure 68 : GCC Consumption Expenditures: 2020
- Figure 69 : GCC Market Shares of Bio-based Products in Cosmetics, by Type, 2021
- Figure 70 : GCC Market Shares of Bio-based Products in Cosmetics, by Distribution Channel, 2021
- Figure 71 : Rest of Middle Eastern and African Market Shares of Bio-based Products in Cosmetics, by Type, 2021
- Figure 72 : Rest of Middle Eastern and African Market Shares of Bio-based Products in Cosmetics, by Distribution Channel, 2021
- Figure 73 : Fancl: Net Sales, 2019-2021
- Figure 74 : Fancl: Sales by Segment, 2021
- Figure 75 : Fancl: Sales by Channel, 2021
- Figure 76 : L'Occitane International S.A.: Net Sales, 2019 and 2020
- Figure 77 : L'Occitane International S.A.: Net Sales by Segment, 2020
- Figure 78 : L'Oreal S.A.: Consolidated Sales, 2019-2021
- Figure 79 : L'Oreal S.A.: Net Sales by Division, 2021
- Figure 80 : L'Oreal S.A.: Net Sales by Region, 2021
- Figure 81 : L'Oreal S.A.: Net Sales by Business Segment, 2021
- Figure 82 : Natura & Co.: Net Revenue, 2020 and 2021
- Figure 83 : Shiseido: Net Sales, 2019-2021
- Figure 84 : The Clorox Company: Net Sales, 2019-2021
- Figure 85 : The Clorox Company: Net Sales by Business segment, 2021
- Figure 86 : The Clorox Company: Sales, by Lifestyle, 2021
- Figure 87 : The Estee Lauder Companies Inc.: Net Sales, 2019-2021
- Figure 88 : The Estee Lauder Companies Inc.: Net Sales by Business segment, 2021
- Figure 89 : The Estee Lauder Companies Inc.: Net Sales by Region, 2021
- Figure 90 : Ulta Beauty Inc.: Net Revenue, 2019-2021
- Figure 91 : Ulta Beauty Inc.: Net Sales by Segment, 2021
- Figure 92 : Weleda Group.: Net Revenue, 2019 and 2020
- Figure 93 : Weleda Group.: Net Sales by Segment, 2020
Highlights:
The global bio-based products in cosmetics market should reach $7.4 billion by 2022 and more than $10.5 billion by 2027, with a compound annual growth rate (CAGR) of 7.1% during the forecast period of 2022-2027.
Skin care segment of the global bio-based products in cosmetics market should reach $3.4 billion by 2022 and more than $4.8 billion by 2027, with a CAGR of 6.9% during the forecast period of 2022-2027.
Decorative segment of the global bio-based products in cosmetics market should reach $2.4 billion by 2022 and more than $3.6 billion by 2027, with a CAGR of 7.9% during the forecast period of 2022-2027.
Report Scope:
The report analysis the global market based on segmentation of type and distribution modes. These segments are further analyzed at the global, regional, and country levels.
The base year considered for analyses is 2021, while the market estimates and forecasts are given from 2022 through 2027. The market estimates are only provided in terms of revenue and are provided in U.S. dollars.
The scope of products considered in the bio-based cosmetics market includes all kinds of cosmetics. We have included both fully and partially bio-based cosmetics in the market scope. The products which are excluded include soaps, oral care, perfumes, cologne, toiletries, and others.
The distribution channel includes -
- Online: E-commerce websites.
- Supermarkets and hypermarkets: Drug stores, pharmacies, supermarkets, departmental stores, hypermarkets
- Specialty stores: Natural and organic stores, specialized cosmetics, and beauty stores.
- Others: Salons, spas, pop-up stores, travel retail, direct sales, and others.
Report Includes:
- 59 data tables and 11 additional tables
- A comprehensive overview and up-to-date analysis of the global markets for bio-based products in cosmetic industry
- Analyses of the global market trends, with historic market revenue for 2021, estimates for 2022, forecasts for 2026, and projections of compound annual growth rates (CAGRs) through 2027
- Highlights of the upcoming market potential for bio-based products in cosmetic industry, growth driving factors, and areas of focus to forecast this market into various segments and sub-segments
- Estimation of the actual market size and revenue forecast for bio-based products in cosmetics market, and corresponding market share analysis based on product type, distribution channel, and region
- Updated information on key market drivers and opportunities, industry shifts and regulations, and other demographic factors that will influence this market demand in the coming years (2022-2027)
- Country specific data and market value analysis for the U.S., Canada, Mexico, Brazil, Japan, China, India, South Korea, Germany, U.K., France, Italy, Spain, Gulf Cooperation Council (GCC) countries, etc.
- Emphasis on the major growth strategies adopted by leading players in the bio-based products in cosmetics industry, recent market developments, product launches, and competitive benchmarking
- Identification of the major stakeholders and analysis of the competitive landscape based on recent developments and segmental revenues
- Company profiles of major players within the industry, including Loreal S.A., Natura & C.o., Shiseido Company Limited, The Clorox Company, The Estee Lauder Companies Inc. and Ulta Beauty Inc.
Table of Contents
Chapter 1 Introduction
- 1.1 Study Goals and Objectives
- 1.2 Reasons for Doing This Study
- 1.3 Scope of Report
- 1.4 Information Sources
- 1.5 Methodology
- 1.6 Geographic Breakdown
- 1.7 Analyst's Credentials
- 1.8 Related BCC Research Reports
Chapter 2 Summary and Highlights
Chapter 3 Market Overview
- 3.1 Definition
- 3.2 Market Background
- 3.2.1 Current concerns in the Cosmetics Market
- 3.2.2 Need for Biocosmetics
- 3.2.3 History and Evolution: A Journey from Natural to Petrol and Vice-versa
- 3.3 Product Advancements and R&D Initiatives
- 3.3.1 Green Biotechnology
- 3.3.2 Novel Technology for Bio-based Microplastics in Cosmetics
- 3.3.3 Green Synthesis of Nanoparticles
- 3.3.4 DSM- Pioneer in the Development of Bio-based Vitamin A
- 3.3.5 Environment-friendly Sun Protection Factor (SPF) Booster
- 3.3.6 Rice-based Biopolymer by BASF
- 3.3.7 Renewable Isododecane for Biocosmetics
- 3.3.8 Bio-based Surfactant by BASF
- 3.3.9 Bio-based Caprylyl Glycol
- 3.4 Bio-based Cosmetic Ingredient Analysis
- 3.4.1 Natural Emollients
- 3.4.2 Ingredients from Agricultural Bioproducts
- 3.4.3 Natural Waxes
- 3.4.4 Vegetable Butter
- 3.4.5 Medium-chain Triglyceride (MCT) Coconut Oil
- 3.4.6 Castor Oil
- 3.4.7 DMDM Hydantoin
- 3.5 List of Raw Material Suppliers
- 3.6 Packaging Trends
- 3.6.1 Key Features of Sustainable Packaging are Given Below:
Chapter 4 Market Dynamics
- 4.1 Market Dynamics
- 4.1.1 Growth Indicators and Trends
- 4.1.2 Challenges
- 4.1.3 Opportunities
- 4.2 COVID-19 Impact
- 4.2.1 Impact on Consumer Buying Preferences
- 4.2.2 Supply Chain Disruptions in 2020
- 4.2.3 Proliferation of Demand for Skincare Products
- 4.2.4 Overall Sales Declined in 2020
- 4.2.5 A Surge in Online Sales
- 4.3 Value Chain Analysis
- 4.4 Porter's Five Forces Analysis
- 4.4.1 Bargaining Power of Suppliers: Moderate
- 4.4.2 Threat of Rivalry: High
- 4.4.3 Threat of Substitutes: Low
- 4.4.4 Threat of Market Entry: Low
- 4.4.5 Bargaining Power of Buyers: High
- 4.5 Regulatory Analysis
- 4.5.1 USDA BioPreferred
- 4.5.2 The International Natural and Organic Cosmetics Association (NATRUE)
- 4.5.3 COSMOS
- 4.5.4 Soil Association
- 4.5.5 BDIH
- 4.5.6 ECOCERT
- 4.5.7 ICEA, Environmental and Ethical Certification Institute, Italy
Chapter 5 Market Analysis by Type
- 5.1 Skin Care
- 5.2 Hair Care
- 5.3 Decorative
Chapter 6 Market Analysis by Distribution Channel
- 6.1 Online
- 6.2 Supermarkets and Hypermarkets
- 6.3 Specialty Stores
- 6.4 Others
Chapter 7 Market Analysis by Region
- 7.1 North America
- 7.1.1 The U.S.
- 7.1.2 Canada
- 7.2 Asia-Pacific
- 7.2.1 China
- 7.2.2 India
- 7.2.3 Japan
- 7.2.4 South Korea
- 7.2.5 Rest of Asia-Pacific
- 7.3 Europe
- 7.3.1 Germany
- 7.3.2 France
- 7.3.3 The U.K.
- 7.3.4 Italy
- 7.3.5 Rest of Europe
- 7.4 Latin America
- 7.4.1 Brazil
- 7.4.2 Mexico
- 7.4.3 Rest of Latin America
- 7.5 Middle East and Africa (MEA)
- 7.5.1 Gulf Cooperation Council (GCC)
- 7.5.2 Rest of Middle East and Africa
Chapter 8 Competitive Landscape
- 8.1 Competitive Scenario Analysis
- 8.2 Strategic Market Developments
Chapter 9 Company Profiles
- BLISSOMA BOTANICAL BEAUTY
- FANCL CORP.
- L'OCCITANE INTERNATIONAL S.A.
- LOREAL S.A.
- NATIVE
- NATURA & C.O.
- RMS BEAUTY
- SEPHORA USA INC.
- SHISEIDO COMPANY LIMITED
- THE CLOROX COMPANY
- THE ESTEE LAUDER COMPANIES INC.
- ULTA BEAUTY INC.
- UNILEVER
- WELEDA AG
Chapter 10 Appendix: List of Associations and Government Bodies
- List of Associations and Government Bodies