|
|
市場調査レポート
商品コード
1485827
プラスチック光ファイバー市場:ケーブルタイプ別、素材別、用途別、業界別、国別、地域別-2024年~2032年の産業分析、市場規模、市場シェア、予測Plastic Optic Fiber Market, By Cable Type, By Material, By Application, By Industry Verticals, By Country, and By Region - Industry Analysis, Market Size, Market Share & Forecast from 2024-2032 |
||||||
|
|||||||
カスタマイズ可能
|
|||||||

| プラスチック光ファイバー市場:ケーブルタイプ別、素材別、用途別、業界別、国別、地域別-2024年~2032年の産業分析、市場規模、市場シェア、予測 |
|
出版日: 2024年05月04日
発行: AnalystView Market Insights
ページ情報: 英文 322 Pages
納期: 2~3営業日
|

全表示
- 概要
- 図表
- 目次
レポートハイライト
プラスチック光ファイバー市場規模は2023年に59億821万米ドルとなり、2024年から2032年にかけてCAGR 8.91%で拡大
プラスチック光ファイバー市場-市場力学
医療用途における安全性と生体適合性への要求の高まりが市場成長を促進する見込み
安全性と生体適合性の特性から、医療用途でPOFのニーズが高まっています。低侵襲処置の受け入れ拡大、医療画像診断の進歩に伴い、POFは内視鏡、光治療装置、手術器具などでの活用に大きな可能性を提供しています。Digestive Diseases and Scienceによると、年間1,770万件以上の胃腸(GI)内視鏡処置が行われており、米国全体の内視鏡取引の68%を占めています。さらに、産業オートメーションとセンシングの進歩が進むことで、市場に成長機会が生まれる可能性があります。とはいえ、帯域幅や伝送距離の制限といった要因によって市場成長は制限される可能性があります。
プラスチック光ファイバー市場-主な洞察
当社のリサーチアナリストが共有した分析によると、世界市場は予測期間(2024-2032年)に約8.91%のCAGRで毎年成長すると予測されています。
ケーブルタイプ別では、マルチモードが2023年に最大市場シェアを示すと予測されています。
素材別では、PMMA(ポリメチルメタクリレート)が2023年の主要タイプです。
業界別では、通信とITが2023年の主要タイプでした。
地域別では、アジア太平洋地域が2023年の主要収益源であった
プラスチック光ファイバー市場-セグメンテーション分析:
世界のプラスチック光ファイバー市場は、ケーブルタイプ、材料、用途、業界別、地域別に区分されます。
市場はケーブルタイプによって2つに分類される:シングルモードとマルチモードです。マルチモードが市場の大半を占めています。マルチモードPOFは、通常数百メートル以内の短い距離でのデータ伝送に最適です。車載通信システム、ホームネットワーク、産業用オートメーション、家電製品など、比較的距離が短い分野で幅広く使用されています。
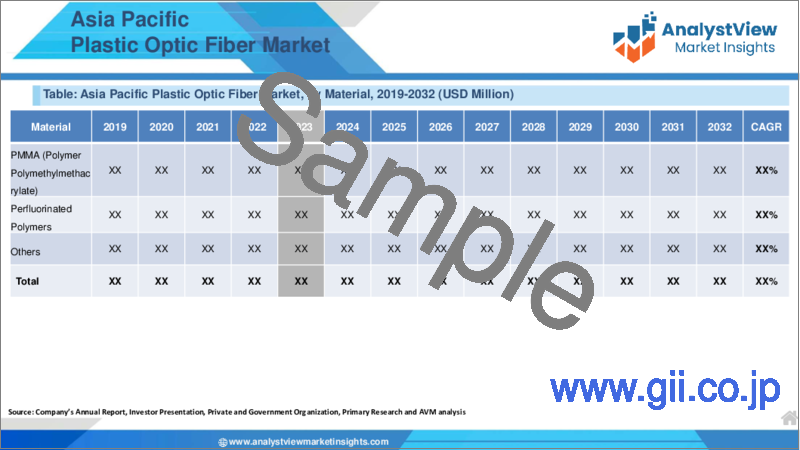
市場は素材によって2つのグループに分類される:PMMA(ポリメチルメタクリレート)、パーフルオロポリマー、その他。PMMA(高分子ポリメチルメタクリレート)が市場の大半のシェアを占めています。PMMAは、高い透明性や可視波長での光減衰の少なさなど、卓越した光学特性を持つため、POFの主要材料として一般的に利用されています。
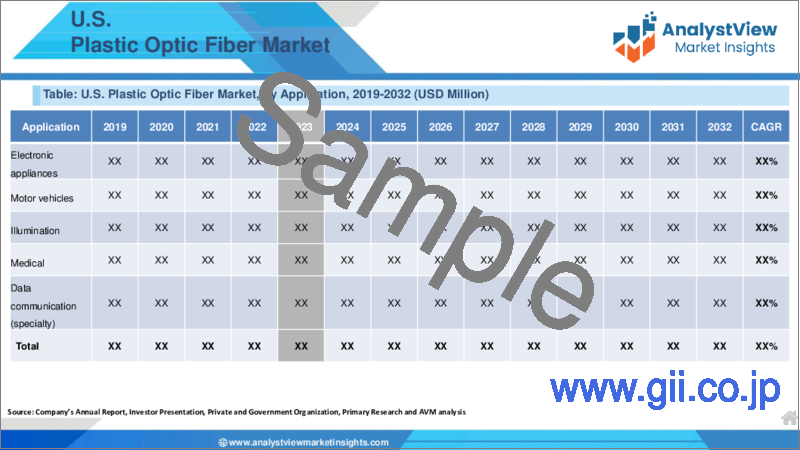
市場は用途別に6つのセグメントに分類される:電子機器、自動車、照明、医療、データ通信(特殊)、民間航空機、その他。その柔軟性、信頼性、性能特性により、幅広い用途で高速データ伝送、照明、センシング、コネクティビティ・ソリューションの実現に適した選択肢となっています。
市場は6つの業界別に区分される:テレコム・IT、公共セクター、ヘルスケア、エネルギー・公益事業、航空宇宙・防衛、製造、その他です。市場の支配的な分野は電気通信とITです。プラスチック光ファイバーは、通信・IT分野で重要な役割を果たしており、ホームネットワーキング、ラストマイル接続、LAN環境、産業用ネットワーキング、データセンター、無線通信システム、通信インフラ拡張など様々な分野でメリットを提供しています。
プラスチック光ファイバー市場-地理的洞察
地理的には、市場は北米、ラテンアメリカ、欧州、アジア太平洋、中東アフリカにまたがります。これらの地域は、事業の成長に貢献している国によってさらに細分化されます。アジア太平洋地域は、ブロードバンドネットワークやモバイルサービスなど通信インフラの急速な整備が進み、市場拡大をリードしています。アジア太平洋地域では、インターネット普及率の上昇、高速接続に対する高い需要、さまざまな分野でのデジタル技術の採用により、通信インフラ整備が大幅に増加しています。この成長の急増は、ブロードバンドネットワークとモバイルサービスの展開を促進するため、プラスチック光ファイバーを含む光ファイバーソリューションの需要を押し上げています。中国の通信業界は2024年第1四半期に着実な成長を遂げ、工業・情報化省が発表した公式データによると、この分野の企業の事業収益の合計は期間中に4,437億元(約624億4,000万米国ドル)に達し、前年同期比4.5%増を記録しました。欧州は、スマートシティ構想の高まりに起因する市場成長で第2位の地域となっています。
プラスチック光ファイバー市場-競合情勢:
各社は、帯域幅の拡大、減衰の低減、耐久性の向上、新しいアプリケーションとの互換性など、性能特性の向上を実現する革新的なPOFソリューションの開発と市場投入を競っています。この市場における競争優位の主な促進要因は、POF材料、製造プロセス、光ネットワーキング技術を改善するための研究開発(R&D)への投資です。企業は、効果的に顧客をターゲットにして市場シェアを拡大するために、市場での存在感を高め、効率的な流通チャネルを確立する必要があります。そのためには、ディストリビューター、再販業者、相手先ブランド製造業者(OEM)とパートナーシップを結ぶだけでなく、主要な産業分野や地域に向けて直接販売活動を行う必要があるかもしれないです。
目次
第1章 プラスチック光ファイバー市場概要
- 調査範囲
- 市場推定年
第2章 エグゼクティブサマリー
- 市場内訳
- 競合考察
第3章 プラスチック光ファイバーの主要市場動向
- 市場促進要因
- 市場抑制要因
- 市場機会
- 市場の将来動向
第4章 プラスチック光ファイバー産業の調査
- PEST分析
- ポーターのファイブフォース分析
- 成長見通しマッピング
- 規制枠組み分析
第5章 プラスチック光ファイバー市場: COVID-19の影響分析
- COVID-19以前の影響分析
- COVID-19後の影響分析
第6章 プラスチック光ファイバー市場情勢
- プラスチック光ファイバー市場シェア分析、2023年
- 主要メーカー別内訳データ
- 既存企業の分析
- 新興企業の分析
第7章 プラスチック光ファイバー市場- ケーブルタイプ別
- 概要
- ケーブルタイプ別セグメントシェア分析
- シングルモード
- マルチモード
第8章 プラスチック光ファイバー市場- 素材別
- 概要
- セグメントシェア分析(素材別)
- PMMA(ポリマーポリメチルメタクリレート)
- フッ素化ポリマー
- その他
第9章 プラスチック光ファイバー市場- 用途別
- 概要
- 用途別セグメントシェア分析
- 電化製品
- 自動車
- イルミネーション
- 医療
- データ通信(専門)
- 民間航空機
- その他
第10章 プラスチック光ファイバー市場- 業界別
- 概要
- 業界別セグメントシェア分析
- 通信・IT
- 公的機関
- ヘルスケア
- エネルギーと公共事業
- 航空宇宙および防衛
- 製造業
- その他
第11章 プラスチック光ファイバー市場-地域
- イントロダクション
- 北米
- 概要
- 北米の主要メーカー
- 米国
- カナダ
- 欧州
- 概要
- 欧州の主要メーカー
- ドイツ
- イタリア
- 英国
- フランス
- ロシア
- オランダ
- スウェーデン
- ポーランド
- その他
- アジア太平洋(APAC)
- 概要
- アジア太平洋の主要メーカー
- インド
- 中国
- 日本
- 韓国
- オーストラリア
- タイ
- インドネシア
- フィリピン
- その他
- ラテンアメリカ
- 概要
- ラテンアメリカの主要メーカー
- ブラジル
- メキシコ
- アルゼンチン
- コロンビア
- その他
- 中東・アフリカ
- 概要
- 中東・アフリカの主要メーカー
- サウジアラビア
- アラブ首長国連邦
- イスラエル
- トルコ
- アルジェリア
- エジプト
- その他
第12章 主要ベンダー分析- プラスチック光ファイバー業界
- 競合ダッシュボード
- 企業プロファイル
- AFL
- Birla Furukawa Fiber Optics Limited
- Corning Incorporated
- Finolex Cables Limited
- Molex, LLC
- OFS Fitel, LLC
- Optical Cable Corporation(OCC)
- Prysmian Group
- Sterlite Technologies Limited
- Yangtze Optical Fiber and Cable Joint Stock Limited Company(YOFC)
- Others
第13章 アナリストの全方位展望
List of Tables
- TABLE List of data sources
- TABLE Market drivers; Impact Analysis
- TABLE Market restraints; Impact Analysis
- TABLE Plastic Optic Fiber Market: Cable Type Snapshot (2023)
- TABLE Segment Dashboard; Definition and Scope, by Cable Type
- TABLE Global Plastic Optic Fiber Market, by Cable Type 2019-2032 (USD Million)
- TABLE Plastic Optic Fiber Market: Material Snapshot (2023)
- TABLE Segment Dashboard; Definition and Scope, by Material
- TABLE Global Plastic Optic Fiber Market, by Material 2019-2032 (USD Million)
- TABLE Plastic Optic Fiber Market: Application Snapshot (2023)
- TABLE Segment Dashboard; Definition and Scope, by Application
- TABLE Global Plastic Optic Fiber Market, by Application 2019-2032 (USD Million)
- TABLE Plastic Optic Fiber Market: Industry Verticals Snapshot (2023)
- TABLE Segment Dashboard; Definition and Scope, by Industry Verticals
- TABLE Global Plastic Optic Fiber Market, by Industry Verticals 2019-2032 (USD Million)
- TABLE Plastic Optic Fiber Market: Regional snapshot (2023)
- TABLE Segment Dashboard; Definition and Scope, by Region
- TABLE Global Plastic Optic Fiber Market, by Region 2019-2032 (USD Million)
- TABLE North America Plastic Optic Fiber Market, by Country, 2019-2032 (USD Million)
- TABLE North America Plastic Optic Fiber Market, by Cable Type, 2019-2032 (USD Million)
- TABLE North America Plastic Optic Fiber Market, by Material, 2019-2032 (USD Million)
- TABLE North America Plastic Optic Fiber Market, by Application, 2019-2032 (USD Million)
- TABLE North America Plastic Optic Fiber Market, by Industry Verticals, 2019-2032 (USD Million)
- TABLE Europe Plastic Optic Fiber Market, by Country, 2019-2032 (USD Million)
- TABLE Europe Plastic Optic Fiber Market, by Cable Type, 2019-2032 (USD Million)
- TABLE Europe Plastic Optic Fiber Market, by Material, 2019-2032 (USD Million)
- TABLE Europe Plastic Optic Fiber Market, by Application, 2019-2032 (USD Million)
- TABLE Europe Plastic Optic Fiber Market, by Industry Verticals, 2019-2032 (USD Million)
- TABLE Asia Pacific Plastic Optic Fiber Market, by Country, 2019-2032 (USD Million)
- TABLE Asia Pacific Plastic Optic Fiber Market, by Cable Type, 2019-2032 (USD Million)
- TABLE Asia Pacific Plastic Optic Fiber Market, by Material, 2019-2032 (USD Million)
- TABLE Asia Pacific Plastic Optic Fiber Market, by Application, 2019-2032 (USD Million)
- TABLE Asia Pacific Plastic Optic Fiber Market, by Industry Verticals, 2019-2032 (USD Million)
- TABLE Latin America Plastic Optic Fiber Market, by Country, 2019-2032 (USD Million)
- TABLE Latin America Plastic Optic Fiber Market, by Cable Type, 2019-2032 (USD Million)
- TABLE Latin America Plastic Optic Fiber Market, by Material, 2019-2032 (USD Million)
- TABLE Latin America Plastic Optic Fiber Market, by Application, 2019-2032 (USD Million)
- TABLE Latin America Plastic Optic Fiber Market, by Industry Verticals, 2019-2032 (USD Million)
- TABLE Middle East and Africa Plastic Optic Fiber Market, by Country, 2019-2032 (USD Million)
- TABLE Middle East and Africa Plastic Optic Fiber Market, by Cable Type, 2019-2032 (USD Million)
- TABLE Middle East and Africa Plastic Optic Fiber Market, by Material, 2019-2032 (USD Million)
- TABLE Middle East and Africa Plastic Optic Fiber Market, by Application, 2019-2032 (USD Million)
- TABLE Middle East and Africa Plastic Optic Fiber Market, by Industry Verticals, 2019-2032 (USD Million)
REPORT HIGHLIGHT
Plastic Optic Fiber Market size was valued at USD 5,908.21 million in 2023, expanding at a CAGR of 8.91% from 2024 to 2032.
Polymer optical fiber (POF) is a unique type of optical fiber manufactured from polymer materials. Various optical polymers such as polymethyl-methacrylate (PMMA), amorphous fluorinated polymer (CYTOP), polystyrene (PS), and polycarbonate (PC) are utilized in the production of POFs. POF offers several benefits for sensing applications, such as superior high fracture toughness, elastic strain limits, excellent flexibility in bending, as well as heightened sensitivity to strain. Notably, the high elastic strain limits (10-15%) present a significant advantage in RTP monitoring, surpassing the 6% limit of traditional small-diameter silica optical fiber.
Plastic Optic Fiber Market- Market Dynamics
Increasing demand for safety and biocompatibility in medical applications is expected to propel the market growth
There is a rising need for POF in medical applications because of its safety and biocompatibility characteristics. With the growing acceptance of minimally invasive procedures and advancements in medical imaging and diagnostics, POFs offer significant potential for utilization in endoscopes, light therapy devices, surgical instruments, and more. According to Digestive Diseases and Science, more than 17.7 million gastrointestinal (GI) endoscopic procedures are conducted yearly, making up 68% of all endoscopic dealings across the United States. Additionally, the increasing progress in Industrial Automation and Sensing could create growth opportunities for the market. Nevertheless, the market growth might be limited by factors such as Limited Bandwidth and Transmission Distance.
Plastic Optic Fiber Market- Key Insights
As per the analysis shared by our research analyst, the global market is estimated to grow annually at a CAGR of around 8.91% over the forecast period (2024-2032)
Based on Cable Type segmentation, Multi-Mode was predicted to show maximum market share in the year 2023
Based on Material segmentation, PMMA (Polymer Polymethylmethacrylate) was the leading type in 2023
Based on Industry vertical segmentation, Telecom and IT were the leading types in 2023
Based on region, Asia Pacific was the leading revenue generator in 2023
Plastic Optic Fiber Market- Segmentation Analysis:
The Global Plastic Optic Fiber Market is segmented based on Cable Type, Material, Application, Industry Verticals, and Region.
The market is categorized into two sections according to Cable Type: Single Mode and Multi-Mode. Multi-mode holds the majority in the market. Multimode POFs are ideal for transmitting data over short distances, usually within a few hundred meters. They find extensive usage in automotive communications systems, home networking, industrial automation, and consumer electronics, where the distances covered are relatively short.
The market is categorized into two groups according to Material: PMMA (Polymer Polymethylmethacrylate), Perfluorinated Polymers, and other materials. PMMA (Polymer Polymethylmethacrylate) holds the majority share in the market. PMMA is commonly utilized as the primary material in POFs because of its exceptional optical characteristics, such as high transparency and minimal optical attenuation at visible wavelengths.
The market is categorized into six segments based on Application: Electronic appliances, Motor vehicles, Illumination, Medical, Data communication (specialty), Commercial Aircraft, and Others. Its flexibility, dependability, and performance attributes establish it as the preferred option for enabling high-speed data transmission, lighting, sensing, and connectivity solutions in a wide array of applications.
The market is segmented into six industry verticals: Telecom and IT, Public sector, Healthcare, Energy and utilities, Aerospace and Defense, Manufacturing, and Others. The dominant sector in the market is Telecom and IT. Plastic optic fiber plays a crucial role in the telecom and IT sectors, providing benefits in various areas such as home networking, last-mile connectivity, LAN environments, industrial networking, data centers, wireless communication systems, and telecommunications infrastructure expansion.
Plastic Optic Fiber Market- Geographical Insights
Geographically, the market spans across North America, Latin America, Europe, Asia Pacific, and the Middle East and Africa. These regions are further segmented by countries contributing to business growth. The Asia Pacific region leads in market expansion, driven by the rapid development of telecommunications infrastructure like broadband networks and mobile services in countries across the region. The Asia-Pacific area is witnessing a significant increase in telecommunications infrastructure development due to the growing internet penetration, high demand for fast connectivity, and the adoption of digital technologies in various sectors. This surge in growth is boosting the demand for optical fiber solutions, including plastic optic fiber, to facilitate the deployment of broadband networks and mobile services. China's telecommunications industry saw steady growth in the first quarter of 2024, with official data indicating that the combined business revenue of companies in this sector reached 443.7 billion yuan (approximately 62.44 billion U.S. dollars) during the period, marking a 4.5 percent year-on-year increase, as reported by the Ministry of Industry and Information Technology. Europe follows as the second-largest region for market growth, attributed to the rising number of smart city initiatives.
Plastic Optic Fiber Market- Competitive Landscape:
Companies compete to create and bring to market innovative POF solutions that offer enhanced performance characteristics, including increased bandwidth, reduced attenuation, improved durability, and compatibility with new applications. The key drivers of competitive advantage in this market are investments in research and development (R&D) to improve POF materials, manufacturing processes, and optical networking technologies. Companies need to establish a strong market presence and efficient distribution channels to effectively target customers and expand their market share. This may require forming partnerships with distributors, resellers, and original equipment manufacturers (OEMs), as well as engaging in direct sales efforts aimed at key industry sectors and geographic regions.
Recent Developments:
On March 29, 2024, a consortium consisting of networking, semiconductor, and optics firms established the Linear Pluggable Optics Multi-Source Agreement (LPO MSA) to create standards for networking devices and optical components necessary to support a diverse range of compatible LPO solutions. Semtech Corporation, NVIDIA, Intel, and Broadcom are the founding members of this initiative, which focuses on addressing the industry-wide issue of enhancing the efficiency, affordability, and speed of high-speed optical connections, as well as boosting their dependability.
SCOPE OF THE REPORT
The scope of this report covers the market by its major segments, which include as follows:
GLOBAL PLASTIC OPTIC FIBER MARKET KEY PLAYERS- DETAILED COMPETITIVE INSIGHTS
AFL
Birla Furukawa Fiber Optics Limited
Corning Incorporated
Finolex Cables Limited
Molex, LLC
OFS Fitel, LLC
Optical Cable Corporation (OCC)
Prysmian Group
Sterlite Technologies Limited
Yangtze Optical Fiber and Cable Joint Stock Limited Company (YOFC)
Others
GLOBAL PLASTIC OPTIC FIBER MARKET, BY CABLE TYPE- MARKET ANALYSIS, 2019 - 2032
- Single Mode
- Multi-Mode
GLOBAL PLASTIC OPTIC FIBER MARKET, BY MATERIAL- MARKET ANALYSIS, 2019 - 2032
- PMMA (Polymer Polymethylmethacrylate)
- Perfluorinated Polymers
- Others
GLOBAL PLASTIC OPTIC FIBER MARKET, BY APPLICATION- MARKET ANALYSIS, 2019 - 2032
- Electronic appliances
- Motor vehicles
- Illumination
- Medical
- Data communication (specialty)
- Commercial aircraft
- Others
GLOBAL PLASTIC OPTIC FIBER MARKET, BY INDUSTRY VERTICALS- MARKET ANALYSIS, 2019 - 2032
- Telecom and IT
- Public sector
- Healthcare
- Energy and utilities
- Aerospace and defense
- Manufacturing
- Others
GLOBAL PLASTIC OPTIC FIBER MARKET, BY REGION- MARKET ANALYSIS, 2019 - 2032
- North America
- The U.S.
- Canada
- Europe
- Germany
- France
- Italy
- Spain
- United Kingdom
- Russia
- Netherlands
- Sweden
- Poland
- Rest of Europe
- Asia Pacific
- India
- China
- South Korea
- Japan
- Australia
- Thailand
- Indonesia
- Philippines
- Rest of APAC
- Latin America
- Brazil
- Mexico
- Argentina
- Colombia
- Rest of LATAM
- The Middle East and Africa
- Saudi Arabia
- United Arab Emirates
- Israel
- Turkey
- Algeria
- Egypt
- Rest of MEA
Table of Contents
1.Plastic Optic Fiber Market Overview
- 1.1.Study Scope
- 1.2.Market Estimation Years
2.Executive Summary
- 2.1.Market Snippet
- 2.1.1.Plastic Optic Fiber Market Snippet by Cable Type
- 2.1.2.Plastic Optic Fiber Market Snippet by Material
- 2.1.3.Plastic Optic Fiber Market Snippet by Application
- 2.1.4.Plastic Optic Fiber Market Snippet by Industry Verticals
- 2.1.5.Plastic Optic Fiber Market Snippet by Country
- 2.1.6.Plastic Optic Fiber Market Snippet by Region
- 2.2.Competitive Insights
3.Plastic Optic Fiber Key Market Trends
- 3.1.Plastic Optic Fiber Market Drivers
- 3.1.1.Impact Analysis of Market Drivers
- 3.2.Plastic Optic Fiber Market Restraints
- 3.2.1.Impact Analysis of Market Restraints
- 3.3.Plastic Optic Fiber Market Opportunities
- 3.4.Plastic Optic Fiber Market Future Trends
4.Plastic Optic Fiber Industry Study
- 4.1.PEST Analysis
- 4.2.Porter's Five Forces Analysis
- 4.3.Growth Prospect Mapping
- 4.4.Regulatory Framework Analysis
5.Plastic Optic Fiber Market: COVID-19 Impact Analysis
- 5.1.Pre-COVID-19 Impact Analysis
- 5.2.Post-COVID-19 Impact Analysis
- 5.2.1.Top Performing Segments
- 5.2.2.Marginal Growth Segments
- 5.2.3.Top Looser Segments
- 5.2.4.Marginal Loss Segments
6.Plastic Optic Fiber Market Landscape
- 6.1.Plastic Optic Fiber Market Share Analysis, 2023
- 6.2.Breakdown Data, by Key Manufacturer
- 6.2.1.Established Players' Analysis
- 6.2.2.Emerging Players' Analysis
7.Plastic Optic Fiber Market - By Cable Type
- 7.1.Overview
- 7.1.1.Segment Share Analysis, By Cable Type, 2023 & 2032 (%)
- 7.1.2.Single Mode
- 7.1.3.Multi-Mode
8.Plastic Optic Fiber Market - By Material
- 8.1.Overview
- 8.1.1.Segment Share Analysis, By Material, 2023 & 2032 (%)
- 8.1.2.PMMA (Polymer Polymethylmethacrylate)
- 8.1.3.Perfluorinated Polymers
- 8.1.4.Others
9.Plastic Optic Fiber Market - By Application
- 9.1.Overview
- 9.1.1.Segment Share Analysis, By Application, 2023 & 2032 (%)
- 9.1.2.Electronic appliances
- 9.1.3.Motor vehicles
- 9.1.4.Illumination
- 9.1.5.Medical
- 9.1.6.Data communication (specialty)
- 9.1.7.Commercial aircraft
- 9.1.8.Others
10.Plastic Optic Fiber Market - By Industry Verticals
- 10.1.Overview
- 10.1.1.Segment Share Analysis, By Industry Verticals, 2023 & 2032 (%)
- 10.1.2.Telecom and IT
- 10.1.3.Public sector
- 10.1.4.Healthcare
- 10.1.5.Energy and utilities
- 10.1.6.Aerospace and defense
- 10.1.7.Manufacturing
- 10.1.8.Others
11.Plastic Optic Fiber Market- By Geography
- 11.1.Introduction
- 11.1.1.Segment Share Analysis, By Geography, 2023 & 2032 (%)
- 11.2.North America
- 11.2.1.Overview
- 11.2.2.Plastic Optic Fiber Key Manufacturers in North America
- 11.2.3.North America Market Size and Forecast, By Country, 2019 - 2032 (US$ Million)
- 11.2.4.North America Market Size and Forecast, By Cable Type, 2019 - 2032 (US$ Million)
- 11.2.5.North America Market Size and Forecast, By Material, 2019 - 2032 (US$ Million)
- 11.2.6.North America Market Size and Forecast, By Application, 2019 - 2032 (US$ Million)
- 11.2.7.North America Market Size and Forecast, By Industry Verticals, 2019 - 2032 (US$ Million)
- 11.2.8.U.S.
- 11.2.8.1.Overview
- 11.2.8.2.Market Analysis, Forecast, and Y-O-Y Growth Rate, 2019 - 2032, (US$ Million)
- 11.2.8.3.U.S. Market Size and Forecast, By Cable Type, 2019 - 2032 (US$ Million)
- 11.2.8.4.U.S. Market Size and Forecast, By Material, 2019 - 2032 (US$ Million)
- 11.2.8.5.U.S. Market Size and Forecast, By Application, 2019 - 2032 (US$ Million)
- 11.2.8.6.U.S. Market Size and Forecast, By Industry Verticals, 2019 - 2032 (US$ Million)
- 11.2.9.Canada
- 11.2.9.1.Overview
- 11.2.9.2.Market Analysis, Forecast, and Y-O-Y Growth Rate, 2019 - 2032, (US$ Million)
- 11.2.9.3.Canada Market Size and Forecast, By Cable Type, 2019 - 2032 (US$ Million)
- 11.2.9.4.Canada Market Size and Forecast, By Material, 2019 - 2032 (US$ Million)
- 11.2.9.5.Canada Market Size and Forecast, By Application, 2019 - 2032 (US$ Million)
- 11.2.9.6.Canada Market Size and Forecast, By Industry Verticals, 2019 - 2032 (US$ Million)
- 11.3.Europe
- 11.3.1.Overview
- 11.3.2.Plastic Optic Fiber Key Manufacturers in Europe
- 11.3.3.Europe Market Size and Forecast, By Country, 2019 - 2032 (US$ Million)
- 11.3.4.Europe Market Size and Forecast, By Cable Type, 2019 - 2032 (US$ Million)
- 11.3.5.Europe Market Size and Forecast, By Material, 2019 - 2032 (US$ Million)
- 11.3.6.Europe Market Size and Forecast, By Application, 2019 - 2032 (US$ Million)
- 11.3.7.Europe Market Size and Forecast, By Industry Verticals, 2019 - 2032 (US$ Million)
- 11.3.8.Germany
- 11.3.8.1.Overview
- 11.3.8.2.Market Analysis, Forecast, and Y-O-Y Growth Rate, 2019 - 2032, (US$ Million)
- 11.3.8.3.Germany Market Size and Forecast, By Cable Type, 2019 - 2032 (US$ Million)
- 11.3.8.4.Germany Market Size and Forecast, By Material, 2019 - 2032 (US$ Million)
- 11.3.8.5.Germany Market Size and Forecast, By Application, 2019 - 2032 (US$ Million)
- 11.3.8.6.Germany Market Size and Forecast, By Industry Verticals, 2019 - 2032 (US$ Million)
- 11.3.9.Italy
- 11.3.9.1.Overview
- 11.3.9.2.Market Analysis, Forecast, and Y-O-Y Growth Rate, 2019 - 2032, (US$ Million)
- 11.3.9.3.Italy Market Size and Forecast, By Cable Type, 2019 - 2032 (US$ Million)
- 11.3.9.4.Italy Market Size and Forecast, By Material, 2019 - 2032 (US$ Million)
- 11.3.9.5.Italy Market Size and Forecast, By Application, 2019 - 2032 (US$ Million)
- 11.3.9.6.Italy Market Size and Forecast, By Industry Verticals, 2019 - 2032 (US$ Million)
- 11.3.10.United Kingdom
- 11.3.10.1.Overview
- 11.3.10.2.Market Analysis, Forecast, and Y-O-Y Growth Rate, 2019 - 2032, (US$ Million)
- 11.3.10.3.United Kingdom Market Size and Forecast, By Cable Type, 2019 - 2032 (US$ Million)
- 11.3.10.4.United Kingdom Market Size and Forecast, By Material, 2019 - 2032 (US$ Million)
- 11.3.10.5.United Kingdom Market Size and Forecast, By Application, 2019 - 2032 (US$ Million)
- 11.3.10.6.United Kingdom Market Size and Forecast, By Industry Verticals, 2019 - 2032 (US$ Million)
- 11.3.11.France
- 11.3.11.1.Overview
- 11.3.11.2.Market Analysis, Forecast, and Y-O-Y Growth Rate, 2019 - 2032, (US$ Million)
- 11.3.11.3.France Market Size and Forecast, By Cable Type, 2019 - 2032 (US$ Million)
- 11.3.11.4.France Market Size and Forecast, By Material, 2019 - 2032 (US$ Million)
- 11.3.11.5.France Market Size and Forecast, By Application, 2019 - 2032 (US$ Million)
- 11.3.11.6.France Market Size and Forecast, By Industry Verticals, 2019 - 2032 (US$ Million)
- 11.3.12.Russia
- 11.3.12.1.Market Analysis, Forecast, and Y-O-Y Growth Rate, 2019 - 2032, (US$ Million)
- 11.3.12.2.Russia Market Size and Forecast, By Cable Type, 2019 - 2032 (US$ Million)
- 11.3.12.3.Russia Market Size and Forecast, By Material, 2019 - 2032 (US$ Million)
- 11.3.12.4.Russia Market Size and Forecast, By Application, 2019 - 2032 (US$ Million)
- 11.3.12.5.Russia Market Size and Forecast, By Industry Verticals, 2019 - 2032 (US$ Million)
- 11.3.13.Netherlands
- 11.3.13.1.Market Analysis, Forecast, and Y-O-Y Growth Rate, 2019 - 2032, (US$ Million)
- 11.3.13.2.Netherlands Market Size and Forecast, By Cable Type, 2019 - 2032 (US$ Million)
- 11.3.13.3.Netherlands Market Size and Forecast, By Material, 2019 - 2032 (US$ Million)
- 11.3.13.4.Netherlands Market Size and Forecast, By Application, 2019 - 2032 (US$ Million)
- 11.3.13.5.Netherlands Market Size and Forecast, By Industry Verticals, 2019 - 2032 (US$ Million)
- 11.3.14.Sweden
- 11.3.14.1.Market Analysis, Forecast, and Y-O-Y Growth Rate, 2019 - 2032, (US$ Million)
- 11.3.14.2.Sweden Market Size and Forecast, By Cable Type, 2019 - 2032 (US$ Million)
- 11.3.14.3.Sweden Market Size and Forecast, By Material, 2019 - 2032 (US$ Million)
- 11.3.14.4.Sweden Market Size and Forecast, By Application, 2019 - 2032 (US$ Million)
- 11.3.14.5.Sweden Market Size and Forecast, By Industry Verticals, 2019 - 2032 (US$ Million)
- 11.3.15.Poland
- 11.3.15.1.Market Analysis, Forecast, and Y-O-Y Growth Rate, 2019 - 2032, (US$ Million)
- 11.3.15.2.Poland Market Size and Forecast, By Cable Type, 2019 - 2032 (US$ Million)
- 11.3.15.3.Poland Market Size and Forecast, By Material, 2019 - 2032 (US$ Million)
- 11.3.15.4.Poland Market Size and Forecast, By Application, 2019 - 2032 (US$ Million)
- 11.3.15.5.Poland Market Size and Forecast, By Industry Verticals, 2019 - 2032 (US$ Million)
- 11.3.16.Rest of Europe
- 11.3.16.1.Overview
- 11.3.16.2.Market Analysis, Forecast, and Y-O-Y Growth Rate, 2019 - 2032, (US$ Million)
- 11.3.16.3.Rest of the Europe Market Size and Forecast, By Cable Type, 2019 - 2032 (US$ Million)
- 11.3.16.4.Rest of the Europe Market Size and Forecast, By Material, 2019 - 2032 (US$ Million)
- 11.3.16.5.Rest of the Europe Market Size and Forecast, By Application, 2019 - 2032 (US$ Million)
- 11.3.16.6.Rest of the Europe Market Size and Forecast, By Industry Verticals, 2019 - 2032 (US$ Million)
- 11.4.Asia Pacific (APAC)
- 11.4.1.Overview
- 11.4.2.Plastic Optic Fiber Key Manufacturers in Asia Pacific
- 11.4.3.Asia Pacific Market Size and Forecast, By Country, 2019 - 2032 (US$ Million)
- 11.4.4.Asia Pacific Market Size and Forecast, By Cable Type, 2019 - 2032 (US$ Million)
- 11.4.5.Asia Pacific Market Size and Forecast, By Material, 2019 - 2032 (US$ Million)
- 11.4.6.Asia Pacific Market Size and Forecast, By Application, 2019 - 2032 (US$ Million)
- 11.4.7.Asia Pacific Market Size and Forecast, By Industry Verticals, 2019 - 2032 (US$ Million)
- 11.4.8.India
- 11.4.8.1.Overview
- 11.4.8.2.Market Analysis, Forecast, and Y-O-Y Growth Rate, 2019 - 2032, (US$ Million)
- 11.4.8.3.India Market Size and Forecast, By Cable Type, 2019 - 2032 (US$ Million)
- 11.4.8.4.India Market Size and Forecast, By Material, 2019 - 2032 (US$ Million)
- 11.4.8.5.India Market Size and Forecast, By Application, 2019 - 2032 (US$ Million)
- 11.4.8.6.India Market Size and Forecast, By Industry Verticals, 2019 - 2032 (US$ Million)
- 11.4.9.China
- 11.4.9.1.Overview
- 11.4.9.2.Market Analysis, Forecast, and Y-O-Y Growth Rate, 2019 - 2032, (US$ Million)
- 11.4.9.3.China Market Size and Forecast, By Cable Type, 2019 - 2032 (US$ Million)
- 11.4.9.4.China Market Size and Forecast, By Material, 2019 - 2032 (US$ Million)
- 11.4.9.5.China Market Size and Forecast, By Application, 2019 - 2032 (US$ Million)
- 11.4.9.6.China Market Size and Forecast, By Industry Verticals, 2019 - 2032 (US$ Million)
- 11.4.10.Japan
- 11.4.10.1.Overview
- 11.4.10.2.Market Analysis, Forecast, and Y-O-Y Growth Rate, 2019 - 2032, (US$ Million)
- 11.4.10.3.Japan Market Size and Forecast, By Cable Type, 2019 - 2032 (US$ Million)
- 11.4.10.4.Japan Market Size and Forecast, By Material, 2019 - 2032 (US$ Million)
- 11.4.10.5.Japan Market Size and Forecast, By Application, 2019 - 2032 (US$ Million)
- 11.4.10.6.Japan Market Size and Forecast, By Industry Verticals, 2019 - 2032 (US$ Million)
- 11.4.11.South Korea
- 11.4.11.1.Overview
- 11.4.11.2.Market Analysis, Forecast, and Y-O-Y Growth Rate, 2019 - 2032, (US$ Million)
- 11.4.11.3.South Korea Market Size and Forecast, By Cable Type, 2019 - 2032 (US$ Million)
- 11.4.11.4.South Korea Market Size and Forecast, By Material, 2019 - 2032 (US$ Million)
- 11.4.11.5.South Korea Market Size and Forecast, By Application, 2019 - 2032 (US$ Million)
- 11.4.11.6.South Korea Market Size and Forecast, By Industry Verticals, 2019 - 2032 (US$ Million)
- 11.4.12.Australia
- 11.4.12.1.Overview
- 11.4.12.2.Market Analysis, Forecast, and Y-O-Y Growth Rate, 2019 - 2032, (US$ Million)
- 11.4.12.3.Australia Market Size and Forecast, By Cable Type, 2019 - 2032 (US$ Million)
- 11.4.12.4.Australia Market Size and Forecast, By Material, 2019 - 2032 (US$ Million)
- 11.4.12.5.Australia Market Size and Forecast, By Application, 2019 - 2032 (US$ Million)
- 11.4.12.6.Australia Market Size and Forecast, By Industry Verticals, 2019 - 2032 (US$ Million)
- 11.4.13.Thailand
- 11.4.13.1.Overview
- 11.4.13.2.Market Analysis, Forecast, and Y-O-Y Growth Rate, 2019 - 2032, (US$ Million)
- 11.4.13.3.Thailand Market Size and Forecast, By Cable Type, 2019 - 2032 (US$ Million)
- 11.4.13.4.Thailand Market Size and Forecast, By Material, 2019 - 2032 (US$ Million)
- 11.4.13.5.Thailand Market Size and Forecast, By Application, 2019 - 2032 (US$ Million)
- 11.4.13.6.Thailand Market Size and Forecast, By Industry Verticals, 2019 - 2032 (US$ Million)
- 11.4.14.Indonesia
- 11.4.14.1.Overview
- 11.4.14.2.Market Analysis, Forecast, and Y-O-Y Growth Rate, 2019 - 2032, (US$ Million)
- 11.4.14.3.Indonesia Market Size and Forecast, By Cable Type, 2019 - 2032 (US$ Million)
- 11.4.14.4.Indonesia Market Size and Forecast, By Material, 2019 - 2032 (US$ Million)
- 11.4.14.5.Indonesia Market Size and Forecast, By Application, 2019 - 2032 (US$ Million)
- 11.4.14.6.Indonesia Market Size and Forecast, By Industry Verticals, 2019 - 2032 (US$ Million)
- 11.4.15.Philippines
- 11.4.15.1.Overview
- 11.4.15.2.Market Analysis, Forecast, and Y-O-Y Growth Rate, 2019 - 2032, (US$ Million)
- 11.4.15.3.Philippines Market Size and Forecast, By Cable Type, 2019 - 2032 (US$ Million)
- 11.4.15.4.Philippines Market Size and Forecast, By Material, 2019 - 2032 (US$ Million)
- 11.4.15.5.Philippines Market Size and Forecast, By Application, 2019 - 2032 (US$ Million)
- 11.4.15.6.Philippines Market Size and Forecast, By Industry Verticals, 2019 - 2032 (US$ Million)
- 11.4.16.Rest of APAC
- 11.4.16.1.Overview
- 11.4.16.2.Market Analysis, Forecast, and Y-O-Y Growth Rate, 2019 - 2032, (US$ Million)
- 11.4.16.3.Rest of APAC Market Size and Forecast, By Cable Type, 2019 - 2032 (US$ Million)
- 11.4.16.4.Rest of APAC Market Size and Forecast, By Material, 2019 - 2032 (US$ Million)
- 11.4.16.5.Rest of APAC Market Size and Forecast, By Application, 2019 - 2032 (US$ Million)
- 11.4.16.6.Rest of APAC Market Size and Forecast, By Industry Verticals, 2019 - 2032 (US$ Million)
- 11.5.Latin America
- 11.5.1.Overview
- 11.5.2.Plastic Optic Fiber Key Manufacturers in Latin America
- 11.5.3.Latin America Market Size and Forecast, By Country, 2019 - 2032 (US$ Million)
- 11.5.4.Latin America Market Size and Forecast, By Cable Type, 2019 - 2032 (US$ Million)
- 11.5.5.Latin America Market Size and Forecast, By Material, 2019 - 2032 (US$ Million)
- 11.5.6.Latin America Market Size and Forecast, By Application, 2019 - 2032 (US$ Million)
- 11.5.7.Latin America Market Size and Forecast, By Industry Verticals, 2019 - 2032 (US$ Million)
- 11.5.8.Brazil
- 11.5.8.1.Overview
- 11.5.8.2.Market Analysis, Forecast, and Y-O-Y Growth Rate, 2019 - 2032, (US$ Million)
- 11.5.8.3.Brazil Market Size and Forecast, By Cable Type, 2019 - 2032 (US$ Million)
- 11.5.8.4.Brazil Market Size and Forecast, By Material, 2019 - 2032 (US$ Million)
- 11.5.8.5.Brazil Market Size and Forecast, By Application, 2019 - 2032 (US$ Million)
- 11.5.8.6.Brazil Market Size and Forecast, By Industry Verticals, 2019 - 2032 (US$ Million)
- 11.5.9.Mexico
- 11.5.9.1.Overview
- 11.5.9.2.Market Analysis, Forecast, and Y-O-Y Growth Rate, 2019 - 2032, (US$ Million)
- 11.5.9.3.Mexico Market Size and Forecast, By Cable Type, 2019 - 2032 (US$ Million)
- 11.5.9.4.Mexico Market Size and Forecast, By Material, 2019 - 2032 (US$ Million)
- 11.5.9.5.Mexico Market Size and Forecast, By Application, 2019 - 2032 (US$ Million)
- 11.5.9.6.Mexico Market Size and Forecast, By Industry Verticals, 2019 - 2032 (US$ Million)
- 11.5.10.Argentina
- 11.5.10.1.Overview
- 11.5.10.2.Market Analysis, Forecast, and Y-O-Y Growth Rate, 2019 - 2032, (US$ Million)
- 11.5.10.3.Argentina Market Size and Forecast, By Cable Type, 2019 - 2032 (US$ Million)
- 11.5.10.4.Argentina Market Size and Forecast, By Material, 2019 - 2032 (US$ Million)
- 11.5.10.5.Argentina Market Size and Forecast, By Application, 2019 - 2032 (US$ Million)
- 11.5.10.6.Argentina Market Size and Forecast, By Industry Verticals, 2019 - 2032 (US$ Million)
- 11.5.11.Colombia
- 11.5.11.1.Overview
- 11.5.11.2.Market Analysis, Forecast, and Y-O-Y Growth Rate, 2019 - 2032, (US$ Million)
- 11.5.11.3.Colombia Market Size and Forecast, By Cable Type, 2019 - 2032 (US$ Million)
- 11.5.11.4.Colombia Market Size and Forecast, By Material, 2019 - 2032 (US$ Million)
- 11.5.11.5.Colombia Market Size and Forecast, By Application, 2019 - 2032 (US$ Million)
- 11.5.11.6.Colombia Market Size and Forecast, By Industry Verticals, 2019 - 2032 (US$ Million)
- 11.5.12.Rest of LATAM
- 11.5.12.1.Overview
- 11.5.12.2.Market Analysis, Forecast, and Y-O-Y Growth Rate, 2019 - 2032, (US$ Million)
- 11.5.12.3.Rest of LATAM Market Size and Forecast, By Cable Type, 2019 - 2032 (US$ Million)
- 11.5.12.4.Rest of LATAM Market Size and Forecast, By Material, 2019 - 2032 (US$ Million)
- 11.5.12.5.Rest of LATAM Market Size and Forecast, By Application, 2019 - 2032 (US$ Million)
- 11.5.12.6.Rest of LATAM Market Size and Forecast, By Industry Verticals, 2019 - 2032 (US$ Million)
- 11.6.Middle East and Africa
- 11.6.1.Overview
- 11.6.2.Plastic Optic Fiber Key Manufacturers in Middle East and Africa
- 11.6.3.Middle East and Africa Market Size and Forecast, By Country, 2019 - 2032 (US$ Million)
- 11.6.4.Middle East and Africa Market Size and Forecast, By Cable Type, 2019 - 2032 (US$ Million)
- 11.6.5.Middle East and Africa Market Size and Forecast, By Material, 2019 - 2032 (US$ Million)
- 11.6.6.Middle East and Africa Market Size and Forecast, By Application, 2019 - 2032 (US$ Million)
- 11.6.7.Middle East and Africa Market Size and Forecast, By Industry Verticals, 2019 - 2032 (US$ Million)
- 11.6.8.Saudi Arabia
- 11.6.8.1.Overview
- 11.6.8.2.Market Analysis, Forecast, and Y-O-Y Growth Rate, 2019 - 2032, (US$ Million)
- 11.6.8.3.Saudi Arabia Market Size and Forecast, By Cable Type, 2019 - 2032 (US$ Million)
- 11.6.8.4.Saudi Arabia Market Size and Forecast, By Material, 2019 - 2032 (US$ Million)
- 11.6.8.5.Saudi Arabia Market Size and Forecast, By Application, 2019 - 2032 (US$ Million)
- 11.6.8.6.Saudi Arabia Market Size and Forecast, By Industry Verticals, 2019 - 2032 (US$ Million)
- 11.6.9.United Arab Emirates
- 11.6.9.1.Overview
- 11.6.9.2.Market Analysis, Forecast, and Y-O-Y Growth Rate, 2019 - 2032, (US$ Million)
- 11.6.9.3.United Arab Emirates Market Size and Forecast, By Cable Type, 2019 - 2032 (US$ Million)
- 11.6.9.4.United Arab Emirates Market Size and Forecast, By Material, 2019 - 2032 (US$ Million)
- 11.6.9.5.United Arab Emirates Market Size and Forecast, By Application, 2019 - 2032 (US$ Million)
- 11.6.9.6.United Arab Emirates Market Size and Forecast, By Industry Verticals, 2019 - 2032 (US$ Million)
- 11.6.10.Israel
- 11.6.10.1.Overview
- 11.6.10.2.Market Analysis, Forecast, and Y-O-Y Growth Rate, 2019 - 2032, (US$ Million)
- 11.6.10.3.Israel Market Size and Forecast, By Cable Type, 2019 - 2032 (US$ Million)
- 11.6.10.4.Israel Market Size and Forecast, By Material, 2019 - 2032 (US$ Million)
- 11.6.10.5.Israel Market Size and Forecast, By Application, 2019 - 2032 (US$ Million)
- 11.6.10.6.Israel Market Size and Forecast, By Industry Verticals, 2019 - 2032 (US$ Million)
- 11.6.11.Turkey
- 11.6.11.1.Overview
- 11.6.11.2.Market Analysis, Forecast, and Y-O-Y Growth Rate, 2019 - 2032, (US$ Million)
- 11.6.11.3.Turkey Market Size and Forecast, By Cable Type, 2019 - 2032 (US$ Million)
- 11.6.11.4.Turkey Market Size and Forecast, By Material, 2019 - 2032 (US$ Million)
- 11.6.11.5.Turkey Market Size and Forecast, By Application, 2019 - 2032 (US$ Million)
- 11.6.11.6.Turkey Market Size and Forecast, By Industry Verticals, 2019 - 2032 (US$ Million)
- 11.6.12.Algeria
- 11.6.12.1.Overview
- 11.6.12.2.Market Analysis, Forecast, and Y-O-Y Growth Rate, 2019 - 2032, (US$ Million)
- 11.6.12.3.Algeria Market Size and Forecast, By Cable Type, 2019 - 2032 (US$ Million)
- 11.6.12.4.Algeria Market Size and Forecast, By Material, 2019 - 2032 (US$ Million)
- 11.6.12.5.Algeria Market Size and Forecast, By Application, 2019 - 2032 (US$ Million)
- 11.6.12.6.Algeria Market Size and Forecast, By Industry Verticals, 2019 - 2032 (US$ Million)
- 11.6.13.Egypt
- 11.6.13.1.Overview
- 11.6.13.2.Market Analysis, Forecast, and Y-O-Y Growth Rate, 2019 - 2032, (US$ Million)
- 11.6.13.3.Egypt Market Size and Forecast, By Cable Type, 2019 - 2032 (US$ Million)
- 11.6.13.4.Egypt Market Size and Forecast, By Material, 2019 - 2032 (US$ Million)
- 11.6.13.5.Egypt Market Size and Forecast, By Application, 2019 - 2032 (US$ Million)
- 11.6.13.6.Egypt Market Size and Forecast, By Industry Verticals, 2019 - 2032 (US$ Million)
- 11.6.14.Rest of MEA
- 11.6.14.1.Overview
- 11.6.14.2.Market Analysis, Forecast, and Y-O-Y Growth Rate, 2019 - 2032, (US$ Million)
- 11.6.14.3.Rest of MEA Market Size and Forecast, By Cable Type, 2019 - 2032 (US$ Million)
- 11.6.14.4.Rest of MEA Market Size and Forecast, By Material, 2019 - 2032 (US$ Million)
- 11.6.14.5.Rest of MEA Market Size and Forecast, By Application, 2019 - 2032 (US$ Million)
- 11.6.14.6.Rest of MEA Market Size and Forecast, By Industry Verticals, 2019 - 2032 (US$ Million)
12.Key Vendor Analysis- Plastic Optic Fiber Industry
- 12.1.Competitive Dashboard
- 12.2.Company Profiles
- 12.2.1.AFL
- 12.2.2.Birla Furukawa Fiber Optics Limited
- 12.2.3.Corning Incorporated
- 12.2.4.Finolex Cables Limited
- 12.2.5.Molex, LLC
- 12.2.6.OFS Fitel, LLC
- 12.2.7.Optical Cable Corporation (OCC)
- 12.2.8.Prysmian Group
- 12.2.9.Sterlite Technologies Limited
- 12.2.10.Yangtze Optical Fiber and Cable Joint Stock Limited Company (YOFC)
- 12.2.11.Others
13.360 Degree Analyst View
14.Appendix
- 14.1.Research Methodology
- 14.2.References
- 14.3.Abbreviations
- 14.4.Disclaimer
- 14.5.Contact Us

