|
|
市場調査レポート
商品コード
1485802
単細胞タンパク質市場:供給源別、用途別、原料別、国別、地域別-産業分析、市場規模、市場シェア、2024-2032年の予測Single Cell Protein Market, By Source, By Application, By Feedstock, By Country, and By Region - Industry Analysis, Market Size, Market Share & Forecast from 2024-2032 |
||||||
|
|||||||
カスタマイズ可能
|
|||||||

| 単細胞タンパク質市場:供給源別、用途別、原料別、国別、地域別-産業分析、市場規模、市場シェア、2024-2032年の予測 |
|
出版日: 2024年04月13日
発行: AnalystView Market Insights
ページ情報: 英文 287 Pages
納期: 2~3営業日
|

全表示
- 概要
- 図表
- 目次
レポートハイライト
単細胞タンパク質市場規模は2023年に165億6,747万米ドルとなり、2024年から2032年にかけてCAGR 19.5%で拡大
単細胞タンパク質市場-市場力学
O畜産と繁殖におけるタンパク質消費の増加
畜産と繁殖における単細胞タンパク質(SCP)の消費量の増加は、持続可能で効率的なタンパク質源に対する動向の高まりを反映しています。2022年10月、国立医学図書館(NIH)は、食品廃棄物や農産物製品別を加工チェーンに再び組み込む戦略として単細胞タンパク質の生産が利用され、循環経済に役立つと発表しました。また、国連食糧農業機関によると、単細胞生物から作られたタンパク質は、水産飼料用に大量に生産されています。また、アジア、欧州、北米の水産飼料メーカーがこの分野をリードしています。従って、畜産と繁殖における単細胞タンパク質の消費の増加は、環境への影響を最小限に抑え、食料安全保障を確保しながら、畜産物に対する世界の需要の増加を満たすための持続可能で効率的なソリューションに対するニーズの高まりと一致しています。
単細胞タンパク質市場-主要インサイト
リサーチアナリストの分析によると、世界市場は予測期間(2024-2032年)に約19.5%のCAGRで毎年成長すると予測されています。
供給源セグメンテーションに基づくと、藻類が2023年に最大市場シェアを示すと予測されます。
用途別では、動物飼料が2023年の主要タイプです。
地域別では、北米が2023年の売上高をリードしています。
単細胞タンパク質市場-セグメンテーション分析:
世界の単細胞タンパク質市場は、供給源、用途、原料、地域に基づいてセグメント化されます。
市場は供給源に基づいて4つのカテゴリーに分けられる:大腸菌や枯草菌のような細菌は、その急速な増殖速度とよく理解された遺伝学のためにしばしば使用され、サッカロマイセス・セレビシエのような酵母種も、様々な基質を効率的にタンパク質に変換する能力のために人気があります。
市場は用途によって2つのカテゴリーに分けられる:SCPは、魚介類の養殖用飼料のタンパク質源として使用できます。SCPは、魚介類の成長、繁殖、健康全般に必要な必須アミノ酸と栄養素を供給します。家禽類のタンパク質要求量を満たし、最適な成長と卵の生産をサポートします。
単細胞タンパク質市場-地理的洞察
地理的には、この市場は北米、ラテンアメリカ、欧州、アジア太平洋、中東・アフリカの地域に広がっています。これらの地域は、ビジネスをもたらす国によってさらに分けられます。
北米では、最先端の技術研究所が利用可能で、栄養補助食品会社が代替タンパク質源を特定するために多額の投資を行った結果、単細胞タンパク質製造会社の設立と運営が3%増加しています。栄養補助食品や食品に含まれる高タンパク質に対する消費者のニーズが高まった結果、単細胞タンパク質をベースにした補助食品市場は2.6%増加しました。さらに、アジア太平洋地域では、多くの単細胞タンパク質研究所が存在し、主要なメディアキャンペーンによって認知度が高まったため、単細胞タンパク質をベースとした健康補助食品の消費量が6%増加しています。水産養殖分野では、食品としての単細胞タンパク質に対する需要の高まりが売上増につながっています。
単細胞タンパク質市場-競合情勢:
単細胞タンパク質(SCP)市場には通常、既存企業から新興企業まで様々な企業が存在し、それぞれが異なる製品や技術を提供しています。エボニックはスペシャリティケミカルのリーディングカンパニーで、動物栄養事業部門でSCP製品を提供しています。同社は主に動物飼料用途のSCPを生産しています。また、Calysta社は、メタンを原料として、SCPを含む持続可能なタンパク質製品を開発するバイオテクノロジー企業です。同社は、動物栄養学と水産養殖への応用に注力しています。さらに、新製品開発のために研究開発費を増加させている企業は、製品需要を促進すると思われます。同様に、世界の単細胞タンパク質製品の最新動向の取り込みは、単細胞タンパク質の需要を押し上げるのに役立ちます。
目次
第1章 単細胞タンパク質市場概要
- 調査範囲
- 市場推定年
第2章 エグゼクティブサマリー
- 市場内訳
- 競合考察
第3章 単細胞タンパク質の主要市場動向
- 市場促進要因
- 市場抑制要因
- 市場機会
- 市場の将来動向
第4章 単細胞タンパク質産業研究
- PEST分析
- ポーターのファイブフォース分析
- 成長見通しマッピング
- 規制枠組み分析
第5章 単細胞タンパク質市場: COVID-19の影響分析
- COVID-19以前の影響分析
- COVID-19後の影響分析
第6章 単細胞タンパク質市場情勢
- 単細胞タンパク質市場シェア分析、2023年
- 主要メーカー別内訳データ
- 既存企業の分析
- 新興企業の分析
第7章 単細胞タンパク質市場- 供給源別
- 概要
- 供給源別セグメントシェア分析
- 細菌
- 酵母
- 藻類
- クロレラ
- スピルリナ
- ヘマトコッカス
- その他
- 菌類
第8章 単細胞タンパク質市場- 用途別
- 概要
- 用途別セグメントシェア分析
- 食品・飲料
- 肉の類似品
- ベーカリー
- 乳製品の代替品
- 飲料
- 動物飼料
- 家禽
- 豚
- 牛
- その他
- 栄養補助食品
- その他
第9章 単細胞タンパク質市場- 原料別
- 概要
- 原料別セグメントシェア分析
- オーガニック
- 従来型
第10章 単細胞タンパク質市場-地域別
- イントロダクション
- 北米
- 概要
- 北米の主要メーカー
- 米国
- カナダ
- 欧州
- 概要
- 欧州の主要メーカー
- ドイツ
- イタリア
- 英国
- フランス
- ロシア
- オランダ
- スウェーデン
- ポーランド
- その他
- アジア太平洋(APAC)
- 概要
- アジア太平洋地域の主要メーカー
- インド
- 中国
- 日本
- 韓国
- オーストラリア
- タイ
- インドネシア
- フィリピン
- その他
- ラテンアメリカ
- 概要
- ラテンアメリカの主要メーカー
- ブラジル
- メキシコ
- アルゼンチン
- コロンビア
- その他
- 中東およびアフリカ
- 概要
- 中東・アフリカの主要メーカー
- サウジアラビア
- アラブ首長国連邦
- イスラエル
- トルコ
- アルジェリア
- エジプト
- その他
第11章 主要ベンダー分析- 単細胞タンパク質業界
- 競合ダッシュボード
- 企業プロファイル
- EVONIK Industries AG
- NOVUS International
- Unibio A/S
- Calysta Inc.
- Alltech Inc.
- Nutrinsic
- Blue Bio Tech International GmbH
- Parry Nutraceuticals
- Lallemand Inc.
- BIOMIN Holding GmbH
- Devenish Nutrition, LLC
- Unilever
- Vega Pharma Ltd.
- CBH Qingdao Co. Ltd.
- Cyanotech Corp.
- Others
第12章 アナリストの全方位展望
List of Tables
- TABLE List of data sources
- TABLE Market drivers; Impact Analysis
- TABLE Market restraints; Impact Analysis
- TABLE Single Cell Protein Market: Source Snapshot (2023)
- TABLE Segment Dashboard; Definition and Scope, by Source
- TABLE Global Single Cell Protein Market, by Source 2019-2032 (USD Million)
- TABLE Single Cell Protein Market: Application Snapshot (2023)
- TABLE Segment Dashboard; Definition and Scope, by Application
- TABLE Global Single Cell Protein Market, by Application 2019-2032 (USD Million)
- TABLE Single Cell Protein Market: Feedstock Snapshot (2023)
- TABLE Segment Dashboard; Definition and Scope, by Feedstock
- TABLE Global Single Cell Protein Market, by Feedstock 2019-2032 (USD Million)
- TABLE Single Cell Protein Market: Regional snapshot (2023)
- TABLE Segment Dashboard; Definition and Scope, by Region
- TABLE Global Single Cell Protein Market, by Region 2019-2032 (USD Million)
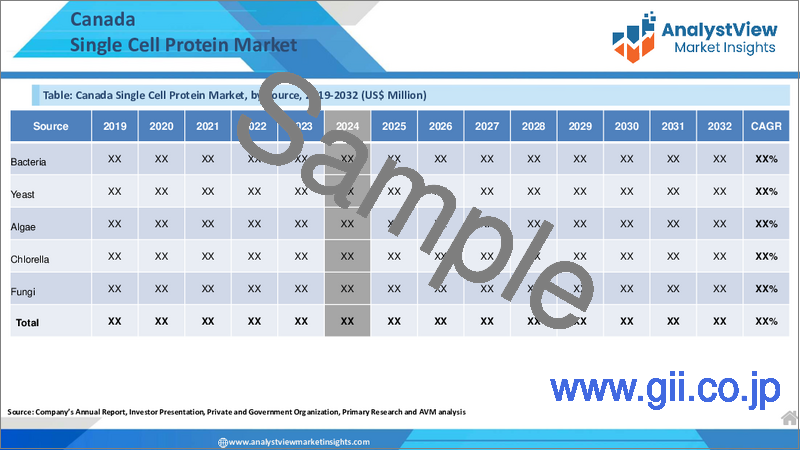
- TABLE North America Single Cell Protein Market, by Country, 2019-2032 (USD Million)
- TABLE North America Single Cell Protein Market, by Source, 2019-2032 (USD Million)
- TABLE North America Single Cell Protein Market, by Application, 2019-2032 (USD Million)
- TABLE North America Single Cell Protein Market, by Feedstock, 2019-2032 (USD Million)
- TABLE Europe Single Cell Protein Market, by Country, 2019-2032 (USD Million)
- TABLE Europe Single Cell Protein Market, by Source, 2019-2032 (USD Million)
- TABLE Europe Single Cell Protein Market, by Application, 2019-2032 (USD Million)
- TABLE Europe Single Cell Protein Market, by Feedstock, 2019-2032 (USD Million)
- TABLE Asia Pacific Single Cell Protein Market, by Country, 2019-2032 (USD Million)
- TABLE Asia Pacific Single Cell Protein Market, by Source, 2019-2032 (USD Million)
- TABLE Asia Pacific Single Cell Protein Market, by Application, 2019-2032 (USD Million)
- TABLE Asia Pacific Single Cell Protein Market, by Feedstock, 2019-2032 (USD Million)
- TABLE Latin America Single Cell Protein Market, by Country, 2019-2032 (USD Million)
- TABLE Latin America Single Cell Protein Market, by Source, 2019-2032 (USD Million)
- TABLE Latin America Single Cell Protein Market, by Application, 2019-2032 (USD Million)
- TABLE Latin America Single Cell Protein Market, by Feedstock, 2019-2032 (USD Million)
- TABLE Middle East and Africa Single Cell Protein Market, by Country, 2019-2032 (USD Million)
- TABLE Middle East and Africa Single Cell Protein Market, by Source, 2019-2032 (USD Million)
- TABLE Middle East and Africa Single Cell Protein Market, by Application, 2019-2032 (USD Million)
- TABLE Middle East and Africa Single Cell Protein Market, by Feedstock, 2019-2032 (USD Million)
REPORT HIGHLIGHT
Single Cell Protein Market size was valued at USD 16,567.47 Million in 2023, expanding at a CAGR of 19.5% from 2024 to 2032.
Single Cell Protein (SCP) refers to protein obtained from single-celled microorganisms like bacteria, yeast, fungi, and algae. These microorganisms can be cultivated on various substrates like agricultural waste, industrial by-products, or even specially designed media. With the world population continually rising, there's a growing demand for sustainable protein sources to meet dietary needs. However, consumer perception and acceptance of SCP as a food or feed ingredient may pose challenges due to concerns about taste, safety, and ethics. Furthermore, SCP can be used as a protein ingredient in various food products, including snacks, beverages, and meat substitutes, presenting opportunities for market expansion.
Single Cell Protein Market- Market Dynamics
O Increasing consumption of protein in animal farming & breeding
The rising consumption of single-cell protein (SCP) in animal farming and breeding reflects a growing trend towards sustainable and efficient protein sources. In October 2022, the National Medicine Library (NIH) announced that Single-Cell Protein production will be used as a strategy to reincorporate food waste and agro by-products back into the processing chain, which will help in the circular economy. In addition, according to the Food & Agriculture Organization of the United Nations, proteins made from single-cell organisms are being produced in growing quantities for aquafeeds. Also, there are aquafeed producers in Asia, Europe and North America leading this field. Therefore, the increasing consumption of single-cell protein in animal farming and breeding aligns with the growing need for sustainable and efficient solutions to meet the rising global demand for animal products while minimizing environmental impact and ensuring food security.
Single Cell Protein Market- Key Insights
v As per the analysis shared by our research analyst, the global market is estimated to grow annually at a CAGR of around 19.5% over the forecast period (2024-2032)
v Based on source segmentation, algae was predicted to show maximum market share in the year 2023
v Based on application segmentation, animal feed was the leading type in 2023
v Based on region, North America was the leading revenue generator in 2023
Single Cell Protein Market- Segmentation Analysis:
The Global Single Cell Protein Market is segmented based on Source, Application, Feedstock, and Region.
The market is divided into four categories based on source: Bacteria like Escherichia coli and Bacillus subtilis are often used due to their rapid growth rates and well-understood genetics, while yeast species such as Saccharomyces cerevisiae are also popular because of their ability to efficiently convert various substrates into protein.
The market is divided into two categories based on application: SCP can be used as a protein source in aquaculture feeds for fish and shellfish. It provides essential amino acids and nutrients necessary for growth, reproduction, and overall health in aquatic species. It helps in meeting the protein requirements of poultry birds and supports optimal growth and egg production.
Single Cell Protein Market- Geographical Insights
Geographically, this market is widespread in the regions of North America, Latin America, Europe, Asia Pacific, and the Middle East and Africa. These regions are further divided as per the nations bringing business.
There has been a 3% rise in the establishment and operation of single-cell protein manufacturing companies in North America as a result of the availability of cutting-edge technological labs and significant investments made by nutraceutical companies to identify alternative protein sources. The market for supplemental food items based on single cell protein has increased by 2.6% as a result of consumers' growing need for high protein content in dietary supplements and food products. Additionally, the Asia-Pacific area has seen a 6% rise in the consumption of single cell protein-based health supplements due to the existence of numerous single cell protein labs and awareness raised by major media campaigns. In the aquaculture sector, a rise in the demand for single-cell protein as food has translated into higher sales.
Single Cell Protein Market- Competitive Landscape:
The Single Cell Protein (SCP) market typically includes a variety of players ranging from established companies to startups, each offering different products or technologies. Evonik is a leading specialty chemicals company that offers SCP products under its animal nutrition business segment. The company produces SCP primarily for animal feed applications. Also, Calysta is a biotechnology company that develops sustainable protein products, including SCP, using methane as a feedstock. They focus on applications in animal nutrition and aquaculture. Furthermore, players increasing R&D spending for the development of new products will propel product demand. Similarly, the incorporation of the latest trends in global Single Cell Protein Products helps to boost the demand for single cell proteins.
Recent Developments:
v In December 2023, Biotech startup MicroHarvest launched in Lisbon a cutting-edge pilot plant that will enable the company to accelerate the path to commercialization of its single-cell protein ingredients.
v In November 2023, The Dutch-Swiss ingredients supplier developed single-cell proteins claiming that have the potential to offer 'net zero carbon protein' for the food, feed, and pet food markets.
SCOPE OF THE REPORT
The scope of this report covers the market by its major segments, which include as follows:
GLOBAL SINGLE CELL PROTEIN MARKET KEY PLAYERS- DETAILED COMPETITIVE INSIGHTS
O EVONIK Industries AG
O NOVUS International
O Unibio A/S
O Calysta Inc.
O Alltech Inc.
O Nutrinsic
O Blue Bio Tech International GmbH
O Parry Nutraceuticals
O Lallemand Inc.
O BIOMIN Holding GmbH
O Devenish Nutrition, LLC
O Unilever
O Vega Pharma Ltd.
O CBH Qingdao Co. Ltd.
O Cyanotech Corp.
O Others
GLOBAL SINGLE CELL PROTEIN MARKET, BY SOURCE - MARKET ANALYSIS, 2019 - 2032
- O Bacteria
- O Yeast
- O Algae
- Chlorella
- Spirulina
- Haematococcus
- Others
- O Fungi
GLOBAL SINGLE CELL PROTEIN MARKET, BY APPLICATION- MARKET ANALYSIS, 2019 - 2032
- O Food & Beverages
- Meat Analogs
- Bakery
- Dairy Alternatives
- Beverages
- O Animal Feed
- Poultry
- Swine
- Cattle
- Others
- O Dietary Supplements
- O Others
GLOBAL SINGLE CELL PROTEIN MARKET, BY FEEDSTOCK - MARKET ANALYSIS, 2019 - 2032
- O Organic
- O Conventional
GLOBAL SINGLE CELL PROTEIN MARKET, BY REGION- MARKET ANALYSIS, 2019 - 2032
- O North America
- The U.S.
- Canada
- O Europe
- Germany
- France
- Italy
- Spain
- United Kingdom
- Russia
- Netherlands
- Sweden
- Poland
- Rest of Europe
- O Asia Pacific
- India
- China
- South Korea
- Japan
- Australia
- Thailand
- Indonesia
- Philippines
- Rest of APAC
- O Latin America
- Brazil
- Mexico
- Argentina
- Colombia
- Rest of LATAM
- O The Middle East and Africa
- Saudi Arabia
- United Arab Emirates
- Israel
- Turkey
- Algeria
- Egypt
- Rest of MEA
Table of Contents
1.Single Cell Protein Market Overview
- 1.1.Study Scope
- 1.2.Market Estimation Years
2.Executive Summary
- 2.1.Market Snippet
- 2.1.1.Single Cell Protein Market Snippet by Source
- 2.1.2.Single Cell Protein Market Snippet by Application
- 2.1.3.Single Cell Protein Market Snippet by Feedstock
- 2.1.4.Single Cell Protein Market Snippet by Country
- 2.1.5.Single Cell Protein Market Snippet by Region
- 2.2.Competitive Insights
3.Single Cell Protein Key Market Trends
- 3.1.Single Cell Protein Market Drivers
- 3.1.1.Impact Analysis of Market Drivers
- 3.2.Single Cell Protein Market Restraints
- 3.2.1.Impact Analysis of Market Restraints
- 3.3.Single Cell Protein Market Opportunities
- 3.4.Single Cell Protein Market Future Trends
4.Single Cell Protein Industry Study
- 4.1.PEST Analysis
- 4.2.Porter's Five Forces Analysis
- 4.3.Growth Prospect Mapping
- 4.4.Regulatory Framework Analysis
5.Single Cell Protein Market: COVID-19 Impact Analysis
- 5.1.Pre-COVID-19 Impact Analysis
- 5.2.Post-COVID-19 Impact Analysis
- 5.2.1.Top Performing Segments
- 5.2.2.Marginal Growth Segments
- 5.2.3.Top Looser Segments
- 5.2.4.Marginal Loss Segments
6.Single Cell Protein Market Landscape
- 6.1.Single Cell Protein Market Share Analysis, 2023
- 6.2.Breakdown Data, by Key Manufacturer
- 6.2.1.Established Players' Analysis
- 6.2.2.Emerging Players' Analysis
7.Single Cell Protein Market - By Source
- 7.1.Overview
- 7.1.1.Segment Share Analysis, By Source, 2023 & 2032 (%)
- 7.1.2.Bacteria
- 7.1.3.Yeast
- 7.1.4.Algae
- 7.1.4.1.Chlorella
- 7.1.4.2.Spirulina
- 7.1.4.3.Haematococcus
- 7.1.4.4.Others
- 7.1.5.Fungi
8.Single Cell Protein Market - By Application
- 8.1.Overview
- 8.1.1.Segment Share Analysis, By Application, 2023 & 2032 (%)
- 8.1.2.Food & Beverages
- 8.1.2.1.Meat Analogs
- 8.1.2.2.Bakery
- 8.1.2.3.Dairy Alternatives
- 8.1.2.4.Beverages
- 8.1.3.Animal Feed
- 8.1.3.1.Poultry
- 8.1.3.2.Swine
- 8.1.3.3.Cattle
- 8.1.3.4.Others
- 8.1.4.Dietary Supplements
- 8.1.5.Others
9.Single Cell Protein Market - By Feedstock
- 9.1.Overview
- 9.1.1.Segment Share Analysis, By Feedstock, 2023 & 2032 (%)
- 9.1.2.Organic
- 9.1.3.Conventional
10.Single Cell Protein Market- By Geography
- 10.1.Introduction
- 10.1.1.Segment Share Analysis, By Geography, 2023 & 2032 (%)
- 10.2.North America
- 10.2.1.Overview
- 10.2.2.Single Cell Protein Key Manufacturers in North America
- 10.2.3.North America Market Size and Forecast, By Country, 2019 - 2032 (US$ Million)
- 10.2.4.North America Market Size and Forecast, By Source, 2019 - 2032 (US$ Million)
- 10.2.5.North America Market Size and Forecast, By Application, 2019 - 2032 (US$ Million)
- 10.2.6.North America Market Size and Forecast, By Feedstock, 2019 - 2032 (US$ Million)
- 10.2.7.U.S.
- 10.2.7.1.Overview
- 10.2.7.2.Market Analysis, Forecast, and Y-O-Y Growth Rate, 2019 - 2032, (US$ Million)
- 10.2.7.3.U.S. Market Size and Forecast, By Source, 2019 - 2032 (US$ Million)
- 10.2.7.4.U.S. Market Size and Forecast, By Application, 2019 - 2032 (US$ Million)
- 10.2.7.5.U.S. Market Size and Forecast, By Feedstock, 2019 - 2032 (US$ Million)
- 10.2.8.Canada
- 10.2.8.1.Overview
- 10.2.8.2.Market Analysis, Forecast, and Y-O-Y Growth Rate, 2019 - 2032, (US$ Million)
- 10.2.8.3.Canada Market Size and Forecast, By Source, 2019 - 2032 (US$ Million)
- 10.2.8.4.Canada Market Size and Forecast, By Application, 2019 - 2032 (US$ Million)
- 10.2.8.5.Canada Market Size and Forecast, By Feedstock, 2019 - 2032 (US$ Million)
- 10.3.Europe
- 10.3.1.Overview
- 10.3.2.Single Cell Protein Key Manufacturers in Europe
- 10.3.3.Europe Market Size and Forecast, By Country, 2019 - 2032 (US$ Million)
- 10.3.4.Europe Market Size and Forecast, By Source, 2019 - 2032 (US$ Million)
- 10.3.5.Europe Market Size and Forecast, By Application, 2019 - 2032 (US$ Million)
- 10.3.6.Europe Market Size and Forecast, By Feedstock, 2019 - 2032 (US$ Million)
- 10.3.7.Germany
- 10.3.7.1.Overview
- 10.3.7.2.Market Analysis, Forecast, and Y-O-Y Growth Rate, 2019 - 2032, (US$ Million)
- 10.3.7.3.Germany Market Size and Forecast, By Source, 2019 - 2032 (US$ Million)
- 10.3.7.4.Germany Market Size and Forecast, By Application, 2019 - 2032 (US$ Million)
- 10.3.7.5.Germany Market Size and Forecast, By Feedstock, 2019 - 2032 (US$ Million)
- 10.3.8.Italy
- 10.3.8.1.Overview
- 10.3.8.2.Market Analysis, Forecast, and Y-O-Y Growth Rate, 2019 - 2032, (US$ Million)
- 10.3.8.3.Italy Market Size and Forecast, By Source, 2019 - 2032 (US$ Million)
- 10.3.8.4.Italy Market Size and Forecast, By Application, 2019 - 2032 (US$ Million)
- 10.3.8.5.Italy Market Size and Forecast, By Feedstock, 2019 - 2032 (US$ Million)
- 10.3.9.United Kingdom
- 10.3.9.1.Overview
- 10.3.9.2.Market Analysis, Forecast, and Y-O-Y Growth Rate, 2019 - 2032, (US$ Million)
- 10.3.9.3.United Kingdom Market Size and Forecast, By Source, 2019 - 2032 (US$ Million)
- 10.3.9.4.United Kingdom Market Size and Forecast, By Application, 2019 - 2032 (US$ Million)
- 10.3.9.5.United Kingdom Market Size and Forecast, By Feedstock, 2019 - 2032 (US$ Million)
- 10.3.10.France
- 10.3.10.1.Overview
- 10.3.10.2.Market Analysis, Forecast, and Y-O-Y Growth Rate, 2019 - 2032, (US$ Million)
- 10.3.10.3.France Market Size and Forecast, By Source, 2019 - 2032 (US$ Million)
- 10.3.10.4.France Market Size and Forecast, By Application, 2019 - 2032 (US$ Million)
- 10.3.10.5.France Market Size and Forecast, By Feedstock, 2019 - 2032 (US$ Million)
- 10.3.11.Russia
- 10.3.11.1.Market Analysis, Forecast, and Y-O-Y Growth Rate, 2019 - 2032, (US$ Million)
- 10.3.11.2.Russia Market Size and Forecast, By Source, 2019 - 2032 (US$ Million)
- 10.3.11.3.Russia Market Size and Forecast, By Application, 2019 - 2032 (US$ Million)
- 10.3.11.4.Russia Market Size and Forecast, By Feedstock, 2019 - 2032 (US$ Million)
- 10.3.12.Netherlands
- 10.3.12.1.Market Analysis, Forecast, and Y-O-Y Growth Rate, 2019 - 2032, (US$ Million)
- 10.3.12.2.Netherlands Market Size and Forecast, By Source, 2019 - 2032 (US$ Million)
- 10.3.12.3.Netherlands Market Size and Forecast, By Application, 2019 - 2032 (US$ Million)
- 10.3.12.4.Netherlands Market Size and Forecast, By Feedstock, 2019 - 2032 (US$ Million)
- 10.3.13.Sweden
- 10.3.13.1.Market Analysis, Forecast, and Y-O-Y Growth Rate, 2019 - 2032, (US$ Million)
- 10.3.13.2.Sweden Market Size and Forecast, By Source, 2019 - 2032 (US$ Million)
- 10.3.13.3.Sweden Market Size and Forecast, By Application, 2019 - 2032 (US$ Million)
- 10.3.13.4.Sweden Market Size and Forecast, By Feedstock, 2019 - 2032 (US$ Million)
- 10.3.14.Poland
- 10.3.14.1.Market Analysis, Forecast, and Y-O-Y Growth Rate, 2019 - 2032, (US$ Million)
- 10.3.14.2.Poland Market Size and Forecast, By Source, 2019 - 2032 (US$ Million)
- 10.3.14.3.Poland Market Size and Forecast, By Application, 2019 - 2032 (US$ Million)
- 10.3.14.4.Poland Market Size and Forecast, By Feedstock, 2019 - 2032 (US$ Million)
- 10.3.15.Rest of Europe
- 10.3.15.1.Overview
- 10.3.15.2.Market Analysis, Forecast, and Y-O-Y Growth Rate, 2019 - 2032, (US$ Million)
- 10.3.15.3.Rest of the Europe Market Size and Forecast, By Source, 2019 - 2032 (US$ Million)
- 10.3.15.4.Rest of the Europe Market Size and Forecast, By Application, 2019 - 2032 (US$ Million)
- 10.3.15.5.Rest of the Europe Market Size and Forecast, By Feedstock, 2019 - 2032 (US$ Million)
- 10.4.Asia Pacific (APAC)
- 10.4.1.Overview
- 10.4.2.Single Cell Protein Key Manufacturers in Asia Pacific
- 10.4.3.Asia Pacific Market Size and Forecast, By Country, 2019 - 2032 (US$ Million)
- 10.4.4.Asia Pacific Market Size and Forecast, By Source, 2019 - 2032 (US$ Million)
- 10.4.5.Asia Pacific Market Size and Forecast, By Application, 2019 - 2032 (US$ Million)
- 10.4.6.Asia Pacific Market Size and Forecast, By Feedstock, 2019 - 2032 (US$ Million)
- 10.4.7.India
- 10.4.7.1.Overview
- 10.4.7.2.Market Analysis, Forecast, and Y-O-Y Growth Rate, 2019 - 2032, (US$ Million)
- 10.4.7.3.India Market Size and Forecast, By Source, 2019 - 2032 (US$ Million)
- 10.4.7.4.India Market Size and Forecast, By Application, 2019 - 2032 (US$ Million)
- 10.4.7.5.India Market Size and Forecast, By Feedstock, 2019 - 2032 (US$ Million)
- 10.4.8.China
- 10.4.8.1.Overview
- 10.4.8.2.Market Analysis, Forecast, and Y-O-Y Growth Rate, 2019 - 2032, (US$ Million)
- 10.4.8.3.China Market Size and Forecast, By Source, 2019 - 2032 (US$ Million)
- 10.4.8.4.China Market Size and Forecast, By Application, 2019 - 2032 (US$ Million)
- 10.4.8.5.China Market Size and Forecast, By Feedstock, 2019 - 2032 (US$ Million)
- 10.4.9.Japan
- 10.4.9.1.Overview
- 10.4.9.2.Market Analysis, Forecast, and Y-O-Y Growth Rate, 2019 - 2032, (US$ Million)
- 10.4.9.3.Japan Market Size and Forecast, By Source, 2019 - 2032 (US$ Million)
- 10.4.9.4.Japan Market Size and Forecast, By Application, 2019 - 2032 (US$ Million)
- 10.4.9.5.Japan Market Size and Forecast, By Feedstock, 2019 - 2032 (US$ Million)
- 10.4.10.South Korea
- 10.4.10.1.Overview
- 10.4.10.2.Market Analysis, Forecast, and Y-O-Y Growth Rate, 2019 - 2032, (US$ Million)
- 10.4.10.3.South Korea Market Size and Forecast, By Source, 2019 - 2032 (US$ Million)
- 10.4.10.4.South Korea Market Size and Forecast, By Application, 2019 - 2032 (US$ Million)
- 10.4.10.5.South Korea Market Size and Forecast, By Feedstock, 2019 - 2032 (US$ Million)
- 10.4.11.Australia
- 10.4.11.1.Overview
- 10.4.11.2.Market Analysis, Forecast, and Y-O-Y Growth Rate, 2019 - 2032, (US$ Million)
- 10.4.11.3.Australia Market Size and Forecast, By Source, 2019 - 2032 (US$ Million)
- 10.4.11.4.Australia Market Size and Forecast, By Application, 2019 - 2032 (US$ Million)
- 10.4.11.5.Australia Market Size and Forecast, By Feedstock, 2019 - 2032 (US$ Million)
- 10.4.12.Thailand
- 10.4.12.1.Overview
- 10.4.12.2.Market Analysis, Forecast, and Y-O-Y Growth Rate, 2019 - 2032, (US$ Million)
- 10.4.12.3.Thailand Market Size and Forecast, By Source, 2019 - 2032 (US$ Million)
- 10.4.12.4.Thailand Market Size and Forecast, By Application, 2019 - 2032 (US$ Million)
- 10.4.12.5.Thailand Market Size and Forecast, By Feedstock, 2019 - 2032 (US$ Million)
- 10.4.13.Indonesia
- 10.4.13.1.Overview
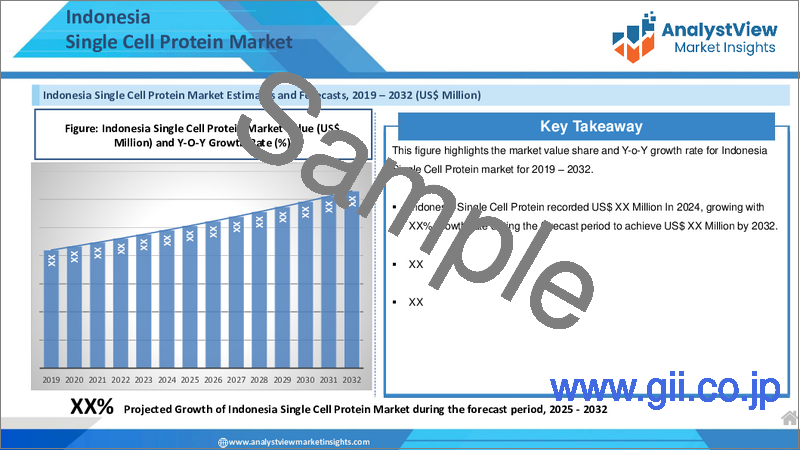
- 10.4.13.2.Market Analysis, Forecast, and Y-O-Y Growth Rate, 2019 - 2032, (US$ Million)
- 10.4.13.3.Indonesia Market Size and Forecast, By Source, 2019 - 2032 (US$ Million)
- 10.4.13.4.Indonesia Market Size and Forecast, By Application, 2019 - 2032 (US$ Million)
- 10.4.13.5.Indonesia Market Size and Forecast, By Feedstock, 2019 - 2032 (US$ Million)
- 10.4.14.Philippines
- 10.4.14.1.Overview
- 10.4.14.2.Market Analysis, Forecast, and Y-O-Y Growth Rate, 2019 - 2032, (US$ Million)
- 10.4.14.3.Philippines Market Size and Forecast, By Source, 2019 - 2032 (US$ Million)
- 10.4.14.4.Philippines Market Size and Forecast, By Application, 2019 - 2032 (US$ Million)
- 10.4.14.5.Philippines Market Size and Forecast, By Feedstock, 2019 - 2032 (US$ Million)
- 10.4.15.Rest of APAC
- 10.4.15.1.Overview
- 10.4.15.2.Market Analysis, Forecast, and Y-O-Y Growth Rate, 2019 - 2032, (US$ Million)
- 10.4.15.3.Rest of APAC Market Size and Forecast, By Source, 2019 - 2032 (US$ Million)
- 10.4.15.4.Rest of APAC Market Size and Forecast, By Application, 2019 - 2032 (US$ Million)
- 10.4.15.5.Rest of APAC Market Size and Forecast, By Feedstock, 2019 - 2032 (US$ Million)
- 10.5.Latin America
- 10.5.1.Overview
- 10.5.2.Single Cell Protein Key Manufacturers in Latin America
- 10.5.3.Latin America Market Size and Forecast, By Country, 2019 - 2032 (US$ Million)
- 10.5.4.Latin America Market Size and Forecast, By Source, 2019 - 2032 (US$ Million)
- 10.5.5.Latin America Market Size and Forecast, By Application, 2019 - 2032 (US$ Million)
- 10.5.6.Latin America Market Size and Forecast, By Feedstock, 2019 - 2032 (US$ Million)
- 10.5.7.Brazil
- 10.5.7.1.Overview
- 10.5.7.2.Market Analysis, Forecast, and Y-O-Y Growth Rate, 2019 - 2032, (US$ Million)
- 10.5.7.3.Brazil Market Size and Forecast, By Source, 2019 - 2032 (US$ Million)
- 10.5.7.4.Brazil Market Size and Forecast, By Application, 2019 - 2032 (US$ Million)
- 10.5.7.5.Brazil Market Size and Forecast, By Feedstock, 2019 - 2032 (US$ Million)
- 10.5.8.Mexico
- 10.5.8.1.Overview
- 10.5.8.2.Market Analysis, Forecast, and Y-O-Y Growth Rate, 2019 - 2032, (US$ Million)
- 10.5.8.3.Mexico Market Size and Forecast, By Source, 2019 - 2032 (US$ Million)
- 10.5.8.4.Mexico Market Size and Forecast, By Application, 2019 - 2032 (US$ Million)
- 10.5.8.5.Mexico Market Size and Forecast, By Feedstock, 2019 - 2032 (US$ Million)
- 10.5.9.Argentina
- 10.5.9.1.Overview
- 10.5.9.2.Market Analysis, Forecast, and Y-O-Y Growth Rate, 2019 - 2032, (US$ Million)
- 10.5.9.3.Argentina Market Size and Forecast, By Source, 2019 - 2032 (US$ Million)
- 10.5.9.4.Argentina Market Size and Forecast, By Application, 2019 - 2032 (US$ Million)
- 10.5.9.5.Argentina Market Size and Forecast, By Feedstock, 2019 - 2032 (US$ Million)
- 10.5.10.Colombia
- 10.5.10.1.Overview
- 10.5.10.2.Market Analysis, Forecast, and Y-O-Y Growth Rate, 2019 - 2032, (US$ Million)
- 10.5.10.3.Colombia Market Size and Forecast, By Source, 2019 - 2032 (US$ Million)
- 10.5.10.4.Colombia Market Size and Forecast, By Application, 2019 - 2032 (US$ Million)
- 10.5.10.5.Colombia Market Size and Forecast, By Feedstock, 2019 - 2032 (US$ Million)
- 10.5.11.Rest of LATAM
- 10.5.11.1.Overview
- 10.5.11.2.Market Analysis, Forecast, and Y-O-Y Growth Rate, 2019 - 2032, (US$ Million)
- 10.5.11.3.Rest of LATAM Market Size and Forecast, By Source, 2019 - 2032 (US$ Million)
- 10.5.11.4.Rest of LATAM Market Size and Forecast, By Application, 2019 - 2032 (US$ Million)
- 10.5.11.5.Rest of LATAM Market Size and Forecast, By Feedstock, 2019 - 2032 (US$ Million)
- 10.6.Middle East and Africa
- 10.6.1.Overview
- 10.6.2.Single Cell Protein Key Manufacturers in Middle East and Africa
- 10.6.3.Middle East and Africa Market Size and Forecast, By Country, 2019 - 2032 (US$ Million)
- 10.6.4.Middle East and Africa Market Size and Forecast, By Source, 2019 - 2032 (US$ Million)
- 10.6.5.Middle East and Africa Market Size and Forecast, By Application, 2019 - 2032 (US$ Million)
- 10.6.6.Middle East and Africa Market Size and Forecast, By Feedstock, 2019 - 2032 (US$ Million)
- 10.6.7.Saudi Arabia
- 10.6.7.1.Overview
- 10.6.7.2.Market Analysis, Forecast, and Y-O-Y Growth Rate, 2019 - 2032, (US$ Million)
- 10.6.7.3.Saudi Arabia Market Size and Forecast, By Source, 2019 - 2032 (US$ Million)
- 10.6.7.4.Saudi Arabia Market Size and Forecast, By Application, 2019 - 2032 (US$ Million)
- 10.6.7.5.Saudi Arabia Market Size and Forecast, By Feedstock, 2019 - 2032 (US$ Million)
- 10.6.8.United Arab Emirates
- 10.6.8.1.Overview
- 10.6.8.2.Market Analysis, Forecast, and Y-O-Y Growth Rate, 2019 - 2032, (US$ Million)
- 10.6.8.3.United Arab Emirates Market Size and Forecast, By Source, 2019 - 2032 (US$ Million)
- 10.6.8.4.United Arab Emirates Market Size and Forecast, By Application, 2019 - 2032 (US$ Million)
- 10.6.8.5.United Arab Emirates Market Size and Forecast, By Feedstock, 2019 - 2032 (US$ Million)
- 10.6.9.Israel
- 10.6.9.1.Overview
- 10.6.9.2.Market Analysis, Forecast, and Y-O-Y Growth Rate, 2019 - 2032, (US$ Million)
- 10.6.9.3.Israel Market Size and Forecast, By Source, 2019 - 2032 (US$ Million)
- 10.6.9.4.Israel Market Size and Forecast, By Application, 2019 - 2032 (US$ Million)
- 10.6.9.5.Israel Market Size and Forecast, By Feedstock, 2019 - 2032 (US$ Million)
- 10.6.10.Turkey
- 10.6.10.1.Overview
- 10.6.10.2.Market Analysis, Forecast, and Y-O-Y Growth Rate, 2019 - 2032, (US$ Million)
- 10.6.10.3.Turkey Market Size and Forecast, By Source, 2019 - 2032 (US$ Million)
- 10.6.10.4.Turkey Market Size and Forecast, By Application, 2019 - 2032 (US$ Million)
- 10.6.10.5.Turkey Market Size and Forecast, By Feedstock, 2019 - 2032 (US$ Million)
- 10.6.11.Algeria
- 10.6.11.1.Overview
- 10.6.11.2.Market Analysis, Forecast, and Y-O-Y Growth Rate, 2019 - 2032, (US$ Million)
- 10.6.11.3.Algeria Market Size and Forecast, By Source, 2019 - 2032 (US$ Million)
- 10.6.11.4.Algeria Market Size and Forecast, By Application, 2019 - 2032 (US$ Million)
- 10.6.11.5.Algeria Market Size and Forecast, By Feedstock, 2019 - 2032 (US$ Million)
- 10.6.12.Egypt
- 10.6.12.1.Overview
- 10.6.12.2.Market Analysis, Forecast, and Y-O-Y Growth Rate, 2019 - 2032, (US$ Million)
- 10.6.12.3.Egypt Market Size and Forecast, By Source, 2019 - 2032 (US$ Million)
- 10.6.12.4.Egypt Market Size and Forecast, By Application, 2019 - 2032 (US$ Million)
- 10.6.12.5.Egypt Market Size and Forecast, By Feedstock, 2019 - 2032 (US$ Million)
- 10.6.13.Rest of MEA
- 10.6.13.1.Overview
- 10.6.13.2.Market Analysis, Forecast, and Y-O-Y Growth Rate, 2019 - 2032, (US$ Million)
- 10.6.13.3.Rest of MEA Market Size and Forecast, By Source, 2019 - 2032 (US$ Million)
- 10.6.13.4.Rest of MEA Market Size and Forecast, By Application, 2019 - 2032 (US$ Million)
- 10.6.13.5.Rest of MEA Market Size and Forecast, By Feedstock, 2019 - 2032 (US$ Million)
11.Key Vendor Analysis- Single Cell Protein Industry
- 11.1.Competitive Dashboard
- 11.2.Company Profiles
- 11.2.1.EVONIK Industries AG
- 11.2.2.NOVUS International
- 11.2.3.Unibio A/S
- 11.2.4.Calysta Inc.
- 11.2.5.Alltech Inc.
- 11.2.6.Nutrinsic
- 11.2.7.Blue Bio Tech International GmbH
- 11.2.8.Parry Nutraceuticals
- 11.2.9.Lallemand Inc.
- 11.2.10.BIOMIN Holding GmbH
- 11.2.11.Devenish Nutrition, LLC
- 11.2.12.Unilever
- 11.2.13.Vega Pharma Ltd.
- 11.2.14.CBH Qingdao Co. Ltd.
- 11.2.15.Cyanotech Corp.
- 11.2.16.Others
12.360 Degree Analyst View
13.Appendix
- 13.1.Research Methodology
- 13.2.References
- 13.3.Abbreviations
- 13.4.Disclaimer
- 13.5.Contact Us
