
|
市場調査レポート
商品コード
1645726
Esportsの世界市場:用途別、ストリーミングタイプ別、デバイスタイプ別、収益ストリーム別 - 機会分析と産業予測、2024年~2033年Esports Market By Application, By Streaming type, By Device Type, By Revenue Stream : Global Opportunity Analysis and Industry Forecast, 2024-2033 |
||||||
|
|||||||

| Esportsの世界市場:用途別、ストリーミングタイプ別、デバイスタイプ別、収益ストリーム別 - 機会分析と産業予測、2024年~2033年 |
|
出版日: 2024年12月01日
発行: Allied Market Research
ページ情報: 英文 300 Pages
納期: 2~3営業日
|

- 全表示
- 概要
- 目次
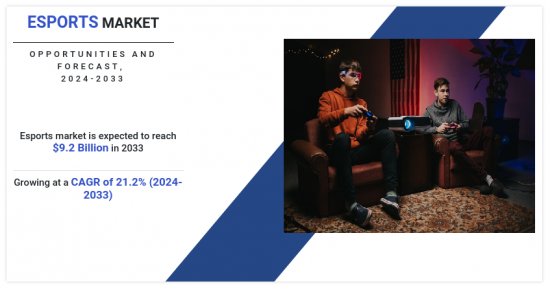
世界のEsports市場は、2023年に13億米ドルとなり、2023年から2033年にかけて21.2%のCAGRで成長し、2033年までには92億米ドルに達すると予測されています。
一般にeSportsまたはeGamesとして知られるエレクトロニックスポーツには、賞金やその他の報酬を賭けてチームがトーナメントで競い合う、組織化された競合ビデオゲームが含まれます。伝統的なスポーツと同様、一流のアスリートたちが、それぞれのゲームでトップの座を争います。さらに、モバイルユーザーの増加により、プレイヤーや視聴者が事実上どこからでもこれらのゲームに参加することが容易になり、Esportsをプレイしたり観戦したりするためにデスクトップコンピュータや特定の場所に縛られる必要がなくなりました。
Esports業界は、オンラインゲームの人気の高まり、モバイル機器によるアクセスの向上、ストリーミングプラットフォームの台頭など、いくつかの重要な要因に後押しされ、近年目覚ましい成長を遂げています。TwitchやYouTube Gamingを含むライブストリーミングプラットフォームの成長は、Esportsのリーチを大幅に広げ、世界中の視聴者がアクセスできるようにしました。また、特にアジア太平洋では、スマートフォンの普及が進んでいることから、モバイルゲームが大きな勢力として台頭しています。もうひとつの注目すべき動向は、伝統的なスポーツチーム、メディア企業、大手ブランドからの投資が増加し、Esportsのプロ化が進んでいることです。さらに、仮想現実(VR)と拡張現実(AR)の進歩により、没入型のゲーム体験が導入され、プレーヤーのエンゲージメントと観客の相互作用の両方が強化されています。
TwitchやYouTubeゲーミングのようなライブストリーミングプラットフォームの増加は、視聴者のリーチを拡大し、Esportsを世界中の視聴者にとってより身近なものにしています。また、特にアジア太平洋では、スマートフォンの普及が進んでいるため、モバイルゲームが圧倒的な力を持つようになっています。もうひとつの大きな動向は、従来のスポーツチームやメディア企業、ブランドからの投資が増加し、Esportsのプロ化が進んでいることです。加えて、仮想現実(VR)や拡張現実(AR)の進歩が新たな没入型ゲーム体験を生み出し、プレーヤーのエンゲージメントや観客とのインタラクションを高めています。
例えば、2024年9月、Ant EsportsはニューデリーのOkhla Phase IIに新しい製造施設の落成式を行いました。この最新鋭施設から最初に出荷される製品は、インド政府の「Make in India」イニシアティブの下、特筆すべき成果であるValue Series Power Supply(VS650L)です。
しかし、データのプライバシーやセキュリティに関する懸念、規制や法的課題が、世界市場の成長を妨げると予想されます。さらに、スポンサーシップと投資戦略の拡大は、Esports市場の成長に多くの機会を提供すると期待されています。
セグメントのレビュー
Esports産業は、用途、ストリーミングタイプ、デバイスタイプ、収益ストリーム、地域に基づいてセグメント化されます。用途別では、プラットフォームとサービスに二分されます。ストリーミングタイプでは、ライブとオンデマンドに分けられます。デバイスタイプ別では、スマートフォン、スマートTV、デスクトップ・ノートPC・タブレット、ゲーム機に分類されます。収益ストリーム別では、メディアライツ、ゲームパブリッシャーフィー、スポンサーシップ、デジタル広告、チケット、グッズに分類されます。地域別では、北米、欧州、アジア太平洋、ラテンアメリカ、中東・アフリカで分析されています。
主な調査結果
用途別では、プラットフォームセグメントが2023年に最大の市場シェアを占めました。
ストリーミングタイプ別では、オンデマンドセグメントが2023年に最大の市場シェアを占めました。
デバイスタイプ別では、スマートフォンセグメントが2023年に最大の市場シェアを占めました。
収益ストリーム別では、スポンサーシップセグメントが2023年に最大の市場シェアを占めました。
地域別では、北米が2023年に最も高い収益を上げました。
競合情勢:
本レポートで可能なカスタマイズ(追加費用とスケジュールがあります。)
- エンドユーザーの選好とペインポイント
- 産業のライフサイクル評価:地域別
- 製品ベンチマーク/製品仕様と用途
- 製品ライフサイクル
- セナリオ分析と成長動向比較
- 技術動向分析
- 市場参入戦略
- 製品/セグメント別の市場セグメンテーション
- 主要企業の新製品開発/製品マトリックス
- ペインポイント分析
- 規制ガイドライン
- 戦略的提言
- クライアントの関心に特化した追加企業プロファイル
- 国別または地域別追加分析-市場規模と予測
- ブランドシェア分析
- クリスクロスセグメント分析-市場規模と予測
- 企業プロファイルの拡張リスト
- 過去の市場データ
- 世界/地域/国別プレーヤーシェア分析
- SWOT分析
目次
第1章 イントロダクション
第2章 エグゼクティブサマリー
第3章 市場概要
- 市場の定義と範囲
- 主要な調査結果
- 主要な影響要因
- 主要な投資機会
- ポーターのファイブフォース分析
- 市場力学
- 促進要因
- 抑制要因
- 機会
第4章 Esports市場:用途別
- 概要
- プラットフォーム
- サービス
第5章 Esports市場:ストリーミングタイプ別
- 概要
- オンデマンド
- ライブ
第6章 Esports市場:デバイスタイプ別
- 概要
- スマートフォン
- スマートTV
- デスクトップ・ノートPC・タブレット
- ゲーム機
第7章 Esports市場:収益ストリーム別
- 概要
- メディアライツ
- ゲームパブリッシャー料
- スポンサーシップ
- デジタル広告
- チケット・グッズ
第8章 Esports市場:地域別
- 概要
- 北米
- 米国
- カナダ
- 欧州
- 英国
- ドイツ
- フランス
- イタリア
- スペイン
- その他
- アジア太平洋
- 中国
- 日本
- インド
- オーストラリア
- 韓国
- その他
- ラテンアメリカ
- ラテンアメリカ
- 中東
- アフリカ
第9章 競合情勢
- イントロダクション
- 主要成功戦略
- 主要10社の製品マッピング
- 競合ダッシュボード
- 競合ヒートマップ
- 主要企業のポジショニング、2023年
第10章 企業プロファイル
- CJ Corporation
- Kabam Inc.
- Modern Times Group
- Gameloft SE
- Gfinity
- Activision Blizzard, Inc.
- Electronic Arts
- FACEIT
- FACEIT Ltd.
- NVIDIA Corporation
- Nintendo Co. Ltd.
The global esports market was valued at $1.3 billion in 2023 and is projected to reach $9.2 billion by 2033, growing at a CAGR of 21.2% from 2023 to 2033. Electronic sports, commonly known as eSports or eGames, involve organized competitive video gaming where teams compete in tournaments for cash prizes and other rewards. Similar to traditional sports, top-tier athletes vie for the top positions in their chosen games. Additionally, the growing number of mobile users has made it easier for players and viewers to engage with these games from virtually anywhere, eliminating the need to be tied to a desktop computer or a specific location to play or watch esports.
The esports industry has witnessed impressive growth in recent years, fueled by several key factors such as the increasing popularity of online gaming, greater accessibility through mobile devices, and the rise of streaming platforms. The growth of live streaming platforms including Twitch and YouTube Gaming has significantly broadened the reach of esports, making it accessible to a global audience. Mobile gaming is also emerging as a major force, especially in regions such as Asia-Pacific, driven by the increasing penetration of smartphones. Another notable trend is the professionalization of esports, with rising investments from traditional sports teams, media companies, and major brands. Furthermore, advancements in virtual reality (VR) and augmented reality (AR) are introducing immersive gaming experiences, enhancing both player engagement and spectator interaction.
Rise in the number of live streaming platforms such as Twitch and YouTube gaming has expanded audience reach, making esports more accessible to a global audience. Mobile gaming is also becoming a dominant force, particularly in regions such as Asia-Pacific, due to increased smartphone penetration. Another significant trend is the professionalization of esports, with growing investments from traditional sports teams, media companies, and brands. In addition, advancements in virtual reality (VR) and augmented reality (AR) are creating new immersive gaming experiences, enhancing player engagement and spectator interaction.
For instance, in September 2024, Ant Esports launched an inauguration of their new manufacturing facility in Okhla Phase II, New Delhi. The first product to roll out of this state-of-the-art facility is the Value Series Power Supply (VS650L), a notable achievement under the Government of India's "Make in India" initiative.
However, data privacy and security concerns and regulatory and legal challenges are expected to hamper the global market growth. Furthermore, growing sponsorship and investment strategies are expected to provide numerous opportunities for the growth of the esports market.
Segment Review:
The esports industry is segmented on the basis of application, streaming type, device type, revenue stream, and region. By application, it is bifurcated into platform and service. By streaming type, it is divided into live and on demand. By device type, it is categorized into smart phone, smart TV, desktop-laptop-tablets, gaming console. By revenue stream, it is classified into media rights, game publisher fee, sponsorship, digital advertisement, tickets, and merchandise. Region-wise, it is analysed across North America, Europe, Asia-Pacific, and LAMEA.
Key Findings:
By application, the platform segment accounted for the largest market share in 2023.
By streaming type, the on demand segment accounted for the largest market share in 2023.
By device type, the smart phone segment accounted for the largest market share in 2023.
By revenue stream, the sponsorship segment accounted for the largest market share in 2023.
Region-wise, North America generated the highest revenue in 2023.
Competitive Landscape:
Competitive analysis and profiles of the major players in the esports market include Tencent, Activision Blizzard, Inc., Modern Times Group, NVIDIA Corporation, Electronic Arts, Gameloft SE, FACEIT, CJ Corporation, Kabam, and Gfinity. These major players have adopted various key development strategies such as business expansion, new product launches, and partnerships, which help to drive the growth of the esports market globally.
Additional benefits you will get with this purchase are:
- Quarterly Update and* (only available with a corporate license, on listed price)
- 5 additional Company Profile of client Choice pre- or Post-purchase, as a free update.
- Free Upcoming Version on the Purchase of Five and Enterprise User License.
- 16 analyst hours of support* (post-purchase, if you find additional data requirements upon review of the report, you may receive support amounting to 16 analyst hours to solve questions, and post-sale queries)
- 15% Free Customization* (in case the scope or segment of the report does not match your requirements, 15% is equivalent to 3 working days of free work, applicable once)
- Free data Pack on the Five and Enterprise User License. (Excel version of the report)
- Free Updated report if the report is 6-12 months old or older.
- 24-hour priority response*
- Free Industry updates and white papers.
Possible Customization with this report (with additional cost and timeline, please talk to the sales executive to know more)
- End user preferences and pain points
- Industry life cycle assessment, by region
- Product Benchmarking / Product specification and applications
- Product Life Cycles
- Senario Analysis & Growth Trend Comparision
- Technology Trend Analysis
- Go To Market Strategy
- Market share analysis of players by products/segments
- New Product Development/ Product Matrix of Key Players
- Pain Point Analysis
- Regulatory Guidelines
- Strategic Recommedations
- Additional company profiles with specific to client's interest
- Additional country or region analysis- market size and forecast
- Brands Share Analysis
- Criss-cross segment analysis- market size and forecast
- Expanded list for Company Profiles
- Historic market data
- Market share analysis of players at global/region/country level
- SWOT Analysis
Key Market Segments
By Revenue Stream
- Media rights
- Game publisher fee
- Sponsorship
- Digital advertisement
- Tickets and merchandise
By Application
- Platform
- Service
By Streaming type
- On demand
- Live
By Device Type
- Smart phone
- Smart TV
- Desktop -laptop-tablets
- Gaming console
By Region
- North America
- U.S.
- Canada
- Europe
- UK
- Germany
- France
- Italy
- Spain
- Rest of Europe
- Asia-Pacific
- China
- Japan
- India
- Australia
- South Korea
- Rest of Europe
- LAMEA
- Latin America
- Middle East
- Africa
Key Market Players:
- CJ Corporation
- Kabam Inc.
- Modern Times Group
- Gameloft SE
- Gfinity
- Activision Blizzard, Inc.
- Electronic Arts
- FACEIT
- FACEIT Ltd.
- NVIDIA Corporation
- Nintendo Co. Ltd.
TABLE OF CONTENTS
CHAPTER 1: INTRODUCTION
- 1.1. Report description
- 1.2. Key market segments
- 1.3. Key benefits to the stakeholders
- 1.4. Research methodology
- 1.4.1. Primary research
- 1.4.2. Secondary research
- 1.4.3. Analyst tools and models
CHAPTER 2: EXECUTIVE SUMMARY
- 2.1. CXO perspective
CHAPTER 3: MARKET OVERVIEW
- 3.1. Market definition and scope
- 3.2. Key findings
- 3.2.1. Top impacting factors
- 3.2.2. Top investment pockets
- 3.3. Porter's five forces analysis
- 3.4. Market dynamics
- 3.4.1. Drivers
- 3.4.2. Restraints
- 3.4.3. Opportunities
CHAPTER 4: ESPORTS MARKET, BY APPLICATION
- 4.1. Overview
- 4.1.1. Market size and forecast
- 4.2. Platform
- 4.2.1. Key market trends, growth factors and opportunities
- 4.2.2. Market size and forecast, by region
- 4.2.3. Market share analysis by country
- 4.3. Service
- 4.3.1. Key market trends, growth factors and opportunities
- 4.3.2. Market size and forecast, by region
- 4.3.3. Market share analysis by country
CHAPTER 5: ESPORTS MARKET, BY STREAMING TYPE
- 5.1. Overview
- 5.1.1. Market size and forecast
- 5.2. On demand
- 5.2.1. Key market trends, growth factors and opportunities
- 5.2.2. Market size and forecast, by region
- 5.2.3. Market share analysis by country
- 5.3. Live
- 5.3.1. Key market trends, growth factors and opportunities
- 5.3.2. Market size and forecast, by region
- 5.3.3. Market share analysis by country
CHAPTER 6: ESPORTS MARKET, BY DEVICE TYPE
- 6.1. Overview
- 6.1.1. Market size and forecast
- 6.2. Smart phone
- 6.2.1. Key market trends, growth factors and opportunities
- 6.2.2. Market size and forecast, by region
- 6.2.3. Market share analysis by country
- 6.3. Smart TV
- 6.3.1. Key market trends, growth factors and opportunities
- 6.3.2. Market size and forecast, by region
- 6.3.3. Market share analysis by country
- 6.4. Desktop -laptop-tablets
- 6.4.1. Key market trends, growth factors and opportunities
- 6.4.2. Market size and forecast, by region
- 6.4.3. Market share analysis by country
- 6.5. Gaming console
- 6.5.1. Key market trends, growth factors and opportunities
- 6.5.2. Market size and forecast, by region
- 6.5.3. Market share analysis by country
CHAPTER 7: ESPORTS MARKET, BY REVENUE STREAM
- 7.1. Overview
- 7.1.1. Market size and forecast
- 7.2. Media rights
- 7.2.1. Key market trends, growth factors and opportunities
- 7.2.2. Market size and forecast, by region
- 7.2.3. Market share analysis by country
- 7.3. Game publisher fee
- 7.3.1. Key market trends, growth factors and opportunities
- 7.3.2. Market size and forecast, by region
- 7.3.3. Market share analysis by country
- 7.4. Sponsorship
- 7.4.1. Key market trends, growth factors and opportunities
- 7.4.2. Market size and forecast, by region
- 7.4.3. Market share analysis by country
- 7.5. Digital advertisement
- 7.5.1. Key market trends, growth factors and opportunities
- 7.5.2. Market size and forecast, by region
- 7.5.3. Market share analysis by country
- 7.6. Tickets and merchandise
- 7.6.1. Key market trends, growth factors and opportunities
- 7.6.2. Market size and forecast, by region
- 7.6.3. Market share analysis by country
CHAPTER 8: ESPORTS MARKET, BY REGION
- 8.1. Overview
- 8.1.1. Market size and forecast By Region
- 8.2. North America
- 8.2.1. Key market trends, growth factors and opportunities
- 8.2.2. Market size and forecast, by Application
- 8.2.3. Market size and forecast, by Streaming type
- 8.2.4. Market size and forecast, by Device Type
- 8.2.5. Market size and forecast, by Revenue Stream
- 8.2.6. Market size and forecast, by country
- 8.2.6.1. U.S.
- 8.2.6.1.1. Market size and forecast, by Application
- 8.2.6.1.2. Market size and forecast, by Streaming type
- 8.2.6.1.3. Market size and forecast, by Device Type
- 8.2.6.1.4. Market size and forecast, by Revenue Stream
- 8.2.6.2. Canada
- 8.2.6.2.1. Market size and forecast, by Application
- 8.2.6.2.2. Market size and forecast, by Streaming type
- 8.2.6.2.3. Market size and forecast, by Device Type
- 8.2.6.2.4. Market size and forecast, by Revenue Stream
- 8.3. Europe
- 8.3.1. Key market trends, growth factors and opportunities
- 8.3.2. Market size and forecast, by Application
- 8.3.3. Market size and forecast, by Streaming type
- 8.3.4. Market size and forecast, by Device Type
- 8.3.5. Market size and forecast, by Revenue Stream
- 8.3.6. Market size and forecast, by country
- 8.3.6.1. UK
- 8.3.6.1.1. Market size and forecast, by Application
- 8.3.6.1.2. Market size and forecast, by Streaming type
- 8.3.6.1.3. Market size and forecast, by Device Type
- 8.3.6.1.4. Market size and forecast, by Revenue Stream
- 8.3.6.2. Germany
- 8.3.6.2.1. Market size and forecast, by Application
- 8.3.6.2.2. Market size and forecast, by Streaming type
- 8.3.6.2.3. Market size and forecast, by Device Type
- 8.3.6.2.4. Market size and forecast, by Revenue Stream
- 8.3.6.3. France
- 8.3.6.3.1. Market size and forecast, by Application
- 8.3.6.3.2. Market size and forecast, by Streaming type
- 8.3.6.3.3. Market size and forecast, by Device Type
- 8.3.6.3.4. Market size and forecast, by Revenue Stream
- 8.3.6.4. Italy
- 8.3.6.4.1. Market size and forecast, by Application
- 8.3.6.4.2. Market size and forecast, by Streaming type
- 8.3.6.4.3. Market size and forecast, by Device Type
- 8.3.6.4.4. Market size and forecast, by Revenue Stream
- 8.3.6.5. Spain
- 8.3.6.5.1. Market size and forecast, by Application
- 8.3.6.5.2. Market size and forecast, by Streaming type
- 8.3.6.5.3. Market size and forecast, by Device Type
- 8.3.6.5.4. Market size and forecast, by Revenue Stream
- 8.3.6.6. Rest of Europe
- 8.3.6.6.1. Market size and forecast, by Application
- 8.3.6.6.2. Market size and forecast, by Streaming type
- 8.3.6.6.3. Market size and forecast, by Device Type
- 8.3.6.6.4. Market size and forecast, by Revenue Stream
- 8.4. Asia-Pacific
- 8.4.1. Key market trends, growth factors and opportunities
- 8.4.2. Market size and forecast, by Application
- 8.4.3. Market size and forecast, by Streaming type
- 8.4.4. Market size and forecast, by Device Type
- 8.4.5. Market size and forecast, by Revenue Stream
- 8.4.6. Market size and forecast, by country
- 8.4.6.1. China
- 8.4.6.1.1. Market size and forecast, by Application
- 8.4.6.1.2. Market size and forecast, by Streaming type
- 8.4.6.1.3. Market size and forecast, by Device Type
- 8.4.6.1.4. Market size and forecast, by Revenue Stream
- 8.4.6.2. Japan
- 8.4.6.2.1. Market size and forecast, by Application
- 8.4.6.2.2. Market size and forecast, by Streaming type
- 8.4.6.2.3. Market size and forecast, by Device Type
- 8.4.6.2.4. Market size and forecast, by Revenue Stream
- 8.4.6.3. India
- 8.4.6.3.1. Market size and forecast, by Application
- 8.4.6.3.2. Market size and forecast, by Streaming type
- 8.4.6.3.3. Market size and forecast, by Device Type
- 8.4.6.3.4. Market size and forecast, by Revenue Stream
- 8.4.6.4. Australia
- 8.4.6.4.1. Market size and forecast, by Application
- 8.4.6.4.2. Market size and forecast, by Streaming type
- 8.4.6.4.3. Market size and forecast, by Device Type
- 8.4.6.4.4. Market size and forecast, by Revenue Stream
- 8.4.6.5. South Korea
- 8.4.6.5.1. Market size and forecast, by Application
- 8.4.6.5.2. Market size and forecast, by Streaming type
- 8.4.6.5.3. Market size and forecast, by Device Type
- 8.4.6.5.4. Market size and forecast, by Revenue Stream
- 8.4.6.6. Rest of Europe
- 8.4.6.6.1. Market size and forecast, by Application
- 8.4.6.6.2. Market size and forecast, by Streaming type
- 8.4.6.6.3. Market size and forecast, by Device Type
- 8.4.6.6.4. Market size and forecast, by Revenue Stream
- 8.5. LAMEA
- 8.5.1. Key market trends, growth factors and opportunities
- 8.5.2. Market size and forecast, by Application
- 8.5.3. Market size and forecast, by Streaming type
- 8.5.4. Market size and forecast, by Device Type
- 8.5.5. Market size and forecast, by Revenue Stream
- 8.5.6. Market size and forecast, by country
- 8.5.6.1. Latin America
- 8.5.6.1.1. Market size and forecast, by Application
- 8.5.6.1.2. Market size and forecast, by Streaming type
- 8.5.6.1.3. Market size and forecast, by Device Type
- 8.5.6.1.4. Market size and forecast, by Revenue Stream
- 8.5.6.2. Middle East
- 8.5.6.2.1. Market size and forecast, by Application
- 8.5.6.2.2. Market size and forecast, by Streaming type
- 8.5.6.2.3. Market size and forecast, by Device Type
- 8.5.6.2.4. Market size and forecast, by Revenue Stream
- 8.5.6.3. Africa
- 8.5.6.3.1. Market size and forecast, by Application
- 8.5.6.3.2. Market size and forecast, by Streaming type
- 8.5.6.3.3. Market size and forecast, by Device Type
- 8.5.6.3.4. Market size and forecast, by Revenue Stream
CHAPTER 9: COMPETITIVE LANDSCAPE
- 9.1. Introduction
- 9.2. Top winning strategies
- 9.3. Product mapping of top 10 player
- 9.4. Competitive dashboard
- 9.5. Competitive heatmap
- 9.6. Top player positioning, 2023
CHAPTER 10: COMPANY PROFILES
- 10.1. CJ Corporation
- 10.1.1. Company overview
- 10.1.2. Key executives
- 10.1.3. Company snapshot
- 10.1.4. Operating business segments
- 10.1.5. Product portfolio
- 10.1.6. Business performance
- 10.1.7. Key strategic moves and developments
- 10.2. Kabam Inc.
- 10.2.1. Company overview
- 10.2.2. Key executives
- 10.2.3. Company snapshot
- 10.2.4. Operating business segments
- 10.2.5. Product portfolio
- 10.2.6. Business performance
- 10.2.7. Key strategic moves and developments
- 10.3. Modern Times Group
- 10.3.1. Company overview
- 10.3.2. Key executives
- 10.3.3. Company snapshot
- 10.3.4. Operating business segments
- 10.3.5. Product portfolio
- 10.3.6. Business performance
- 10.3.7. Key strategic moves and developments
- 10.4. Gameloft SE
- 10.4.1. Company overview
- 10.4.2. Key executives
- 10.4.3. Company snapshot
- 10.4.4. Operating business segments
- 10.4.5. Product portfolio
- 10.4.6. Business performance
- 10.4.7. Key strategic moves and developments
- 10.5. Gfinity
- 10.5.1. Company overview
- 10.5.2. Key executives
- 10.5.3. Company snapshot
- 10.5.4. Operating business segments
- 10.5.5. Product portfolio
- 10.5.6. Business performance
- 10.5.7. Key strategic moves and developments
- 10.6. Activision Blizzard, Inc.
- 10.6.1. Company overview
- 10.6.2. Key executives
- 10.6.3. Company snapshot
- 10.6.4. Operating business segments
- 10.6.5. Product portfolio
- 10.6.6. Business performance
- 10.6.7. Key strategic moves and developments
- 10.7. Electronic Arts
- 10.7.1. Company overview
- 10.7.2. Key executives
- 10.7.3. Company snapshot
- 10.7.4. Operating business segments
- 10.7.5. Product portfolio
- 10.7.6. Business performance
- 10.7.7. Key strategic moves and developments
- 10.8. FACEIT
- 10.8.1. Company overview
- 10.8.2. Key executives
- 10.8.3. Company snapshot
- 10.8.4. Operating business segments
- 10.8.5. Product portfolio
- 10.8.6. Business performance
- 10.8.7. Key strategic moves and developments
- 10.9. FACEIT Ltd.
- 10.9.1. Company overview
- 10.9.2. Key executives
- 10.9.3. Company snapshot
- 10.9.4. Operating business segments
- 10.9.5. Product portfolio
- 10.9.6. Business performance
- 10.9.7. Key strategic moves and developments
- 10.10. NVIDIA Corporation
- 10.10.1. Company overview
- 10.10.2. Key executives
- 10.10.3. Company snapshot
- 10.10.4. Operating business segments
- 10.10.5. Product portfolio
- 10.10.6. Business performance
- 10.10.7. Key strategic moves and developments
- 10.11. Nintendo Co. Ltd.
- 10.11.1. Company overview
- 10.11.2. Key executives
- 10.11.3. Company snapshot
- 10.11.4. Operating business segments
- 10.11.5. Product portfolio
- 10.11.6. Business performance
- 10.11.7. Key strategic moves and developments
