
|
市場調査レポート
商品コード
1513328
倉庫ロボット市場:タイプ別、作業別、エンドユーザー別:世界の機会分析と産業予測、2024年~2032年Warehouse Robotics Market By Type (Automated Guided Vehicles, Articulated Robotic Arms, Collaborative Robots, SCARA Robots, Others), By Operation, By End User : Global Opportunity Analysis and Industry Forecast, 2024-2032 |
||||||
|
|||||||

| 倉庫ロボット市場:タイプ別、作業別、エンドユーザー別:世界の機会分析と産業予測、2024年~2032年 |
|
出版日: 2024年04月01日
発行: Allied Market Research
ページ情報: 英文 290 Pages
納期: 2~3営業日
|

- 全表示
- 概要
- 図表
- 目次
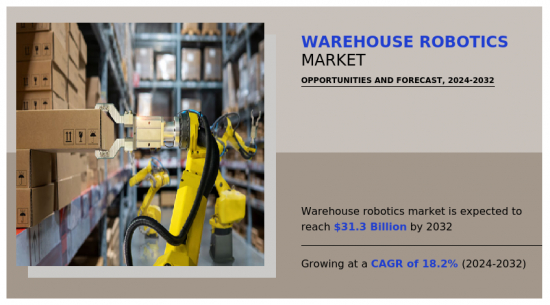
倉庫ロボットの世界市場規模は、2023年に70億6,910万米ドルと評価され、2024年から2032年までのCAGRは18.2%を記録し、2032年には313億4,370万米ドルに達すると予測されています。
倉庫ロボットは、自動化によって工場での人間の労働力を強化または代替するために作られた独立した機械です。さらに、ロボットは、特定の作業用に調整された機械と、それを管理するソフトウェアの2つのコンポーネントで構成されています。通常、ロボットは、倉庫のスロット間やスロットと搬入口間の資材の移動など、特定の機能のために設計されています。さらに、スペース効率を最適化するために、ラック全体を移動させて倉庫のレイアウトを変更できるロボットもあります。加えて、現在のeコマース業界の成長により、倉庫ロボットのニーズが高まっています。倉庫やフルフィルメント・センターは、顧客からのオンライン注文が増加し、より迅速な配送を求められるようになったため、追加的な資金がない中で課題に直面しています。さらに、倉庫は現在、以前と比較して加速された速度で保管から出荷まで製品の移動を迅速に行うことへのプレッシャーが高まっています。
倉庫の自動化は、ソフトウェアとハードウェアを組み合わせて効率を高め、より迅速で効率的な注文処理に取り組んでいます。倉庫管理システム(WMS)は、特定の商品に対する注文の急激な増加を検知します。さらに、WMSは、進行中のオペレーションを中断させることなく、これらの商品をローディングエリアの近くに再配置するよう、ロボットシステムに指示することができます。さらに、注文を処理する際、人間の作業員は、オーダー・ピッキングとパレット構築を迅速に行うことができます。
さらに、倉庫ロボットに関しては、さまざまなセクターがさまざまな導入率を経験しています。ロボット工学を急速に導入しているセクターのひとつに、オンライン小売業があります。実際、アマゾンだけでも2022年の時点で75万台以上のロボットが倉庫で稼働しており、他のeコマース大手もこの技術を取り入れています。例えばウォルマートは、テッククランチが報じたように、2021年に自社の物流センターのうち25カ所に自律型ロボットを導入しました。
タイプ別では、多関節ロボットアーム・セグメントが2023年に最大の収益を上げました。倉庫管理におけるロボット工学とは、製造や物流に関連するアプリケーションにおいて、人間の労働力を代替または補完することを目的とした自己完結型デバイスの使用を指します。ロボットは、物理的な機械の動きを指示するソフトウェアと、特定の機能を実行するように設計された機械自体の2つの部分から構成されています。このようなロボットは、スペースを最大限に利用するためにラックを並べ替えたり、倉庫内で資材を移動させたりするなど、倉庫管理に対応した特定の作業を実行するように作られています。これらのロボットを倉庫管理システムに統合し、高度なセンサーと強力な処理能力を持たせることで、企業はこれらの機械の能力をさらに高めることができます。サプライチェーンの自動化はロボットの影響を大きく受けており、その市場価値は2018年の130億米ドルから2025年には270億米ドルに増加すると予想されています。
作業別では、組立・分解部門が2023年に最大の収益を上げました。倉庫自動化ロボットは、在庫プロセスの自動化を通じてサプライチェーンの可視性を高める可能性を秘めています。かつては、倉庫は通常、簡単に移動できるようには設計されていなかった。しかし、在庫ロボットは、コンピュータビジョン、ディープラーニング、標準化された製品識別を活用してこの問題に対処します。Ware社やGather AI社などの大手企業は、コンピュータ・ビジョンとディープ・ラーニング技術を活用して、倉庫の棚を迅速かつ正確にスキャンし、人間の従業員の能力を凌駕しています。
エンドユーザー別では、自動車分野が2023年に最大の収益を上げました。飲食品業界も、生鮮品を消費者にタイムリーに届けるために効率的で正確なハンドリングに依存しているため、ロボティクスを導入しています。自動車産業は、ロボット工学の活用の先駆者の1つであり、組立ラインに導入しているが、現在では他の分野でも急速に自動化が進んでいます。さらに、製薬会社では、製造する錠剤の出所や履歴を追跡する必要があるため、サプライチェーンに最大限の正確さが要求されるが、こうした厳しい要件を満たすためにロボットを活用するケースが増えています。例えば、テネシー州ナッシュビルに近いアマゾンのフルフィルメントセンターでは、ProteusとCardinalのロボットシステムを組み合わせ、出荷ドックで協働テストを実施しました。カーディナル・システムは、同じ郵便番号宛ての荷物を指定のカートに入れるのを監督しています。スタッフはこの作業を「テトリスごっこ」と呼んでいます。その後、Proteusシステムが自律的に、完全に梱包されたカートを配送トラックまで運び、出荷ドックのオープンフロアをスムーズに移動し、従業員と一緒に作業します。このプロセスを最適化するにはまだ多くの課題があるが、このプロジェクトの潜在的な安全上の利点は実に大きいです。
倉庫ロボット市場は、タイプ、作業、エンドユーザー、地域によって区分されます。タイプ別では、自動搬送車(AGV)、自動入出庫システム、コボット、多関節ロボットアーム、その他に分類されます。操作別では、ピック&プレース、組立・分解、包装に分けられます。エンドユーザー別では、食品・飲料、電子・電気、自動車、その他に分類されます。地域別では、北米、欧州、アジア太平洋、中東・アフリカ、その他に分析されます。
利害関係者にとっての主なメリット
- 当レポートでは、2024年から2032年までの倉庫ロボット市場分析の市場セグメント、現在の動向、推定・動向、力学を定量的に分析し、倉庫ロボット市場の有力な機会を特定します。
- 市場促進要因、市場抑制要因、市場機会に関連する情報とともに市場調査を提供します。
- ポーターのファイブフォース分析では、利害関係者が利益重視のビジネス決定を行い、サプライヤーとバイヤーのネットワークを強化できるように、バイヤーとサプライヤーの潜在力を強調します。
- 倉庫ロボット市場のセグメンテーションを詳細に分析することで、市場機会を見極めることができます。
- 各地域の主要国は、世界市場への収益貢献度に応じてマッピングされています。
- 市場プレイヤーのポジショニングは、ベンチマーキングを容易にし、市場プレイヤーの現在のポジションの明確な理解を提供します。
- 本レポートには、地域別および世界の倉庫ロボット市場動向、主要企業、市場セグメント、応用分野、市場成長戦略の分析が含まれています。
本レポートで可能なカスタマイズ(追加費用とスケジュールがあります。)
- 製品に含まれる原材料の分析(%別)
- 製造能力
- エンドユーザーの嗜好とペインポイント
- 投資機会
- シナリオ分析と成長動向比較
- 技術動向分析
- 消費者の嗜好と製品仕様
- 製品/セグメント別市場シェア分析
- 主なプレイヤーの新製品開発/製品マトリックス
- 戦略的提言
- クライアントの関心に特化した追加企業プロファイル
- 企業プロファイルの拡張リスト
- 過去の市場データ
- 主要プレーヤーの詳細(所在地、連絡先、サプライヤー/ベンダーネットワークなどを含む、エクセル形式)
- 世界/地域/国別レベルでのプレーヤーの市場シェア分析
目次
第1章 イントロダクション
第2章 エグゼクティブサマリー
第3章 市場概要
- 市場の定義と範囲
- 主な調査結果
- 影響要因
- 主な投資機会
- ポーターのファイブフォース分析
- 市場力学
- 促進要因
- 抑制要因
- 機会
第4章 倉庫ロボット市場:タイプ別
- 概要
- 無人搬送車(AGVS)
- 多関節ロボットアーム
- 協働作用ロボット
- スカラロボット
- その他
第5章 倉庫ロボット市場:作業別
- 概要
- ピックアンドプレース
- 組立・分解
- 梱包
第6章 倉庫ロボット市場:エンドユーザー別
- 概要
- 食品・飲料
- 電子・電気
- 自動車
- その他
第7章 倉庫ロボット市場:地域別
- 概要
- 北米
- 米国
- カナダ
- メキシコ
- 欧州
- ドイツ
- フランス
- 英国
- イタリア
- その他
- アジア太平洋
- 中国
- 日本
- 韓国
- インド
- その他
- ラテンアメリカ
- ブラジル
- アルゼンチン
- コロンビア
- チリ
- その他ラテンアメリカ
- 中東・アフリカ
- サウジアラビア
- アラブ首長国連邦
- ナイジェリア
- エジプト
- 中東・アフリカ地域以外
第8章 競合情勢
- イントロダクション
- 主要成功戦略
- 主要10社の製品マッピング
- 競合ダッシュボード
- 競合ヒートマップ
- 主要企業のポジショニング、2023年
第9章 企業プロファイル
- Honeywell International Inc.
- KION Group
- KUKA AG
- BlueBotics
- Omron Corporation
- ABB Ltd.
- Fanuc
- Kawasaki Heavy Industries, Ltd.
- HIRATA Corporation
- Delta Electronics, Inc.
LIST OF TABLES
- TABLE 01. GLOBAL WAREHOUSE ROBOTICS MARKET, BY TYPE, 2023-2032 ($MILLION)
- TABLE 02. WAREHOUSE ROBOTICS MARKET FOR AUTOMATED GUIDED VEHICLES (AGVS), BY REGION, 2023-2032 ($MILLION)
- TABLE 03. WAREHOUSE ROBOTICS MARKET FOR ARTICULATED ROBOTIC ARMS, BY REGION, 2023-2032 ($MILLION)
- TABLE 04. WAREHOUSE ROBOTICS MARKET FOR COLLABORATIVE ROBOTS, BY REGION, 2023-2032 ($MILLION)
- TABLE 05. WAREHOUSE ROBOTICS MARKET FOR SCARA ROBOTS, BY REGION, 2023-2032 ($MILLION)
- TABLE 06. WAREHOUSE ROBOTICS MARKET FOR OTHERS, BY REGION, 2023-2032 ($MILLION)
- TABLE 07. GLOBAL WAREHOUSE ROBOTICS MARKET, BY OPERATION, 2023-2032 ($MILLION)
- TABLE 08. WAREHOUSE ROBOTICS MARKET FOR PICK AND PLACE, BY REGION, 2023-2032 ($MILLION)
- TABLE 09. WAREHOUSE ROBOTICS MARKET FOR ASSEMBLING AND DISSEMBLING, BY REGION, 2023-2032 ($MILLION)
- TABLE 10. WAREHOUSE ROBOTICS MARKET FOR PACKAGING, BY REGION, 2023-2032 ($MILLION)
- TABLE 11. GLOBAL WAREHOUSE ROBOTICS MARKET, BY END USER, 2023-2032 ($MILLION)
- TABLE 12. WAREHOUSE ROBOTICS MARKET FOR FOOD AND BEVERAGE, BY REGION, 2023-2032 ($MILLION)
- TABLE 13. WAREHOUSE ROBOTICS MARKET FOR ELECTRONICS AND ELECTRICAL, BY REGION, 2023-2032 ($MILLION)
- TABLE 14. WAREHOUSE ROBOTICS MARKET FOR AUTOMOTIVE, BY REGION, 2023-2032 ($MILLION)
- TABLE 15. WAREHOUSE ROBOTICS MARKET FOR OTHERS, BY REGION, 2023-2032 ($MILLION)
- TABLE 16. WAREHOUSE ROBOTICS MARKET, BY REGION, 2023-2032 ($MILLION)
- TABLE 17. NORTH AMERICA WAREHOUSE ROBOTICS MARKET, BY TYPE, 2023-2032 ($MILLION)
- TABLE 18. NORTH AMERICA WAREHOUSE ROBOTICS MARKET, BY OPERATION, 2023-2032 ($MILLION)
- TABLE 19. NORTH AMERICA WAREHOUSE ROBOTICS MARKET, BY END USER, 2023-2032 ($MILLION)
- TABLE 20. NORTH AMERICA WAREHOUSE ROBOTICS MARKET, BY COUNTRY, 2023-2032 ($MILLION)
- TABLE 21. U.S. WAREHOUSE ROBOTICS MARKET, BY TYPE, 2023-2032 ($MILLION)
- TABLE 22. U.S. WAREHOUSE ROBOTICS MARKET, BY OPERATION, 2023-2032 ($MILLION)
- TABLE 23. U.S. WAREHOUSE ROBOTICS MARKET, BY END USER, 2023-2032 ($MILLION)
- TABLE 24. CANADA WAREHOUSE ROBOTICS MARKET, BY TYPE, 2023-2032 ($MILLION)
- TABLE 25. CANADA WAREHOUSE ROBOTICS MARKET, BY OPERATION, 2023-2032 ($MILLION)
- TABLE 26. CANADA WAREHOUSE ROBOTICS MARKET, BY END USER, 2023-2032 ($MILLION)
- TABLE 27. MEXICO WAREHOUSE ROBOTICS MARKET, BY TYPE, 2023-2032 ($MILLION)
- TABLE 28. MEXICO WAREHOUSE ROBOTICS MARKET, BY OPERATION, 2023-2032 ($MILLION)
- TABLE 29. MEXICO WAREHOUSE ROBOTICS MARKET, BY END USER, 2023-2032 ($MILLION)
- TABLE 30. EUROPE WAREHOUSE ROBOTICS MARKET, BY TYPE, 2023-2032 ($MILLION)
- TABLE 31. EUROPE WAREHOUSE ROBOTICS MARKET, BY OPERATION, 2023-2032 ($MILLION)
- TABLE 32. EUROPE WAREHOUSE ROBOTICS MARKET, BY END USER, 2023-2032 ($MILLION)
- TABLE 33. EUROPE WAREHOUSE ROBOTICS MARKET, BY COUNTRY, 2023-2032 ($MILLION)
- TABLE 34. GERMANY WAREHOUSE ROBOTICS MARKET, BY TYPE, 2023-2032 ($MILLION)
- TABLE 35. GERMANY WAREHOUSE ROBOTICS MARKET, BY OPERATION, 2023-2032 ($MILLION)
- TABLE 36. GERMANY WAREHOUSE ROBOTICS MARKET, BY END USER, 2023-2032 ($MILLION)
- TABLE 37. FRANCE WAREHOUSE ROBOTICS MARKET, BY TYPE, 2023-2032 ($MILLION)
- TABLE 38. FRANCE WAREHOUSE ROBOTICS MARKET, BY OPERATION, 2023-2032 ($MILLION)
- TABLE 39. FRANCE WAREHOUSE ROBOTICS MARKET, BY END USER, 2023-2032 ($MILLION)
- TABLE 40. UK WAREHOUSE ROBOTICS MARKET, BY TYPE, 2023-2032 ($MILLION)
- TABLE 41. UK WAREHOUSE ROBOTICS MARKET, BY OPERATION, 2023-2032 ($MILLION)
- TABLE 42. UK WAREHOUSE ROBOTICS MARKET, BY END USER, 2023-2032 ($MILLION)
- TABLE 43. ITALY WAREHOUSE ROBOTICS MARKET, BY TYPE, 2023-2032 ($MILLION)
- TABLE 44. ITALY WAREHOUSE ROBOTICS MARKET, BY OPERATION, 2023-2032 ($MILLION)
- TABLE 45. ITALY WAREHOUSE ROBOTICS MARKET, BY END USER, 2023-2032 ($MILLION)
- TABLE 46. REST OF EUROPE WAREHOUSE ROBOTICS MARKET, BY TYPE, 2023-2032 ($MILLION)
- TABLE 47. REST OF EUROPE WAREHOUSE ROBOTICS MARKET, BY OPERATION, 2023-2032 ($MILLION)
- TABLE 48. REST OF EUROPE WAREHOUSE ROBOTICS MARKET, BY END USER, 2023-2032 ($MILLION)
- TABLE 49. ASIA-PACIFIC WAREHOUSE ROBOTICS MARKET, BY TYPE, 2023-2032 ($MILLION)
- TABLE 50. ASIA-PACIFIC WAREHOUSE ROBOTICS MARKET, BY OPERATION, 2023-2032 ($MILLION)
- TABLE 51. ASIA-PACIFIC WAREHOUSE ROBOTICS MARKET, BY END USER, 2023-2032 ($MILLION)
- TABLE 52. ASIA-PACIFIC WAREHOUSE ROBOTICS MARKET, BY COUNTRY, 2023-2032 ($MILLION)
- TABLE 53. CHINA WAREHOUSE ROBOTICS MARKET, BY TYPE, 2023-2032 ($MILLION)
- TABLE 54. CHINA WAREHOUSE ROBOTICS MARKET, BY OPERATION, 2023-2032 ($MILLION)
- TABLE 55. CHINA WAREHOUSE ROBOTICS MARKET, BY END USER, 2023-2032 ($MILLION)
- TABLE 56. JAPAN WAREHOUSE ROBOTICS MARKET, BY TYPE, 2023-2032 ($MILLION)
- TABLE 57. JAPAN WAREHOUSE ROBOTICS MARKET, BY OPERATION, 2023-2032 ($MILLION)
- TABLE 58. JAPAN WAREHOUSE ROBOTICS MARKET, BY END USER, 2023-2032 ($MILLION)
- TABLE 59. SOUTH KOREA WAREHOUSE ROBOTICS MARKET, BY TYPE, 2023-2032 ($MILLION)
- TABLE 60. SOUTH KOREA WAREHOUSE ROBOTICS MARKET, BY OPERATION, 2023-2032 ($MILLION)
- TABLE 61. SOUTH KOREA WAREHOUSE ROBOTICS MARKET, BY END USER, 2023-2032 ($MILLION)
- TABLE 62. INDIA WAREHOUSE ROBOTICS MARKET, BY TYPE, 2023-2032 ($MILLION)
- TABLE 63. INDIA WAREHOUSE ROBOTICS MARKET, BY OPERATION, 2023-2032 ($MILLION)
- TABLE 64. INDIA WAREHOUSE ROBOTICS MARKET, BY END USER, 2023-2032 ($MILLION)
- TABLE 65. REST OF ASIA-PACIFIC WAREHOUSE ROBOTICS MARKET, BY TYPE, 2023-2032 ($MILLION)
- TABLE 66. REST OF ASIA-PACIFIC WAREHOUSE ROBOTICS MARKET, BY OPERATION, 2023-2032 ($MILLION)
- TABLE 67. REST OF ASIA-PACIFIC WAREHOUSE ROBOTICS MARKET, BY END USER, 2023-2032 ($MILLION)
- TABLE 68. LATIN AMERICA WAREHOUSE ROBOTICS MARKET, BY TYPE, 2023-2032 ($MILLION)
- TABLE 69. LATIN AMERICA WAREHOUSE ROBOTICS MARKET, BY OPERATION, 2023-2032 ($MILLION)
- TABLE 70. LATIN AMERICA WAREHOUSE ROBOTICS MARKET, BY END USER, 2023-2032 ($MILLION)
- TABLE 71. LATIN AMERICA WAREHOUSE ROBOTICS MARKET, BY COUNTRY, 2023-2032 ($MILLION)
- TABLE 72. BRAZIL WAREHOUSE ROBOTICS MARKET, BY TYPE, 2023-2032 ($MILLION)
- TABLE 73. BRAZIL WAREHOUSE ROBOTICS MARKET, BY OPERATION, 2023-2032 ($MILLION)
- TABLE 74. BRAZIL WAREHOUSE ROBOTICS MARKET, BY END USER, 2023-2032 ($MILLION)
- TABLE 75. ARGENTINA WAREHOUSE ROBOTICS MARKET, BY TYPE, 2023-2032 ($MILLION)
- TABLE 76. ARGENTINA WAREHOUSE ROBOTICS MARKET, BY OPERATION, 2023-2032 ($MILLION)
- TABLE 77. ARGENTINA WAREHOUSE ROBOTICS MARKET, BY END USER, 2023-2032 ($MILLION)
- TABLE 78. COLOMBIA WAREHOUSE ROBOTICS MARKET, BY TYPE, 2023-2032 ($MILLION)
- TABLE 79. COLOMBIA WAREHOUSE ROBOTICS MARKET, BY OPERATION, 2023-2032 ($MILLION)
- TABLE 80. COLOMBIA WAREHOUSE ROBOTICS MARKET, BY END USER, 2023-2032 ($MILLION)
- TABLE 81. CHILE WAREHOUSE ROBOTICS MARKET, BY TYPE, 2023-2032 ($MILLION)
- TABLE 82. CHILE WAREHOUSE ROBOTICS MARKET, BY OPERATION, 2023-2032 ($MILLION)
- TABLE 83. CHILE WAREHOUSE ROBOTICS MARKET, BY END USER, 2023-2032 ($MILLION)
- TABLE 84. REST OF LATIN AMERICA WAREHOUSE ROBOTICS MARKET, BY TYPE, 2023-2032 ($MILLION)
- TABLE 85. REST OF LATIN AMERICA WAREHOUSE ROBOTICS MARKET, BY OPERATION, 2023-2032 ($MILLION)
- TABLE 86. REST OF LATIN AMERICA WAREHOUSE ROBOTICS MARKET, BY END USER, 2023-2032 ($MILLION)
- TABLE 87. MIDDLE EAST AND AFRICA WAREHOUSE ROBOTICS MARKET, BY TYPE, 2023-2032 ($MILLION)
- TABLE 88. MIDDLE EAST AND AFRICA WAREHOUSE ROBOTICS MARKET, BY OPERATION, 2023-2032 ($MILLION)
- TABLE 89. MIDDLE EAST AND AFRICA WAREHOUSE ROBOTICS MARKET, BY END USER, 2023-2032 ($MILLION)
- TABLE 90. MIDDLE EAST AND AFRICA WAREHOUSE ROBOTICS MARKET, BY COUNTRY, 2023-2032 ($MILLION)
- TABLE 91. SAUDI ARABIA WAREHOUSE ROBOTICS MARKET, BY TYPE, 2023-2032 ($MILLION)
- TABLE 92. SAUDI ARABIA WAREHOUSE ROBOTICS MARKET, BY OPERATION, 2023-2032 ($MILLION)
- TABLE 93. SAUDI ARABIA WAREHOUSE ROBOTICS MARKET, BY END USER, 2023-2032 ($MILLION)
- TABLE 94. UAE WAREHOUSE ROBOTICS MARKET, BY TYPE, 2023-2032 ($MILLION)
- TABLE 95. UAE WAREHOUSE ROBOTICS MARKET, BY OPERATION, 2023-2032 ($MILLION)
- TABLE 96. UAE WAREHOUSE ROBOTICS MARKET, BY END USER, 2023-2032 ($MILLION)
- TABLE 97. NIGERIA WAREHOUSE ROBOTICS MARKET, BY TYPE, 2023-2032 ($MILLION)
- TABLE 98. NIGERIA WAREHOUSE ROBOTICS MARKET, BY OPERATION, 2023-2032 ($MILLION)
- TABLE 99. NIGERIA WAREHOUSE ROBOTICS MARKET, BY END USER, 2023-2032 ($MILLION)
- TABLE 100. EGYPT WAREHOUSE ROBOTICS MARKET, BY TYPE, 2023-2032 ($MILLION)
- TABLE 101. EGYPT WAREHOUSE ROBOTICS MARKET, BY OPERATION, 2023-2032 ($MILLION)
- TABLE 102. EGYPT WAREHOUSE ROBOTICS MARKET, BY END USER, 2023-2032 ($MILLION)
- TABLE 103. REST OF MEA WAREHOUSE ROBOTICS MARKET, BY TYPE, 2023-2032 ($MILLION)
- TABLE 104. REST OF MEA WAREHOUSE ROBOTICS MARKET, BY OPERATION, 2023-2032 ($MILLION)
- TABLE 105. REST OF MEA WAREHOUSE ROBOTICS MARKET, BY END USER, 2023-2032 ($MILLION)
- TABLE 106. HONEYWELL INTERNATIONAL INC.: KEY EXECUTIVES
- TABLE 107. HONEYWELL INTERNATIONAL INC.: COMPANY SNAPSHOT
- TABLE 108. HONEYWELL INTERNATIONAL INC.: PRODUCT SEGMENTS
- TABLE 109. HONEYWELL INTERNATIONAL INC.: SERVICE SEGMENTS
- TABLE 110. HONEYWELL INTERNATIONAL INC.: PRODUCT PORTFOLIO
- TABLE 111. HONEYWELL INTERNATIONAL INC.: KEY STRATEGIES
- TABLE 112. KION GROUP: KEY EXECUTIVES
- TABLE 113. KION GROUP: COMPANY SNAPSHOT
- TABLE 114. KION GROUP: PRODUCT SEGMENTS
- TABLE 115. KION GROUP: SERVICE SEGMENTS
- TABLE 116. KION GROUP: PRODUCT PORTFOLIO
- TABLE 117. KION GROUP: KEY STRATEGIES
- TABLE 118. KUKA AG: KEY EXECUTIVES
- TABLE 119. KUKA AG: COMPANY SNAPSHOT
- TABLE 120. KUKA AG: PRODUCT SEGMENTS
- TABLE 121. KUKA AG: SERVICE SEGMENTS
- TABLE 122. KUKA AG: PRODUCT PORTFOLIO
- TABLE 123. KUKA AG: KEY STRATEGIES
- TABLE 124. BLUEBOTICS: KEY EXECUTIVES
- TABLE 125. BLUEBOTICS: COMPANY SNAPSHOT
- TABLE 126. BLUEBOTICS: PRODUCT SEGMENTS
- TABLE 127. BLUEBOTICS: SERVICE SEGMENTS
- TABLE 128. BLUEBOTICS: PRODUCT PORTFOLIO
- TABLE 129. BLUEBOTICS: KEY STRATEGIES
- TABLE 130. OMRON CORPORATION: KEY EXECUTIVES
- TABLE 131. OMRON CORPORATION: COMPANY SNAPSHOT
- TABLE 132. OMRON CORPORATION: PRODUCT SEGMENTS
- TABLE 133. OMRON CORPORATION: SERVICE SEGMENTS
- TABLE 134. OMRON CORPORATION: PRODUCT PORTFOLIO
- TABLE 135. OMRON CORPORATION: KEY STRATEGIES
- TABLE 136. ABB LTD.: KEY EXECUTIVES
- TABLE 137. ABB LTD.: COMPANY SNAPSHOT
- TABLE 138. ABB LTD.: PRODUCT SEGMENTS
- TABLE 139. ABB LTD.: SERVICE SEGMENTS
- TABLE 140. ABB LTD.: PRODUCT PORTFOLIO
- TABLE 141. ABB LTD.: KEY STRATEGIES
- TABLE 142. FANUC: KEY EXECUTIVES
- TABLE 143. FANUC: COMPANY SNAPSHOT
- TABLE 144. FANUC: PRODUCT SEGMENTS
- TABLE 145. FANUC: SERVICE SEGMENTS
- TABLE 146. FANUC: PRODUCT PORTFOLIO
- TABLE 147. FANUC: KEY STRATEGIES
- TABLE 148. KAWASAKI HEAVY INDUSTRIES, LTD.: KEY EXECUTIVES
- TABLE 149. KAWASAKI HEAVY INDUSTRIES, LTD.: COMPANY SNAPSHOT
- TABLE 150. KAWASAKI HEAVY INDUSTRIES, LTD.: PRODUCT SEGMENTS
- TABLE 151. KAWASAKI HEAVY INDUSTRIES, LTD.: SERVICE SEGMENTS
- TABLE 152. KAWASAKI HEAVY INDUSTRIES, LTD.: PRODUCT PORTFOLIO
- TABLE 153. KAWASAKI HEAVY INDUSTRIES, LTD.: KEY STRATEGIES
- TABLE 154. HIRATA CORPORATION: KEY EXECUTIVES
- TABLE 155. HIRATA CORPORATION: COMPANY SNAPSHOT
- TABLE 156. HIRATA CORPORATION: PRODUCT SEGMENTS
- TABLE 157. HIRATA CORPORATION: SERVICE SEGMENTS
- TABLE 158. HIRATA CORPORATION: PRODUCT PORTFOLIO
- TABLE 159. HIRATA CORPORATION: KEY STRATEGIES
- TABLE 160. DELTA ELECTRONICS, INC.: KEY EXECUTIVES
- TABLE 161. DELTA ELECTRONICS, INC.: COMPANY SNAPSHOT
- TABLE 162. DELTA ELECTRONICS, INC.: PRODUCT SEGMENTS
- TABLE 163. DELTA ELECTRONICS, INC.: SERVICE SEGMENTS
- TABLE 164. DELTA ELECTRONICS, INC.: PRODUCT PORTFOLIO
- TABLE 165. DELTA ELECTRONICS, INC.: KEY STRATEGIES
LIST OF FIGURES
- FIGURE 01. WAREHOUSE ROBOTICS MARKET, 2023-2032
- FIGURE 02. SEGMENTATION OF WAREHOUSE ROBOTICS MARKET,2023-2032
- FIGURE 03. TOP IMPACTING FACTORS IN WAREHOUSE ROBOTICS MARKET
- FIGURE 04. TOP INVESTMENT POCKETS IN WAREHOUSE ROBOTICS MARKET (2024-2032)
- FIGURE 05. BARGAINING POWER OF SUPPLIERS
- FIGURE 06. BARGAINING POWER OF BUYERS
- FIGURE 07. THREAT OF SUBSTITUTION
- FIGURE 08. THREAT OF SUBSTITUTION
- FIGURE 09. COMPETITIVE RIVALRY
- FIGURE 10. GLOBAL WAREHOUSE ROBOTICS MARKET:DRIVERS, RESTRAINTS AND OPPORTUNITIES
- FIGURE 11. WAREHOUSE ROBOTICS MARKET, BY TYPE, 2023 AND 2032(%)
- FIGURE 12. COMPARATIVE SHARE ANALYSIS OF WAREHOUSE ROBOTICS MARKET FOR AUTOMATED GUIDED VEHICLES (AGVS), BY COUNTRY 2023 AND 2032(%)
- FIGURE 13. COMPARATIVE SHARE ANALYSIS OF WAREHOUSE ROBOTICS MARKET FOR ARTICULATED ROBOTIC ARMS, BY COUNTRY 2023 AND 2032(%)
- FIGURE 14. COMPARATIVE SHARE ANALYSIS OF WAREHOUSE ROBOTICS MARKET FOR COLLABORATIVE ROBOTS , BY COUNTRY 2023 AND 2032(%)
- FIGURE 15. COMPARATIVE SHARE ANALYSIS OF WAREHOUSE ROBOTICS MARKET FOR SCARA ROBOTS, BY COUNTRY 2023 AND 2032(%)
- FIGURE 16. COMPARATIVE SHARE ANALYSIS OF WAREHOUSE ROBOTICS MARKET FOR OTHERS, BY COUNTRY 2023 AND 2032(%)
- FIGURE 17. WAREHOUSE ROBOTICS MARKET, BY OPERATION, 2023 AND 2032(%)
- FIGURE 18. COMPARATIVE SHARE ANALYSIS OF WAREHOUSE ROBOTICS MARKET FOR PICK AND PLACE, BY COUNTRY 2023 AND 2032(%)
- FIGURE 19. COMPARATIVE SHARE ANALYSIS OF WAREHOUSE ROBOTICS MARKET FOR ASSEMBLING AND DISSEMBLING, BY COUNTRY 2023 AND 2032(%)
- FIGURE 20. COMPARATIVE SHARE ANALYSIS OF WAREHOUSE ROBOTICS MARKET FOR PACKAGING, BY COUNTRY 2023 AND 2032(%)
- FIGURE 21. WAREHOUSE ROBOTICS MARKET, BY END USER, 2023 AND 2032(%)
- FIGURE 22. COMPARATIVE SHARE ANALYSIS OF WAREHOUSE ROBOTICS MARKET FOR FOOD AND BEVERAGE, BY COUNTRY 2023 AND 2032(%)
- FIGURE 23. COMPARATIVE SHARE ANALYSIS OF WAREHOUSE ROBOTICS MARKET FOR ELECTRONICS AND ELECTRICAL, BY COUNTRY 2023 AND 2032(%)
- FIGURE 24. COMPARATIVE SHARE ANALYSIS OF WAREHOUSE ROBOTICS MARKET FOR AUTOMOTIVE, BY COUNTRY 2023 AND 2032(%)
- FIGURE 25. COMPARATIVE SHARE ANALYSIS OF WAREHOUSE ROBOTICS MARKET FOR OTHERS, BY COUNTRY 2023 AND 2032(%)
- FIGURE 26. WAREHOUSE ROBOTICS MARKET BY REGION, 2023 AND 2032(%)
- FIGURE 27. U.S. WAREHOUSE ROBOTICS MARKET, 2023-2032 ($MILLION)
- FIGURE 28. CANADA WAREHOUSE ROBOTICS MARKET, 2023-2032 ($MILLION)
- FIGURE 29. MEXICO WAREHOUSE ROBOTICS MARKET, 2023-2032 ($MILLION)
- FIGURE 30. GERMANY WAREHOUSE ROBOTICS MARKET, 2023-2032 ($MILLION)
- FIGURE 31. FRANCE WAREHOUSE ROBOTICS MARKET, 2023-2032 ($MILLION)
- FIGURE 32. UK WAREHOUSE ROBOTICS MARKET, 2023-2032 ($MILLION)
- FIGURE 33. ITALY WAREHOUSE ROBOTICS MARKET, 2023-2032 ($MILLION)
- FIGURE 34. REST OF EUROPE WAREHOUSE ROBOTICS MARKET, 2023-2032 ($MILLION)
- FIGURE 35. CHINA WAREHOUSE ROBOTICS MARKET, 2023-2032 ($MILLION)
- FIGURE 36. JAPAN WAREHOUSE ROBOTICS MARKET, 2023-2032 ($MILLION)
- FIGURE 37. SOUTH KOREA WAREHOUSE ROBOTICS MARKET, 2023-2032 ($MILLION)
- FIGURE 38. INDIA WAREHOUSE ROBOTICS MARKET, 2023-2032 ($MILLION)
- FIGURE 39. REST OF ASIA-PACIFIC WAREHOUSE ROBOTICS MARKET, 2023-2032 ($MILLION)
- FIGURE 40. BRAZIL WAREHOUSE ROBOTICS MARKET, 2023-2032 ($MILLION)
- FIGURE 41. ARGENTINA WAREHOUSE ROBOTICS MARKET, 2023-2032 ($MILLION)
- FIGURE 42. COLOMBIA WAREHOUSE ROBOTICS MARKET, 2023-2032 ($MILLION)
- FIGURE 43. CHILE WAREHOUSE ROBOTICS MARKET, 2023-2032 ($MILLION)
- FIGURE 44. REST OF LATIN AMERICA WAREHOUSE ROBOTICS MARKET, 2023-2032 ($MILLION)
- FIGURE 45. SAUDI ARABIA WAREHOUSE ROBOTICS MARKET, 2023-2032 ($MILLION)
- FIGURE 46. UAE WAREHOUSE ROBOTICS MARKET, 2023-2032 ($MILLION)
- FIGURE 47. NIGERIA WAREHOUSE ROBOTICS MARKET, 2023-2032 ($MILLION)
- FIGURE 48. EGYPT WAREHOUSE ROBOTICS MARKET, 2023-2032 ($MILLION)
- FIGURE 49. REST OF MEA WAREHOUSE ROBOTICS MARKET, 2023-2032 ($MILLION)
- FIGURE 50. TOP WINNING STRATEGIES, BY YEAR
- FIGURE 51. TOP WINNING STRATEGIES, BY DEVELOPMENT
- FIGURE 52. TOP WINNING STRATEGIES, BY COMPANY
- FIGURE 53. PRODUCT MAPPING OF TOP 10 PLAYERS
- FIGURE 54. COMPETITIVE DASHBOARD
- FIGURE 55. COMPETITIVE HEATMAP: WAREHOUSE ROBOTICS MARKET
- FIGURE 56. TOP PLAYER POSITIONING, 2023
The global warehouse robotics market size was valued at $ 7,069.1 million in 2023 and is projected to reach $ 31,343.7 million by 2032, registering a CAGR of 18.2% from 2024 to 2032.
Warehouse robots are independent machines created to enhance or substitute human labor in a factory setting through automation. Moreover, robots consist of two components including the machine tailored for a specific task and the software that manages it. Typically, robots are designed for a specific function, such as transferring materials between warehouse slots or between slots and the loading dock. Additionally, some robots can rearrange the warehouse layout by moving entire racks to optimize space efficiency. In addition, increasing robots need for warehouse robotics owing to the current industry growth in the e-commerce sector. Warehouses and fulfillment centers are facing challenges in the absence of additional funding as customers place an increasing number of orders online and demand faster delivery times. Moreover, warehouses are now experiencing heightened pressure to expedite the movement of products from storage to shipping at an accelerated rate compared to previous times.
Warehouse automation combines software and hardware to enhance efficiency, work in quicker and more efficient order fulfillment. The warehouse management system (WMS) detects a sudden increase in orders for specific products. Moreover, the WMS may instruct its robotic systems to rearrange these items nearer to the loading area without disrupting ongoing operations. Moreover, at the time of processing orders, human workers can expedite order picking and pallet building since it have shorter distances to cover.
Furthermore, different sectors are experiencing varying rates of adoption when it comes to warehouse robotics. One sector that is rapidly implementing robotics is online retail. In fact, Amazon alone had more than 750,000 robots operating in its warehouses as of 2022, and other e-commerce giants are also embracing this technology. Walmart, for instance, introduced autonomous robots to 25 of its distribution centers in 2021, as reported by TechCrunch.
By type, the articulated robotic arm segment had the largest revenue in 2023. In warehousing robotics refers to the use of self-contained devices intended to either replace or supplement human labor in application related to manufacturing or logistics. A robot is made up of two parts: the software that directs the movements of the physical machine and the machine itself, which is designed to carry out a particular function. Such robots are made to perform specific tasks that caters to warehousing, including rearranging racks to maximize space utilization or moving materials around a warehouse. By integrating these robots into warehouse management systems and giving them sophisticated sensors and potent processing power, businesses can further augment the capabilities of these machines. Supply chain automation is greatly impacted by robots, whose market value is expected to increase from $13 billion in 2018 to $27 billion by 2025.
By operation, the assembling & dissembling segment had the largest revenue in 2023. Warehouse automation robotics have the potential to enhance supply chain visibility through the automation of inventory processes. In the past, warehouses were not typically designed for easy navigation. However, inventory robots leverage computer vision, deep learning, and standardized product identification to address this issue. Leading companies such as Ware and Gather AI utilize computer vision and deep learning technologies to swiftly and accurately scan warehouse shelves, surpassing the capabilities of human employees.
By end user, the automotive segment had the largest revenue in 2023. The food and beverage industry is also adopting robotics, as it depends on efficient and precise handling to deliver perishable goods to consumers in a timely manner. The automotive sector was among the pioneers in utilizing robotics, implementing it in assembly lines, and now they are rapidly automating other areas of their operations. Moreover, pharmaceutical companies demand utmost accuracy in their supply chain, as they must trace the origin and history of each pill they manufacture, and they are increasingly turning to robots to assist them in meeting these stringent requirements. For instance, at one of Amazon fulfillment centers close to Nashville, Tennessee, Amazon combined Proteus and Cardinal robotics systems to conduct a collaborative test on an outbound dock. The Cardinal system oversees putting packages destined for the same zip code into designated carts. The staff affectionately refers to this practice as 'playing Tetris'. Subsequently, Proteus system autonomously transports these fully packed carts to delivery trucks, smoothly navigating the open floor of the outbound dock and working alongside employees. Although there is still much work to be done to optimize this process, the potential safety advantages of this project are truly significant.
The warehouse robotics market is segmented on the basis of type, operation, end user, and region. By type, the market is categorized into automated guided vehicles (AGVs), automated storage and retrieval systems, cobots, articulated robotic arms, and others. Depending on operation, it is divided into pick & place, assembling & dissembling, and packaging. By end user, the market is segregated into food & beverage, electronics & electrical, automotive, and others. and Region wise, the market is analyzed across North America, Europe, Asia-Pacific, LA, and MEA.
Competition Analysis
Key companies profiled in the warehouse robotics market include KION Group, Honeywell International Inc., KUKA Industries GmbH & Co. K, BlueBotics, Omron Corporation, ABB Ltd., FANUC, Kawasaki Heavy Industries, Ltd., Hirata Corporation, and Delta Electronics, Inc.
Key Benefits For Stakeholders
- This report provides a quantitative analysis of the market segments, current trends, estimations, and dynamics of the warehouse robotics market analysis from 2024 to 2032 to identify the prevailing warehouse robotics market opportunities.
- The market research is offered along with information related to key drivers, restraints, and opportunities.
- Porter's five forces analysis highlights the potency of buyers and suppliers to enable stakeholders make profit-oriented business decisions and strengthen their supplier-buyer network.
- In-depth analysis of the warehouse robotics market segmentation assists to determine the prevailing market opportunities.
- Major countries in each region are mapped according to their revenue contribution to the global market.
- Market player positioning facilitates benchmarking and provides a clear understanding of the present position of the market players.
- The report includes the analysis of the regional as well as global warehouse robotics market trends, key players, market segments, application areas, and market growth strategies.
Additional benefits you will get with this purchase are:
- Quarterly Update and* (only available with a corporate license, on listed price)
- 5 additional Company Profile of client Choice pre- or Post-purchase, as a free update.
- Free Upcoming Version on the Purchase of Five and Enterprise User License.
- 16 analyst hours of support* (post-purchase, if you find additional data requirements upon review of the report, you may receive support amounting to 16 analyst hours to solve questions, and post-sale queries)
- 15% Free Customization* (in case the scope or segment of the report does not match your requirements, 15% is equivalent to 3 working days of free work, applicable once)
- Free data Pack on the Five and Enterprise User License. (Excel version of the report)
- Free Updated report if the report is 6-12 months old or older.
- 24-hour priority response*
- Free Industry updates and white papers.
Possible Customization with this report (with additional cost and timeline, please talk to the sales executive to know more)
- Analysis of raw material in a product (by %)
- Manufacturing Capacity
- End user preferences and pain points
- Investment Opportunities
- Senario Analysis & Growth Trend Comparision
- Technology Trend Analysis
- Consumer Preference and Product Specifications
- Market share analysis of players by products/segments
- New Product Development/ Product Matrix of Key Players
- Strategic Recommendations
- Additional company profiles with specific to client's interest
- Expanded list for Company Profiles
- Historic market data
- Key player details (including location, contact details, supplier/vendor network etc. in excel format)
- Market share analysis of players at global/region/country level
Key Market Segments
By Operation
- Pick and Place
- Assembling and Dissembling
- Packaging
By Type
- Automated Guided Vehicles (AGVS)
- Articulated Robotic Arms
- Collaborative Robots
- SCARA Robots
- Others
By End User
- Food and Beverage
- Electronics and Electrical
- Automotive
- Others
By Region
- North America
- U.S.
- Canada
- Mexico
- Europe
- Germany
- France
- UK
- Italy
- Rest of Europe
- Asia-Pacific
- China
- Japan
- South Korea
- India
- Rest of Asia-Pacific
- Latin America
- Brazil
- Argentina
- Colombia
- Chile
- Rest of Latin America
- Middle East and Africa
- Saudi Arabia
- UAE
- Nigeria
- Egypt
- Rest Of Mea
Key Market Players:
- Honeywell International Inc.
- KION Group
- KUKA AG
- BlueBotics
- Omron Corporation
- ABB Ltd.
- Fanuc
- Kawasaki Heavy Industries, Ltd.
- HIRATA Corporation
- Delta Electronics, Inc.
TABLE OF CONTENTS
CHAPTER 1: INTRODUCTION
- 1.1. Report description
- 1.2. Key market segments
- 1.3. Key benefits to the stakeholders
- 1.4. Research methodology
- 1.4.1. Primary research
- 1.4.2. Secondary research
- 1.4.3. Analyst tools and models
CHAPTER 2: EXECUTIVE SUMMARY
- 2.1. CXO perspective
CHAPTER 3: MARKET OVERVIEW
- 3.1. Market definition and scope
- 3.2. Key findings
- 3.2.1. Top impacting factors
- 3.2.2. Top investment pockets
- 3.3. Porter's five forces analysis
- 3.4. Market dynamics
- 3.4.1. Drivers
- 3.4.2. Restraints
- 3.4.3. Opportunities
CHAPTER 4: WAREHOUSE ROBOTICS MARKET, BY TYPE
- 4.1. Overview
- 4.1.1. Market size and forecast
- 4.2. Automated Guided Vehicles (AGVS)
- 4.2.1. Key market trends, growth factors and opportunities
- 4.2.2. Market size and forecast, by region
- 4.2.3. Market share analysis by country
- 4.3. Articulated Robotic Arms
- 4.3.1. Key market trends, growth factors and opportunities
- 4.3.2. Market size and forecast, by region
- 4.3.3. Market share analysis by country
- 4.4. Collaborative Robots
- 4.4.1. Key market trends, growth factors and opportunities
- 4.4.2. Market size and forecast, by region
- 4.4.3. Market share analysis by country
- 4.5. SCARA Robots
- 4.5.1. Key market trends, growth factors and opportunities
- 4.5.2. Market size and forecast, by region
- 4.5.3. Market share analysis by country
- 4.6. Others
- 4.6.1. Key market trends, growth factors and opportunities
- 4.6.2. Market size and forecast, by region
- 4.6.3. Market share analysis by country
CHAPTER 5: WAREHOUSE ROBOTICS MARKET, BY OPERATION
- 5.1. Overview
- 5.1.1. Market size and forecast
- 5.2. Pick and Place
- 5.2.1. Key market trends, growth factors and opportunities
- 5.2.2. Market size and forecast, by region
- 5.2.3. Market share analysis by country
- 5.3. Assembling and Dissembling
- 5.3.1. Key market trends, growth factors and opportunities
- 5.3.2. Market size and forecast, by region
- 5.3.3. Market share analysis by country
- 5.4. Packaging
- 5.4.1. Key market trends, growth factors and opportunities
- 5.4.2. Market size and forecast, by region
- 5.4.3. Market share analysis by country
CHAPTER 6: WAREHOUSE ROBOTICS MARKET, BY END USER
- 6.1. Overview
- 6.1.1. Market size and forecast
- 6.2. Food and Beverage
- 6.2.1. Key market trends, growth factors and opportunities
- 6.2.2. Market size and forecast, by region
- 6.2.3. Market share analysis by country
- 6.3. Electronics and Electrical
- 6.3.1. Key market trends, growth factors and opportunities
- 6.3.2. Market size and forecast, by region
- 6.3.3. Market share analysis by country
- 6.4. Automotive
- 6.4.1. Key market trends, growth factors and opportunities
- 6.4.2. Market size and forecast, by region
- 6.4.3. Market share analysis by country
- 6.5. Others
- 6.5.1. Key market trends, growth factors and opportunities
- 6.5.2. Market size and forecast, by region
- 6.5.3. Market share analysis by country
CHAPTER 7: WAREHOUSE ROBOTICS MARKET, BY REGION
- 7.1. Overview
- 7.1.1. Market size and forecast By Region
- 7.2. North America
- 7.2.1. Key market trends, growth factors and opportunities
- 7.2.2. Market size and forecast, by Type
- 7.2.3. Market size and forecast, by Operation
- 7.2.4. Market size and forecast, by End User
- 7.2.5. Market size and forecast, by country
- 7.2.5.1. U.S.
- 7.2.5.1.1. Market size and forecast, by Type
- 7.2.5.1.2. Market size and forecast, by Operation
- 7.2.5.1.3. Market size and forecast, by End User
- 7.2.5.2. Canada
- 7.2.5.2.1. Market size and forecast, by Type
- 7.2.5.2.2. Market size and forecast, by Operation
- 7.2.5.2.3. Market size and forecast, by End User
- 7.2.5.3. Mexico
- 7.2.5.3.1. Market size and forecast, by Type
- 7.2.5.3.2. Market size and forecast, by Operation
- 7.2.5.3.3. Market size and forecast, by End User
- 7.3. Europe
- 7.3.1. Key market trends, growth factors and opportunities
- 7.3.2. Market size and forecast, by Type
- 7.3.3. Market size and forecast, by Operation
- 7.3.4. Market size and forecast, by End User
- 7.3.5. Market size and forecast, by country
- 7.3.5.1. Germany
- 7.3.5.1.1. Market size and forecast, by Type
- 7.3.5.1.2. Market size and forecast, by Operation
- 7.3.5.1.3. Market size and forecast, by End User
- 7.3.5.2. France
- 7.3.5.2.1. Market size and forecast, by Type
- 7.3.5.2.2. Market size and forecast, by Operation
- 7.3.5.2.3. Market size and forecast, by End User
- 7.3.5.3. UK
- 7.3.5.3.1. Market size and forecast, by Type
- 7.3.5.3.2. Market size and forecast, by Operation
- 7.3.5.3.3. Market size and forecast, by End User
- 7.3.5.4. Italy
- 7.3.5.4.1. Market size and forecast, by Type
- 7.3.5.4.2. Market size and forecast, by Operation
- 7.3.5.4.3. Market size and forecast, by End User
- 7.3.5.5. Rest of Europe
- 7.3.5.5.1. Market size and forecast, by Type
- 7.3.5.5.2. Market size and forecast, by Operation
- 7.3.5.5.3. Market size and forecast, by End User
- 7.4. Asia-Pacific
- 7.4.1. Key market trends, growth factors and opportunities
- 7.4.2. Market size and forecast, by Type
- 7.4.3. Market size and forecast, by Operation
- 7.4.4. Market size and forecast, by End User
- 7.4.5. Market size and forecast, by country
- 7.4.5.1. China
- 7.4.5.1.1. Market size and forecast, by Type
- 7.4.5.1.2. Market size and forecast, by Operation
- 7.4.5.1.3. Market size and forecast, by End User
- 7.4.5.2. Japan
- 7.4.5.2.1. Market size and forecast, by Type
- 7.4.5.2.2. Market size and forecast, by Operation
- 7.4.5.2.3. Market size and forecast, by End User
- 7.4.5.3. South Korea
- 7.4.5.3.1. Market size and forecast, by Type
- 7.4.5.3.2. Market size and forecast, by Operation
- 7.4.5.3.3. Market size and forecast, by End User
- 7.4.5.4. India
- 7.4.5.4.1. Market size and forecast, by Type
- 7.4.5.4.2. Market size and forecast, by Operation
- 7.4.5.4.3. Market size and forecast, by End User
- 7.4.5.5. Rest of Asia-Pacific
- 7.4.5.5.1. Market size and forecast, by Type
- 7.4.5.5.2. Market size and forecast, by Operation
- 7.4.5.5.3. Market size and forecast, by End User
- 7.5. Latin America
- 7.5.1. Key market trends, growth factors and opportunities
- 7.5.2. Market size and forecast, by Type
- 7.5.3. Market size and forecast, by Operation
- 7.5.4. Market size and forecast, by End User
- 7.5.5. Market size and forecast, by country
- 7.5.5.1. Brazil
- 7.5.5.1.1. Market size and forecast, by Type
- 7.5.5.1.2. Market size and forecast, by Operation
- 7.5.5.1.3. Market size and forecast, by End User
- 7.5.5.2. Argentina
- 7.5.5.2.1. Market size and forecast, by Type
- 7.5.5.2.2. Market size and forecast, by Operation
- 7.5.5.2.3. Market size and forecast, by End User
- 7.5.5.3. Colombia
- 7.5.5.3.1. Market size and forecast, by Type
- 7.5.5.3.2. Market size and forecast, by Operation
- 7.5.5.3.3. Market size and forecast, by End User
- 7.5.5.4. Chile
- 7.5.5.4.1. Market size and forecast, by Type
- 7.5.5.4.2. Market size and forecast, by Operation
- 7.5.5.4.3. Market size and forecast, by End User
- 7.5.5.5. Rest of Latin America
- 7.5.5.5.1. Market size and forecast, by Type
- 7.5.5.5.2. Market size and forecast, by Operation
- 7.5.5.5.3. Market size and forecast, by End User
- 7.6. Middle East and Africa
- 7.6.1. Key market trends, growth factors and opportunities
- 7.6.2. Market size and forecast, by Type
- 7.6.3. Market size and forecast, by Operation
- 7.6.4. Market size and forecast, by End User
- 7.6.5. Market size and forecast, by country
- 7.6.5.1. Saudi Arabia
- 7.6.5.1.1. Market size and forecast, by Type
- 7.6.5.1.2. Market size and forecast, by Operation
- 7.6.5.1.3. Market size and forecast, by End User
- 7.6.5.2. UAE
- 7.6.5.2.1. Market size and forecast, by Type
- 7.6.5.2.2. Market size and forecast, by Operation
- 7.6.5.2.3. Market size and forecast, by End User
- 7.6.5.3. Nigeria
- 7.6.5.3.1. Market size and forecast, by Type
- 7.6.5.3.2. Market size and forecast, by Operation
- 7.6.5.3.3. Market size and forecast, by End User
- 7.6.5.4. Egypt
- 7.6.5.4.1. Market size and forecast, by Type
- 7.6.5.4.2. Market size and forecast, by Operation
- 7.6.5.4.3. Market size and forecast, by End User
- 7.6.5.5. Rest Of MEA
- 7.6.5.5.1. Market size and forecast, by Type
- 7.6.5.5.2. Market size and forecast, by Operation
- 7.6.5.5.3. Market size and forecast, by End User
CHAPTER 8: COMPETITIVE LANDSCAPE
- 8.1. Introduction
- 8.2. Top winning strategies
- 8.3. Product mapping of top 10 player
- 8.4. Competitive dashboard
- 8.5. Competitive heatmap
- 8.6. Top player positioning, 2023
CHAPTER 9: COMPANY PROFILES
- 9.1. Honeywell International Inc.
- 9.1.1. Company overview
- 9.1.2. Key executives
- 9.1.3. Company snapshot
- 9.1.4. Operating business segments
- 9.1.5. Product portfolio
- 9.1.6. Business performance
- 9.1.7. Key strategic moves and developments
- 9.2. KION Group
- 9.2.1. Company overview
- 9.2.2. Key executives
- 9.2.3. Company snapshot
- 9.2.4. Operating business segments
- 9.2.5. Product portfolio
- 9.2.6. Business performance
- 9.2.7. Key strategic moves and developments
- 9.3. KUKA AG
- 9.3.1. Company overview
- 9.3.2. Key executives
- 9.3.3. Company snapshot
- 9.3.4. Operating business segments
- 9.3.5. Product portfolio
- 9.3.6. Business performance
- 9.3.7. Key strategic moves and developments
- 9.4. BlueBotics
- 9.4.1. Company overview
- 9.4.2. Key executives
- 9.4.3. Company snapshot
- 9.4.4. Operating business segments
- 9.4.5. Product portfolio
- 9.4.6. Business performance
- 9.4.7. Key strategic moves and developments
- 9.5. Omron Corporation
- 9.5.1. Company overview
- 9.5.2. Key executives
- 9.5.3. Company snapshot
- 9.5.4. Operating business segments
- 9.5.5. Product portfolio
- 9.5.6. Business performance
- 9.5.7. Key strategic moves and developments
- 9.6. ABB Ltd.
- 9.6.1. Company overview
- 9.6.2. Key executives
- 9.6.3. Company snapshot
- 9.6.4. Operating business segments
- 9.6.5. Product portfolio
- 9.6.6. Business performance
- 9.6.7. Key strategic moves and developments
- 9.7. Fanuc
- 9.7.1. Company overview
- 9.7.2. Key executives
- 9.7.3. Company snapshot
- 9.7.4. Operating business segments
- 9.7.5. Product portfolio
- 9.7.6. Business performance
- 9.7.7. Key strategic moves and developments
- 9.8. Kawasaki Heavy Industries, Ltd.
- 9.8.1. Company overview
- 9.8.2. Key executives
- 9.8.3. Company snapshot
- 9.8.4. Operating business segments
- 9.8.5. Product portfolio
- 9.8.6. Business performance
- 9.8.7. Key strategic moves and developments
- 9.9. HIRATA Corporation
- 9.9.1. Company overview
- 9.9.2. Key executives
- 9.9.3. Company snapshot
- 9.9.4. Operating business segments
- 9.9.5. Product portfolio
- 9.9.6. Business performance
- 9.9.7. Key strategic moves and developments
- 9.10. Delta Electronics, Inc.
- 9.10.1. Company overview
- 9.10.2. Key executives
- 9.10.3. Company snapshot
- 9.10.4. Operating business segments
- 9.10.5. Product portfolio
- 9.10.6. Business performance
- 9.10.7. Key strategic moves and developments