
|
市場調査レポート
商品コード
1472363
冷凍エビ市場:用途別、供給源別、流通チャネル別:世界の機会分析と産業予測、2023年~2032年Frozen Shrimp Market By Application, By Source, By Distribution Channel : Global Opportunity Analysis and Industry Forecast, 2023-2032 |
||||||
|
|||||||

| 冷凍エビ市場:用途別、供給源別、流通チャネル別:世界の機会分析と産業予測、2023年~2032年 |
|
出版日: 2024年03月01日
発行: Allied Market Research
ページ情報: 英文 345 Pages
納期: 2~3営業日
|

- 全表示
- 概要
- 図表
- 目次
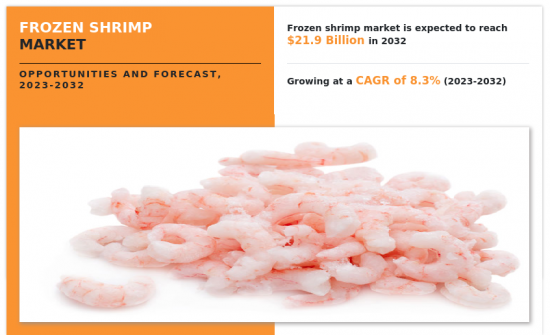
世界の冷凍エビ市場の2022年の市場規模は99億米ドルで、2032年には219億米ドルに達し、2023年から2032年までのCAGRは8.3%で成長すると予測されています。
冷凍エビは魚介類の一種で、収穫、加工後、鮮度と風味を保つために冷凍されます。エビは細菌の繁殖を防ぎ品質を維持するため、多くの場合-18℃以下の極低温で急速冷凍されます。この保存技術により、消費者は味や食感に影響を与えることなく、エビを長期保存することができます。冷凍エビは、様々な料理に使用でき、一年中入手可能で、栄養価を保つことができるため、世界的に人気のあるシーフードです。さらに、冷凍エビは厳格な品質管理を経ているため、安心して食べることができます。
冷凍エビの需要は、各国料理の人気の高まりにより増加傾向にあります。消費者の食の嗜好が冒険的になるにつれ、タイ料理、中華料理、メキシコ料理、イタリア料理など、世界各地の料理を探求する傾向が強まっています。エビはパッタイ、シュリンプタコス、エビチャーハン、エビスカンピなど多くの各国料理の主要食材であり、これが冷凍エビの需要を牽引しています。
さらに、冷凍エビは便利で入手しやすいため、消費者は家庭で簡単に各国料理を再現することができます。冷凍エビはスーパーマーケットや食料品店で手軽に入手できるため、消費者は新鮮な魚介類を調達する手間をかけずに、世界各国のさまざまなレシピや味付けを試すことができます。その結果、各国料理の人気の高まりが冷凍エビ市場の需要急増に寄与しています。消費者は食の多様化を求め、家庭で世界各国の料理の味を楽しんでいます。
市場における冷凍エビの需要は、付加価値の高いエビ製品の技術革新によって増加しています。これらの製品は、エビに付加価値をつけることで、消費者に便利で魅力的な幅広い選択肢を提供しています。付加価値の高いエビ製品には、エビを使ったスナック、前菜、調理済みの食事、マリネ済み、味付け済み、調理済みのエビなどがあります。これらの製品は、味や品質に妥協することなく、手早く簡単な食事を提供することで、忙しいライフスタイルに対応しています。ガーリックバター、ココナッツカレー、レモンハーブなど、さまざまな味付けや調理法があり、シーフードの選択に利便性とバラエティを求める幅広い層に対応しています。
さらに、付加価値の高いエビ製品のイノベーションは、ユニークで斬新な料理の選択肢を提供することで、消費者全体の体験を向上させる。革新的なパッケージデザインや風味を導入することで、メーカーは市場での差別化を図り、消費者の注目を集めることができます。エビの付加価値製品は、間食や外出先での食事といった新たな食品動向を取り込み、市場範囲をさらに拡大し、冷凍エビの需要拡大を促進します。その結果、付加価値の高いエビ製品のイノベーションが成功し、消費者に便利で風味豊かな満足度の高いシーフード選択肢を提供することで、冷凍エビ市場の成長を後押ししています。
しかし、生エビに比べ品質や味に対する懸念が冷凍エビ市場の需要抑制要因となっています。消費者の中には、冷凍エビは生エビに比べて味や食感が劣ると認識している人もいます。このような認識は、冷凍によってエビ本来の風味や食感が損なわれ、満足のいく料理体験が得られないという考えから生じています。さらに、冷凍エビは冷凍・解凍の過程で鮮度や品質が保たれず、風味やジューシーさが損なわれるのではないかという懸念もあります。
さらに、沿岸地域や水産物市場では新鮮なエビが手に入るため、消費者は冷凍エビを選ぶのをためらうかもしれないです。消費者は新鮮な魚介類から、より高品質で優れた味を連想することが多く、冷凍エビよりも新鮮なエビを好むようになります。冷凍エビの品質を維持するための冷凍技術やパッケージング技術は進歩しているもの、こうした懸念は特定の消費者層には根強く、冷凍エビの市場需要を制限しています。そのため、こうした懸念を払拭し、冷凍エビの利点と品質について消費者を啓蒙することが、市場抑制要因を克服して市場成長を促進する上で不可欠です。
冷凍エビ市場は用途、供給源、流通チャネル、地域に区分されます。用途別では、食品、医薬品、化粧品、工業用、バイオテクノロジーに分類されます。ソース別では、市場はオーガニックと従来型に分けられます。流通チャネル別では、市場はスーパーマーケット・ハイパーマーケット、百貨店、B2B、オンライン販売チャネルに分類されます。地域別では、市場は北米、欧州、アジア太平洋、LA、MEAで分析されます。
SeaPak Shrimp Company、東洋水産、High Liner Foods、Aqua Star Corp.などの主要企業は、冷凍エビ市場の製品ポートフォリオを改善するために、製品承認、提携、契約、買収を主要な開発戦略として採用しています。
利害関係者にとっての主なメリット
- 当レポートでは、2022年から2032年までの冷凍エビ市場分析の市場セグメント、現在の動向、推定・動向分析、ダイナミクスを定量的に分析し、一般的な冷凍エビ市場の機会を特定します。
- 市場促進要因、市場抑制要因、市場機会に関連する情報とともに市場調査を提供します。
- ポーターのファイブフォース分析では、利害関係者が利益重視のビジネス決定を下し、サプライヤーとバイヤーのネットワークを強化できるよう、バイヤーとサプライヤーの潜在力を明らかにします。
- 冷凍エビ市場のセグメンテーションを詳細に分析することで、市場機会を見極めることができます。
- 各地域の主要国は、世界市場への収益貢献度に応じてマッピングされています。
- 市場プレイヤーのポジショニングはベンチマーキングを容易にし、市場プレイヤーの現在のポジションを明確に理解することができます。
- 本レポートには、地域および世界の冷凍エビ市場動向、主要企業、市場セグメント、応用分野、市場成長戦略の分析が含まれています。
本レポートで可能なカスタマイズ(追加費用とスケジュールが必要です。)
- エンドユーザーの嗜好とペインポイント
- 製品/セグメント別のプレーヤーの市場シェア分析
- 顧客の関心に応じた企業プロファイルの追加
- 国別または地域別の追加分析-市場規模と予測
- 平均販売価格分析/プライスポイント分析
- ブランドシェア分析
- クリスクロスセグメント分析-市場規模と予測
- 過去の市場データ
- 主要プレーヤーの詳細(所在地、連絡先、サプライヤー/ベンダーネットワークなどを含む、エクセル形式)
目次
第1章 イントロダクション
第2章 エグゼクティブサマリー
第3章 市場概要
- 市場の定義と範囲
- 主な調査結果
- 影響要因
- 主な投資機会
- ポーターのファイブフォース分析
- 市場力学
- 促進要因
- 抑制要因
- 機会
- 市場シェア分析
- ブランドシェア分析
- バリューチェーン分析
- 主要プレイヤーの詳細
第4章 冷凍エビ市場:用途別
- 概要
- 食品
- 医薬品
- 化粧品
- 工業用
- バイオテクノロジー
第5章 冷凍エビ市場:供給源別
- 概要
- 従来型
- 有機
第6章 冷凍えび市場:流通チャネル別
- 概要
- スーパーマーケット/ハイパーマーケット
- 百貨店
- B2B
- オンライン販売チャネル
第7章 冷凍えび市場:地域別
- 概要
- 北米
- 米国
- カナダ
- メキシコ
- 欧州
- ドイツ
- イタリア
- 英国
- フランス
- スペイン
- その他
- アジア太平洋
- 中国
- インド
- 日本
- オーストラリア
- 韓国
- その他
- ラテンアメリカ
- ブラジル
- アルゼンチン
- その他のラテンアメリカ
- 中東・北アフリカ
- 南アフリカ
- サウジアラビア
- その他
第8章 競争情勢
- イントロダクション
- 主要成功戦略
- 主要10社の製品マッピング
- 競合ダッシュボード
- 競合ヒートマップ
- 主要企業のポジショニング、2022年
第9章 企業プロファイル
- SeaPak Shrimp Company
- Toyo Suisan Kaisha
- High Liner Foods
- Aqua Star Corp.
- Clearwater Seafood
- Surapon Foods
- Aqua Chile
- Nordic Seafood A/S
- Seafood Co.
- Thai Union Group
LIST OF TABLES
- TABLE 01. GLOBAL FROZEN SHRIMP MARKET, BY APPLICATION, 2022-2032 ($MILLION)
- TABLE 02. FROZEN SHRIMP MARKET FOR FOOD, BY REGION, 2022-2032 ($MILLION)
- TABLE 03. FROZEN SHRIMP MARKET FOR PHARMACEUTICALS, BY REGION, 2022-2032 ($MILLION)
- TABLE 04. FROZEN SHRIMP MARKET FOR COSMETICS, BY REGION, 2022-2032 ($MILLION)
- TABLE 05. FROZEN SHRIMP MARKET FOR INDUSTRIAL, BY REGION, 2022-2032 ($MILLION)
- TABLE 06. FROZEN SHRIMP MARKET FOR BIOTECHNOLOGY, BY REGION, 2022-2032 ($MILLION)
- TABLE 07. GLOBAL FROZEN SHRIMP MARKET, BY SOURCE, 2022-2032 ($MILLION)
- TABLE 08. FROZEN SHRIMP MARKET FOR CONVENTIONAL, BY REGION, 2022-2032 ($MILLION)
- TABLE 09. FROZEN SHRIMP MARKET FOR ORGANIC, BY REGION, 2022-2032 ($MILLION)
- TABLE 10. GLOBAL FROZEN SHRIMP MARKET, BY DISTRIBUTION CHANNEL, 2022-2032 ($MILLION)
- TABLE 11. FROZEN SHRIMP MARKET FOR SUPERMARKETS/HYPERMARKETS, BY REGION, 2022-2032 ($MILLION)
- TABLE 12. FROZEN SHRIMP MARKET FOR DEPARTMENTAL STORES, BY REGION, 2022-2032 ($MILLION)
- TABLE 13. FROZEN SHRIMP MARKET FOR B2B, BY REGION, 2022-2032 ($MILLION)
- TABLE 14. FROZEN SHRIMP MARKET FOR ONLINE SALES CHANNEL, BY REGION, 2022-2032 ($MILLION)
- TABLE 15. FROZEN SHRIMP MARKET, BY REGION, 2022-2032 ($MILLION)
- TABLE 16. NORTH AMERICA FROZEN SHRIMP MARKET, BY APPLICATION, 2022-2032 ($MILLION)
- TABLE 17. NORTH AMERICA FROZEN SHRIMP MARKET, BY SOURCE, 2022-2032 ($MILLION)
- TABLE 18. NORTH AMERICA FROZEN SHRIMP MARKET, BY DISTRIBUTION CHANNEL, 2022-2032 ($MILLION)
- TABLE 19. NORTH AMERICA FROZEN SHRIMP MARKET, BY COUNTRY, 2022-2032 ($MILLION)
- TABLE 20. U.S. FROZEN SHRIMP MARKET, BY APPLICATION, 2022-2032 ($MILLION)
- TABLE 21. U.S. FROZEN SHRIMP MARKET, BY SOURCE, 2022-2032 ($MILLION)
- TABLE 22. U.S. FROZEN SHRIMP MARKET, BY DISTRIBUTION CHANNEL, 2022-2032 ($MILLION)
- TABLE 23. CANADA FROZEN SHRIMP MARKET, BY APPLICATION, 2022-2032 ($MILLION)
- TABLE 24. CANADA FROZEN SHRIMP MARKET, BY SOURCE, 2022-2032 ($MILLION)
- TABLE 25. CANADA FROZEN SHRIMP MARKET, BY DISTRIBUTION CHANNEL, 2022-2032 ($MILLION)
- TABLE 26. MEXICO FROZEN SHRIMP MARKET, BY APPLICATION, 2022-2032 ($MILLION)
- TABLE 27. MEXICO FROZEN SHRIMP MARKET, BY SOURCE, 2022-2032 ($MILLION)
- TABLE 28. MEXICO FROZEN SHRIMP MARKET, BY DISTRIBUTION CHANNEL, 2022-2032 ($MILLION)
- TABLE 29. EUROPE FROZEN SHRIMP MARKET, BY APPLICATION, 2022-2032 ($MILLION)
- TABLE 30. EUROPE FROZEN SHRIMP MARKET, BY SOURCE, 2022-2032 ($MILLION)
- TABLE 31. EUROPE FROZEN SHRIMP MARKET, BY DISTRIBUTION CHANNEL, 2022-2032 ($MILLION)
- TABLE 32. EUROPE FROZEN SHRIMP MARKET, BY COUNTRY, 2022-2032 ($MILLION)
- TABLE 33. GERMANY FROZEN SHRIMP MARKET, BY APPLICATION, 2022-2032 ($MILLION)
- TABLE 34. GERMANY FROZEN SHRIMP MARKET, BY SOURCE, 2022-2032 ($MILLION)
- TABLE 35. GERMANY FROZEN SHRIMP MARKET, BY DISTRIBUTION CHANNEL, 2022-2032 ($MILLION)
- TABLE 36. ITALY FROZEN SHRIMP MARKET, BY APPLICATION, 2022-2032 ($MILLION)
- TABLE 37. ITALY FROZEN SHRIMP MARKET, BY SOURCE, 2022-2032 ($MILLION)
- TABLE 38. ITALY FROZEN SHRIMP MARKET, BY DISTRIBUTION CHANNEL, 2022-2032 ($MILLION)
- TABLE 39. UK FROZEN SHRIMP MARKET, BY APPLICATION, 2022-2032 ($MILLION)
- TABLE 40. UK FROZEN SHRIMP MARKET, BY SOURCE, 2022-2032 ($MILLION)
- TABLE 41. UK FROZEN SHRIMP MARKET, BY DISTRIBUTION CHANNEL, 2022-2032 ($MILLION)
- TABLE 42. FRANCE FROZEN SHRIMP MARKET, BY APPLICATION, 2022-2032 ($MILLION)
- TABLE 43. FRANCE FROZEN SHRIMP MARKET, BY SOURCE, 2022-2032 ($MILLION)
- TABLE 44. FRANCE FROZEN SHRIMP MARKET, BY DISTRIBUTION CHANNEL, 2022-2032 ($MILLION)
- TABLE 45. SPAIN FROZEN SHRIMP MARKET, BY APPLICATION, 2022-2032 ($MILLION)
- TABLE 46. SPAIN FROZEN SHRIMP MARKET, BY SOURCE, 2022-2032 ($MILLION)
- TABLE 47. SPAIN FROZEN SHRIMP MARKET, BY DISTRIBUTION CHANNEL, 2022-2032 ($MILLION)
- TABLE 48. REST OF EUROPE FROZEN SHRIMP MARKET, BY APPLICATION, 2022-2032 ($MILLION)
- TABLE 49. REST OF EUROPE FROZEN SHRIMP MARKET, BY SOURCE, 2022-2032 ($MILLION)
- TABLE 50. REST OF EUROPE FROZEN SHRIMP MARKET, BY DISTRIBUTION CHANNEL, 2022-2032 ($MILLION)
- TABLE 51. ASIA-PACIFIC FROZEN SHRIMP MARKET, BY APPLICATION, 2022-2032 ($MILLION)
- TABLE 52. ASIA-PACIFIC FROZEN SHRIMP MARKET, BY SOURCE, 2022-2032 ($MILLION)
- TABLE 53. ASIA-PACIFIC FROZEN SHRIMP MARKET, BY DISTRIBUTION CHANNEL, 2022-2032 ($MILLION)
- TABLE 54. ASIA-PACIFIC FROZEN SHRIMP MARKET, BY COUNTRY, 2022-2032 ($MILLION)
- TABLE 55. CHINA FROZEN SHRIMP MARKET, BY APPLICATION, 2022-2032 ($MILLION)
- TABLE 56. CHINA FROZEN SHRIMP MARKET, BY SOURCE, 2022-2032 ($MILLION)
- TABLE 57. CHINA FROZEN SHRIMP MARKET, BY DISTRIBUTION CHANNEL, 2022-2032 ($MILLION)
- TABLE 58. INDIA FROZEN SHRIMP MARKET, BY APPLICATION, 2022-2032 ($MILLION)
- TABLE 59. INDIA FROZEN SHRIMP MARKET, BY SOURCE, 2022-2032 ($MILLION)
- TABLE 60. INDIA FROZEN SHRIMP MARKET, BY DISTRIBUTION CHANNEL, 2022-2032 ($MILLION)
- TABLE 61. JAPAN FROZEN SHRIMP MARKET, BY APPLICATION, 2022-2032 ($MILLION)
- TABLE 62. JAPAN FROZEN SHRIMP MARKET, BY SOURCE, 2022-2032 ($MILLION)
- TABLE 63. JAPAN FROZEN SHRIMP MARKET, BY DISTRIBUTION CHANNEL, 2022-2032 ($MILLION)
- TABLE 64. AUSTRALIA FROZEN SHRIMP MARKET, BY APPLICATION, 2022-2032 ($MILLION)
- TABLE 65. AUSTRALIA FROZEN SHRIMP MARKET, BY SOURCE, 2022-2032 ($MILLION)
- TABLE 66. AUSTRALIA FROZEN SHRIMP MARKET, BY DISTRIBUTION CHANNEL, 2022-2032 ($MILLION)
- TABLE 67. SOUTH KOREA FROZEN SHRIMP MARKET, BY APPLICATION, 2022-2032 ($MILLION)
- TABLE 68. SOUTH KOREA FROZEN SHRIMP MARKET, BY SOURCE, 2022-2032 ($MILLION)
- TABLE 69. SOUTH KOREA FROZEN SHRIMP MARKET, BY DISTRIBUTION CHANNEL, 2022-2032 ($MILLION)
- TABLE 70. REST OF ASIA-PACIFIC FROZEN SHRIMP MARKET, BY APPLICATION, 2022-2032 ($MILLION)
- TABLE 71. REST OF ASIA-PACIFIC FROZEN SHRIMP MARKET, BY SOURCE, 2022-2032 ($MILLION)
- TABLE 72. REST OF ASIA-PACIFIC FROZEN SHRIMP MARKET, BY DISTRIBUTION CHANNEL, 2022-2032 ($MILLION)
- TABLE 73. LATIN AMERICA FROZEN SHRIMP MARKET, BY APPLICATION, 2022-2032 ($MILLION)
- TABLE 74. LATIN AMERICA FROZEN SHRIMP MARKET, BY SOURCE, 2022-2032 ($MILLION)
- TABLE 75. LATIN AMERICA FROZEN SHRIMP MARKET, BY DISTRIBUTION CHANNEL, 2022-2032 ($MILLION)
- TABLE 76. LATIN AMERICA FROZEN SHRIMP MARKET, BY COUNTRY, 2022-2032 ($MILLION)
- TABLE 77. BRAZIL FROZEN SHRIMP MARKET, BY APPLICATION, 2022-2032 ($MILLION)
- TABLE 78. BRAZIL FROZEN SHRIMP MARKET, BY SOURCE, 2022-2032 ($MILLION)
- TABLE 79. BRAZIL FROZEN SHRIMP MARKET, BY DISTRIBUTION CHANNEL, 2022-2032 ($MILLION)
- TABLE 80. ARGENTINA FROZEN SHRIMP MARKET, BY APPLICATION, 2022-2032 ($MILLION)
- TABLE 81. ARGENTINA FROZEN SHRIMP MARKET, BY SOURCE, 2022-2032 ($MILLION)
- TABLE 82. ARGENTINA FROZEN SHRIMP MARKET, BY DISTRIBUTION CHANNEL, 2022-2032 ($MILLION)
- TABLE 83. REST OF LATIN AMERICA FROZEN SHRIMP MARKET, BY APPLICATION, 2022-2032 ($MILLION)
- TABLE 84. REST OF LATIN AMERICA FROZEN SHRIMP MARKET, BY SOURCE, 2022-2032 ($MILLION)
- TABLE 85. REST OF LATIN AMERICA FROZEN SHRIMP MARKET, BY DISTRIBUTION CHANNEL, 2022-2032 ($MILLION)
- TABLE 86. MIDDLE EAST AND NORTH AFRICA FROZEN SHRIMP MARKET, BY APPLICATION, 2022-2032 ($MILLION)
- TABLE 87. MIDDLE EAST AND NORTH AFRICA FROZEN SHRIMP MARKET, BY SOURCE, 2022-2032 ($MILLION)
- TABLE 88. MIDDLE EAST AND NORTH AFRICA FROZEN SHRIMP MARKET, BY DISTRIBUTION CHANNEL, 2022-2032 ($MILLION)
- TABLE 89. MIDDLE EAST AND NORTH AFRICA FROZEN SHRIMP MARKET, BY COUNTRY, 2022-2032 ($MILLION)
- TABLE 90. SOUTH AFRICA FROZEN SHRIMP MARKET, BY APPLICATION, 2022-2032 ($MILLION)
- TABLE 91. SOUTH AFRICA FROZEN SHRIMP MARKET, BY SOURCE, 2022-2032 ($MILLION)
- TABLE 92. SOUTH AFRICA FROZEN SHRIMP MARKET, BY DISTRIBUTION CHANNEL, 2022-2032 ($MILLION)
- TABLE 93. SAUDI ARABIA FROZEN SHRIMP MARKET, BY APPLICATION, 2022-2032 ($MILLION)
- TABLE 94. SAUDI ARABIA FROZEN SHRIMP MARKET, BY SOURCE, 2022-2032 ($MILLION)
- TABLE 95. SAUDI ARABIA FROZEN SHRIMP MARKET, BY DISTRIBUTION CHANNEL, 2022-2032 ($MILLION)
- TABLE 96. REST OF MEA FROZEN SHRIMP MARKET, BY APPLICATION, 2022-2032 ($MILLION)
- TABLE 97. REST OF MEA FROZEN SHRIMP MARKET, BY SOURCE, 2022-2032 ($MILLION)
- TABLE 98. REST OF MEA FROZEN SHRIMP MARKET, BY DISTRIBUTION CHANNEL, 2022-2032 ($MILLION)
- TABLE 99. SEAPAK SHRIMP COMPANY: KEY EXECUTIVES
- TABLE 100. SEAPAK SHRIMP COMPANY: COMPANY SNAPSHOT
- TABLE 101. SEAPAK SHRIMP COMPANY: PRODUCT SEGMENTS
- TABLE 102. SEAPAK SHRIMP COMPANY: SERVICE SEGMENTS
- TABLE 103. SEAPAK SHRIMP COMPANY: PRODUCT PORTFOLIO
- TABLE 104. SEAPAK SHRIMP COMPANY: KEY STRATERGIES
- TABLE 105. TOYO SUISAN KAISHA: KEY EXECUTIVES
- TABLE 106. TOYO SUISAN KAISHA: COMPANY SNAPSHOT
- TABLE 107. TOYO SUISAN KAISHA: PRODUCT SEGMENTS
- TABLE 108. TOYO SUISAN KAISHA: SERVICE SEGMENTS
- TABLE 109. TOYO SUISAN KAISHA: PRODUCT PORTFOLIO
- TABLE 110. TOYO SUISAN KAISHA: KEY STRATERGIES
- TABLE 111. HIGH LINER FOODS: KEY EXECUTIVES
- TABLE 112. HIGH LINER FOODS: COMPANY SNAPSHOT
- TABLE 113. HIGH LINER FOODS: PRODUCT SEGMENTS
- TABLE 114. HIGH LINER FOODS: SERVICE SEGMENTS
- TABLE 115. HIGH LINER FOODS: PRODUCT PORTFOLIO
- TABLE 116. HIGH LINER FOODS: KEY STRATERGIES
- TABLE 117. AQUA STAR CORP.: KEY EXECUTIVES
- TABLE 118. AQUA STAR CORP.: COMPANY SNAPSHOT
- TABLE 119. AQUA STAR CORP.: PRODUCT SEGMENTS
- TABLE 120. AQUA STAR CORP.: SERVICE SEGMENTS
- TABLE 121. AQUA STAR CORP.: PRODUCT PORTFOLIO
- TABLE 122. AQUA STAR CORP.: KEY STRATERGIES
- TABLE 123. CLEARWATER SEAFOOD: KEY EXECUTIVES
- TABLE 124. CLEARWATER SEAFOOD: COMPANY SNAPSHOT
- TABLE 125. CLEARWATER SEAFOOD: PRODUCT SEGMENTS
- TABLE 126. CLEARWATER SEAFOOD: SERVICE SEGMENTS
- TABLE 127. CLEARWATER SEAFOOD: PRODUCT PORTFOLIO
- TABLE 128. CLEARWATER SEAFOOD: KEY STRATERGIES
- TABLE 129. SURAPON FOODS: KEY EXECUTIVES
- TABLE 130. SURAPON FOODS: COMPANY SNAPSHOT
- TABLE 131. SURAPON FOODS: PRODUCT SEGMENTS
- TABLE 132. SURAPON FOODS: SERVICE SEGMENTS
- TABLE 133. SURAPON FOODS: PRODUCT PORTFOLIO
- TABLE 134. SURAPON FOODS: KEY STRATERGIES
- TABLE 135. AQUA CHILE: KEY EXECUTIVES
- TABLE 136. AQUA CHILE: COMPANY SNAPSHOT
- TABLE 137. AQUA CHILE: PRODUCT SEGMENTS
- TABLE 138. AQUA CHILE: SERVICE SEGMENTS
- TABLE 139. AQUA CHILE: PRODUCT PORTFOLIO
- TABLE 140. AQUA CHILE: KEY STRATERGIES
- TABLE 141. NORDIC SEAFOOD A/S: KEY EXECUTIVES
- TABLE 142. NORDIC SEAFOOD A/S: COMPANY SNAPSHOT
- TABLE 143. NORDIC SEAFOOD A/S: PRODUCT SEGMENTS
- TABLE 144. NORDIC SEAFOOD A/S: SERVICE SEGMENTS
- TABLE 145. NORDIC SEAFOOD A/S: PRODUCT PORTFOLIO
- TABLE 146. NORDIC SEAFOOD A/S: KEY STRATERGIES
- TABLE 147. SEAFOOD CO.: KEY EXECUTIVES
- TABLE 148. SEAFOOD CO.: COMPANY SNAPSHOT
- TABLE 149. SEAFOOD CO.: PRODUCT SEGMENTS
- TABLE 150. SEAFOOD CO.: SERVICE SEGMENTS
- TABLE 151. SEAFOOD CO.: PRODUCT PORTFOLIO
- TABLE 152. SEAFOOD CO.: KEY STRATERGIES
- TABLE 153. THAI UNION GROUP: KEY EXECUTIVES
- TABLE 154. THAI UNION GROUP: COMPANY SNAPSHOT
- TABLE 155. THAI UNION GROUP: PRODUCT SEGMENTS
- TABLE 156. THAI UNION GROUP: SERVICE SEGMENTS
- TABLE 157. THAI UNION GROUP: PRODUCT PORTFOLIO
- TABLE 158. THAI UNION GROUP: KEY STRATERGIES
LIST OF FIGURES
- FIGURE 01. FROZEN SHRIMP MARKET, 2022-2032
- FIGURE 02. SEGMENTATION OF FROZEN SHRIMP MARKET,2022-2032
- FIGURE 03. TOP IMPACTING FACTORS IN FROZEN SHRIMP MARKET
- FIGURE 04. TOP INVESTMENT POCKETS IN FROZEN SHRIMP MARKET (2023-2032)
- FIGURE 05. BARGAINING POWER OF SUPPLIERS
- FIGURE 06. BARGAINING POWER OF BUYERS
- FIGURE 07. THREAT OF SUBSTITUTION
- FIGURE 08. THREAT OF SUBSTITUTION
- FIGURE 09. COMPETITIVE RIVALRY
- FIGURE 10. GLOBAL FROZEN SHRIMP MARKET:DRIVERS, RESTRAINTS AND OPPORTUNITIES
- FIGURE 11. FROZEN SHRIMP MARKET, BY APPLICATION, 2022 AND 2032(%)
- FIGURE 12. COMPARATIVE SHARE ANALYSIS OF FROZEN SHRIMP MARKET FOR FOOD, BY COUNTRY 2022 AND 2032(%)
- FIGURE 13. COMPARATIVE SHARE ANALYSIS OF FROZEN SHRIMP MARKET FOR PHARMACEUTICALS, BY COUNTRY 2022 AND 2032(%)
- FIGURE 14. COMPARATIVE SHARE ANALYSIS OF FROZEN SHRIMP MARKET FOR COSMETICS, BY COUNTRY 2022 AND 2032(%)
- FIGURE 15. COMPARATIVE SHARE ANALYSIS OF FROZEN SHRIMP MARKET FOR INDUSTRIAL, BY COUNTRY 2022 AND 2032(%)
- FIGURE 16. COMPARATIVE SHARE ANALYSIS OF FROZEN SHRIMP MARKET FOR BIOTECHNOLOGY, BY COUNTRY 2022 AND 2032(%)
- FIGURE 17. FROZEN SHRIMP MARKET, BY SOURCE, 2022 AND 2032(%)
- FIGURE 18. COMPARATIVE SHARE ANALYSIS OF FROZEN SHRIMP MARKET FOR CONVENTIONAL, BY COUNTRY 2022 AND 2032(%)
- FIGURE 19. COMPARATIVE SHARE ANALYSIS OF FROZEN SHRIMP MARKET FOR ORGANIC, BY COUNTRY 2022 AND 2032(%)
- FIGURE 20. FROZEN SHRIMP MARKET, BY DISTRIBUTION CHANNEL, 2022 AND 2032(%)
- FIGURE 21. COMPARATIVE SHARE ANALYSIS OF FROZEN SHRIMP MARKET FOR SUPERMARKETS/HYPERMARKETS, BY COUNTRY 2022 AND 2032(%)
- FIGURE 22. COMPARATIVE SHARE ANALYSIS OF FROZEN SHRIMP MARKET FOR DEPARTMENTAL STORES, BY COUNTRY 2022 AND 2032(%)
- FIGURE 23. COMPARATIVE SHARE ANALYSIS OF FROZEN SHRIMP MARKET FOR B2B, BY COUNTRY 2022 AND 2032(%)
- FIGURE 24. COMPARATIVE SHARE ANALYSIS OF FROZEN SHRIMP MARKET FOR ONLINE SALES CHANNEL, BY COUNTRY 2022 AND 2032(%)
- FIGURE 25. FROZEN SHRIMP MARKET BY REGION, 2022 AND 2032(%)
- FIGURE 26. U.S. FROZEN SHRIMP MARKET, 2022-2032 ($MILLION)
- FIGURE 27. CANADA FROZEN SHRIMP MARKET, 2022-2032 ($MILLION)
- FIGURE 28. MEXICO FROZEN SHRIMP MARKET, 2022-2032 ($MILLION)
- FIGURE 29. GERMANY FROZEN SHRIMP MARKET, 2022-2032 ($MILLION)
- FIGURE 30. ITALY FROZEN SHRIMP MARKET, 2022-2032 ($MILLION)
- FIGURE 31. UK FROZEN SHRIMP MARKET, 2022-2032 ($MILLION)
- FIGURE 32. FRANCE FROZEN SHRIMP MARKET, 2022-2032 ($MILLION)
- FIGURE 33. SPAIN FROZEN SHRIMP MARKET, 2022-2032 ($MILLION)
- FIGURE 34. REST OF EUROPE FROZEN SHRIMP MARKET, 2022-2032 ($MILLION)
- FIGURE 35. CHINA FROZEN SHRIMP MARKET, 2022-2032 ($MILLION)
- FIGURE 36. INDIA FROZEN SHRIMP MARKET, 2022-2032 ($MILLION)
- FIGURE 37. JAPAN FROZEN SHRIMP MARKET, 2022-2032 ($MILLION)
- FIGURE 38. AUSTRALIA FROZEN SHRIMP MARKET, 2022-2032 ($MILLION)
- FIGURE 39. SOUTH KOREA FROZEN SHRIMP MARKET, 2022-2032 ($MILLION)
- FIGURE 40. REST OF ASIA-PACIFIC FROZEN SHRIMP MARKET, 2022-2032 ($MILLION)
- FIGURE 41. BRAZIL FROZEN SHRIMP MARKET, 2022-2032 ($MILLION)
- FIGURE 42. ARGENTINA FROZEN SHRIMP MARKET, 2022-2032 ($MILLION)
- FIGURE 43. REST OF LATIN AMERICA FROZEN SHRIMP MARKET, 2022-2032 ($MILLION)
- FIGURE 44. SOUTH AFRICA FROZEN SHRIMP MARKET, 2022-2032 ($MILLION)
- FIGURE 45. SAUDI ARABIA FROZEN SHRIMP MARKET, 2022-2032 ($MILLION)
- FIGURE 46. REST OF MEA FROZEN SHRIMP MARKET, 2022-2032 ($MILLION)
- FIGURE 47. TOP WINNING STRATEGIES, BY YEAR
- FIGURE 48. TOP WINNING STRATEGIES, BY DEVELOPMENT
- FIGURE 49. TOP WINNING STRATEGIES, BY COMPANY
- FIGURE 50. PRODUCT MAPPING OF TOP 10 PLAYERS
- FIGURE 51. COMPETITIVE DASHBOARD
- FIGURE 52. COMPETITIVE HEATMAP: FROZEN SHRIMP MARKET
- FIGURE 53. TOP PLAYER POSITIONING, 2022
The global frozen shrimp market was valued at $9.9 billion in 2022, and is projected to reach $21.9 billion by 2032, growing at a CAGR of 8.3% from 2023 to 2032. Frozen shrimp is a type of seafood that is harvested, processed, and then frozen to keep its freshness and flavor intact. The shrimp is quickly frozen at extremely low temperatures, often below -18°C (-0.4°F), to prevent bacterial growth and maintain its quality. This preservation technique enables consumers to store the shrimp for longer periods without affecting its taste or texture. Frozen shrimp is a worldwide popular seafood choice as it can be used in various cuisines, is readily available throughout the year, and retains its nutritional value. Furthermore, frozen shrimp undergoes strict quality control measures to ensure it is safe to eat.
The demand for frozen shrimp is on the rise due to the growing popularity of international cuisines. Shrimp is a versatile ingredient widely used in various global dishes, and as consumers become more adventurous in their culinary preferences, they are increasingly exploring cuisines from different parts of the world such as Thai, Chinese, Mexican, and Italian, among others. Shrimp is a key ingredient in many international dishes such as pad thai, shrimp tacos, shrimp fried rice, and shrimp scampi, which is driving the demand for frozen shrimp.
Furthermore, the convenience and availability of frozen shrimp make it easier for consumers to recreate international dishes at home. Frozen shrimp is readily accessible in supermarkets and grocery stores, enabling consumers to experiment with different recipes and flavors from around the world without the hassle of sourcing fresh seafood. As a result, the growing popularity of international cuisines is contributing to the surge in market demand for frozen shrimp as consumers seek to diversify their culinary experiences and enjoy the flavors of global cuisine in the comfort of their own homes.
The demand for frozen shrimp in the market is increasing due to the innovation in value-added shrimp products. These products offer consumers a wide range of convenient and attractive options by adding value to the shrimp. Value-added shrimp products include shrimp-based snacks, appetizers, ready-to-eat meals, and pre-marinated, seasoned, or pre-cooked shrimp. These products cater to busy lifestyles by providing quick and easy meal solutions without compromising on taste or quality. There is a diverse range of flavors and preparations available, such as garlic butter, coconut curry, or lemon herb, which cater to a broad audience seeking convenience and variety in their seafood choices.
Moreover, innovation in value-added shrimp products enhances the overall consumer experience by offering unique and novel culinary options. By introducing innovative packaging designs and flavor profiles, manufacturers can differentiate their products in the market and capture consumers' attention. Value-added shrimp products tap into emerging food trends, such as snacking and on-the-go eating, further expanding the market reach, and driving increased demand for frozen shrimp. As a result, the success of innovation in value-added shrimp products is fueling the growth of the frozen shrimp market by providing consumers with convenient, flavorful, and satisfying seafood options.
However, concerns about quality and taste compared to fresh shrimp act as a restraint on the market demand for frozen shrimp. Some consumers perceive frozen shrimp to be inferior in taste and texture compared to fresh shrimp. This perception stems from the belief that freezing can alter the natural flavor and texture of the shrimp, resulting in a less satisfying culinary experience. Additionally, there is a concern that frozen shrimp may not maintain its freshness and quality during the freezing and thawing process, leading to a loss of flavor and juiciness.
Furthermore, the availability of fresh shrimp in coastal regions or seafood markets may deter consumers from opting for frozen shrimp. Consumers often associate fresh seafood with higher quality and superior taste, leading them to prefer fresh shrimp over frozen alternatives. Despite advancements in freezing and packaging technologies to preserve the quality of frozen shrimp, these concerns persist among certain segments of consumers, limiting the market demand for frozen shrimp. As a result, addressing these perceptions and educating consumers about the benefits and quality of frozen shrimp is essential to overcome this restraint and drive market growth.
The frozen shrimp market is segmented into application, source, distribution channel, and region. By application, the market is classified into food, pharmaceuticals, cosmetics, industrial, and biotechnology. By source, the market is divided into organic and conventional. As per distribution channel, the market is segregated into supermarkets-hypermarkets, departmental stores, B2B, and online sales channel. Region wise, the market is analyzed across North America, Europe, Asia-Pacific, LA, and MEA.
Major players such as SeaPak Shrimp Company, Toyo Suisan Kaisha, High Liner Foods, and Aqua Star Corp. have adopted product approval, partnership, agreement, and acquisition as key developmental strategies to improve the product portfolio of the frozen shrimp market.
Key Benefits for Stakeholders
- This report provides a quantitative analysis of the market segments, current trends, estimations, and dynamics of the frozen shrimp market analysis from 2022 to 2032 to identify the prevailing frozen shrimp market opportunities.
- The market research is offered along with information related to key drivers, restraints, and opportunities.
- Porter's five forces analysis highlights the potency of buyers and suppliers to enable stakeholders make profit-oriented business decisions and strengthen their supplier-buyer network.
- In-depth analysis of the frozen shrimp market segmentation assists to determine the prevailing market opportunities.
- Major countries in each region are mapped according to their revenue contribution to the global market.
- Market player positioning facilitates benchmarking and provides a clear understanding of the present position of the market players.
- The report includes the analysis of the regional as well as global frozen shrimp market trends, key players, market segments, application areas, and market growth strategies.
Additional benefits you will get with this purchase are:
- Quarterly Update and* (only available with a corporate license, on listed price)
- 5 additional Company Profile of client Choice pre- or Post-purchase, as a free update.
- Free Upcoming Version on the Purchase of Five and Enterprise User License.
- 16 analyst hours of support* (post-purchase, if you find additional data requirements upon review of the report, you may receive support amounting to 16 analyst hours to solve questions, and post-sale queries)
- 15% Free Customization* (in case the scope or segment of the report does not match your requirements, 15% is equivalent to 3 working days of free work, applicable once)
- Free data Pack on the Five and Enterprise User License. (Excel version of the report)
- Free Updated report if the report is 6-12 months old or older.
- 24-hour priority response*
- Free Industry updates and white papers.
Possible Customization with this report (with additional cost and timeline, please talk to the sales executive to know more)
- End user preferences and pain points
- Market share analysis of players by products/segments
- Additional company profiles with specific to client's interest
- Additional country or region analysis- market size and forecast
- Average Selling Price Analysis / Price Point Analysis
- Brands Share Analysis
- Criss-cross segment analysis- market size and forecast
- Historic market data
- Key player details (including location, contact details, supplier/vendor network etc. in excel format)
Key Market Segments
By Application
- Food
- Pharmaceuticals
- Cosmetics
- Industrial
- Biotechnology
By Source
- Conventional
- Organic
By Distribution Channel
- Supermarkets/Hypermarkets
- Departmental Stores
- B2B
- Online Sales Channel
By Region
- North America
- U.S.
- Canada
- Mexico
- Europe
- Germany
- Italy
- UK
- France
- Spain
- Rest of Europe
- Asia-Pacific
- China
- India
- Japan
- Australia
- South Korea
- Rest of Asia-Pacific
- Latin America
- Brazil
- Argentina
- Rest of Latin America
- Middle East and North Africa
- South Africa
- Saudi Arabia
- Rest Of Mea
Key Market Players:
- SeaPak Shrimp Company
- Toyo Suisan Kaisha
- High Liner Foods
- Aqua Star Corp.
- Clearwater Seafood
- Surapon Foods
- Aqua Chile
- Nordic Seafood A/S
- Seafood Co.
- Thai Union Group
TABLE OF CONTENTS
CHAPTER 1: INTRODUCTION
- 1.1. Report description
- 1.2. Key market segments
- 1.3. Key benefits to the stakeholders
- 1.4. Research methodology
- 1.4.1. Primary research
- 1.4.2. Secondary research
- 1.4.3. Analyst tools and models
CHAPTER 2: EXECUTIVE SUMMARY
- 2.1. CXO perspective
CHAPTER 3: MARKET OVERVIEW
- 3.1. Market definition and scope
- 3.2. Key findings
- 3.2.1. Top impacting factors
- 3.2.2. Top investment pockets
- 3.3. Porter's five forces analysis
- 3.4. Market dynamics
- 3.4.1. Drivers
- 3.4.2. Restraints
- 3.4.3. Opportunities
- 3.5. Market Share Analysis
- 3.6. Brand Share Analysis
- 3.7. Value Chain Analysis
- 3.8. Key Players Details
CHAPTER 4: FROZEN SHRIMP MARKET, BY APPLICATION
- 4.1. Overview
- 4.1.1. Market size and forecast
- 4.2. Food
- 4.2.1. Key market trends, growth factors and opportunities
- 4.2.2. Market size and forecast, by region
- 4.2.3. Market share analysis by country
- 4.3. Pharmaceuticals
- 4.3.1. Key market trends, growth factors and opportunities
- 4.3.2. Market size and forecast, by region
- 4.3.3. Market share analysis by country
- 4.4. Cosmetics
- 4.4.1. Key market trends, growth factors and opportunities
- 4.4.2. Market size and forecast, by region
- 4.4.3. Market share analysis by country
- 4.5. Industrial
- 4.5.1. Key market trends, growth factors and opportunities
- 4.5.2. Market size and forecast, by region
- 4.5.3. Market share analysis by country
- 4.6. Biotechnology
- 4.6.1. Key market trends, growth factors and opportunities
- 4.6.2. Market size and forecast, by region
- 4.6.3. Market share analysis by country
CHAPTER 5: FROZEN SHRIMP MARKET, BY SOURCE
- 5.1. Overview
- 5.1.1. Market size and forecast
- 5.2. Conventional
- 5.2.1. Key market trends, growth factors and opportunities
- 5.2.2. Market size and forecast, by region
- 5.2.3. Market share analysis by country
- 5.3. Organic
- 5.3.1. Key market trends, growth factors and opportunities
- 5.3.2. Market size and forecast, by region
- 5.3.3. Market share analysis by country
CHAPTER 6: FROZEN SHRIMP MARKET, BY DISTRIBUTION CHANNEL
- 6.1. Overview
- 6.1.1. Market size and forecast
- 6.2. Supermarkets/Hypermarkets
- 6.2.1. Key market trends, growth factors and opportunities
- 6.2.2. Market size and forecast, by region
- 6.2.3. Market share analysis by country
- 6.3. Departmental Stores
- 6.3.1. Key market trends, growth factors and opportunities
- 6.3.2. Market size and forecast, by region
- 6.3.3. Market share analysis by country
- 6.4. B2B
- 6.4.1. Key market trends, growth factors and opportunities
- 6.4.2. Market size and forecast, by region
- 6.4.3. Market share analysis by country
- 6.5. Online Sales Channel
- 6.5.1. Key market trends, growth factors and opportunities
- 6.5.2. Market size and forecast, by region
- 6.5.3. Market share analysis by country
CHAPTER 7: FROZEN SHRIMP MARKET, BY REGION
- 7.1. Overview
- 7.1.1. Market size and forecast By Region
- 7.2. North America
- 7.2.1. Key market trends, growth factors and opportunities
- 7.2.2. Market size and forecast, by Application
- 7.2.3. Market size and forecast, by Source
- 7.2.4. Market size and forecast, by Distribution Channel
- 7.2.5. Market size and forecast, by country
- 7.2.5.1. U.S.
- 7.2.5.1.1. Market size and forecast, by Application
- 7.2.5.1.2. Market size and forecast, by Source
- 7.2.5.1.3. Market size and forecast, by Distribution Channel
- 7.2.5.2. Canada
- 7.2.5.2.1. Market size and forecast, by Application
- 7.2.5.2.2. Market size and forecast, by Source
- 7.2.5.2.3. Market size and forecast, by Distribution Channel
- 7.2.5.3. Mexico
- 7.2.5.3.1. Market size and forecast, by Application
- 7.2.5.3.2. Market size and forecast, by Source
- 7.2.5.3.3. Market size and forecast, by Distribution Channel
- 7.3. Europe
- 7.3.1. Key market trends, growth factors and opportunities
- 7.3.2. Market size and forecast, by Application
- 7.3.3. Market size and forecast, by Source
- 7.3.4. Market size and forecast, by Distribution Channel
- 7.3.5. Market size and forecast, by country
- 7.3.5.1. Germany
- 7.3.5.1.1. Market size and forecast, by Application
- 7.3.5.1.2. Market size and forecast, by Source
- 7.3.5.1.3. Market size and forecast, by Distribution Channel
- 7.3.5.2. Italy
- 7.3.5.2.1. Market size and forecast, by Application
- 7.3.5.2.2. Market size and forecast, by Source
- 7.3.5.2.3. Market size and forecast, by Distribution Channel
- 7.3.5.3. UK
- 7.3.5.3.1. Market size and forecast, by Application
- 7.3.5.3.2. Market size and forecast, by Source
- 7.3.5.3.3. Market size and forecast, by Distribution Channel
- 7.3.5.4. France
- 7.3.5.4.1. Market size and forecast, by Application
- 7.3.5.4.2. Market size and forecast, by Source
- 7.3.5.4.3. Market size and forecast, by Distribution Channel
- 7.3.5.5. Spain
- 7.3.5.5.1. Market size and forecast, by Application
- 7.3.5.5.2. Market size and forecast, by Source
- 7.3.5.5.3. Market size and forecast, by Distribution Channel
- 7.3.5.6. Rest of Europe
- 7.3.5.6.1. Market size and forecast, by Application
- 7.3.5.6.2. Market size and forecast, by Source
- 7.3.5.6.3. Market size and forecast, by Distribution Channel
- 7.4. Asia-Pacific
- 7.4.1. Key market trends, growth factors and opportunities
- 7.4.2. Market size and forecast, by Application
- 7.4.3. Market size and forecast, by Source
- 7.4.4. Market size and forecast, by Distribution Channel
- 7.4.5. Market size and forecast, by country
- 7.4.5.1. China
- 7.4.5.1.1. Market size and forecast, by Application
- 7.4.5.1.2. Market size and forecast, by Source
- 7.4.5.1.3. Market size and forecast, by Distribution Channel
- 7.4.5.2. India
- 7.4.5.2.1. Market size and forecast, by Application
- 7.4.5.2.2. Market size and forecast, by Source
- 7.4.5.2.3. Market size and forecast, by Distribution Channel
- 7.4.5.3. Japan
- 7.4.5.3.1. Market size and forecast, by Application
- 7.4.5.3.2. Market size and forecast, by Source
- 7.4.5.3.3. Market size and forecast, by Distribution Channel
- 7.4.5.4. Australia
- 7.4.5.4.1. Market size and forecast, by Application
- 7.4.5.4.2. Market size and forecast, by Source
- 7.4.5.4.3. Market size and forecast, by Distribution Channel
- 7.4.5.5. South Korea
- 7.4.5.5.1. Market size and forecast, by Application
- 7.4.5.5.2. Market size and forecast, by Source
- 7.4.5.5.3. Market size and forecast, by Distribution Channel
- 7.4.5.6. Rest of Asia-Pacific
- 7.4.5.6.1. Market size and forecast, by Application
- 7.4.5.6.2. Market size and forecast, by Source
- 7.4.5.6.3. Market size and forecast, by Distribution Channel
- 7.5. Latin America
- 7.5.1. Key market trends, growth factors and opportunities
- 7.5.2. Market size and forecast, by Application
- 7.5.3. Market size and forecast, by Source
- 7.5.4. Market size and forecast, by Distribution Channel
- 7.5.5. Market size and forecast, by country
- 7.5.5.1. Brazil
- 7.5.5.1.1. Market size and forecast, by Application
- 7.5.5.1.2. Market size and forecast, by Source
- 7.5.5.1.3. Market size and forecast, by Distribution Channel
- 7.5.5.2. Argentina
- 7.5.5.2.1. Market size and forecast, by Application
- 7.5.5.2.2. Market size and forecast, by Source
- 7.5.5.2.3. Market size and forecast, by Distribution Channel
- 7.5.5.3. Rest of Latin America
- 7.5.5.3.1. Market size and forecast, by Application
- 7.5.5.3.2. Market size and forecast, by Source
- 7.5.5.3.3. Market size and forecast, by Distribution Channel
- 7.6. Middle East and North Africa
- 7.6.1. Key market trends, growth factors and opportunities
- 7.6.2. Market size and forecast, by Application
- 7.6.3. Market size and forecast, by Source
- 7.6.4. Market size and forecast, by Distribution Channel
- 7.6.5. Market size and forecast, by country
- 7.6.5.1. South Africa
- 7.6.5.1.1. Market size and forecast, by Application
- 7.6.5.1.2. Market size and forecast, by Source
- 7.6.5.1.3. Market size and forecast, by Distribution Channel
- 7.6.5.2. Saudi Arabia
- 7.6.5.2.1. Market size and forecast, by Application
- 7.6.5.2.2. Market size and forecast, by Source
- 7.6.5.2.3. Market size and forecast, by Distribution Channel
- 7.6.5.3. Rest Of Mea
- 7.6.5.3.1. Market size and forecast, by Application
- 7.6.5.3.2. Market size and forecast, by Source
- 7.6.5.3.3. Market size and forecast, by Distribution Channel
CHAPTER 8: COMPETITIVE LANDSCAPE
- 8.1. Introduction
- 8.2. Top winning strategies
- 8.3. Product mapping of top 10 player
- 8.4. Competitive dashboard
- 8.5. Competitive heatmap
- 8.6. Top player positioning, 2022
CHAPTER 9: COMPANY PROFILES
- 9.1. SeaPak Shrimp Company
- 9.1.1. Company overview
- 9.1.2. Key executives
- 9.1.3. Company snapshot
- 9.1.4. Operating business segments
- 9.1.5. Product portfolio
- 9.1.6. Business performance
- 9.1.7. Key strategic moves and developments
- 9.2. Toyo Suisan Kaisha
- 9.2.1. Company overview
- 9.2.2. Key executives
- 9.2.3. Company snapshot
- 9.2.4. Operating business segments
- 9.2.5. Product portfolio
- 9.2.6. Business performance
- 9.2.7. Key strategic moves and developments
- 9.3. High Liner Foods
- 9.3.1. Company overview
- 9.3.2. Key executives
- 9.3.3. Company snapshot
- 9.3.4. Operating business segments
- 9.3.5. Product portfolio
- 9.3.6. Business performance
- 9.3.7. Key strategic moves and developments
- 9.4. Aqua Star Corp.
- 9.4.1. Company overview
- 9.4.2. Key executives
- 9.4.3. Company snapshot
- 9.4.4. Operating business segments
- 9.4.5. Product portfolio
- 9.4.6. Business performance
- 9.4.7. Key strategic moves and developments
- 9.5. Clearwater Seafood
- 9.5.1. Company overview
- 9.5.2. Key executives
- 9.5.3. Company snapshot
- 9.5.4. Operating business segments
- 9.5.5. Product portfolio
- 9.5.6. Business performance
- 9.5.7. Key strategic moves and developments
- 9.6. Surapon Foods
- 9.6.1. Company overview
- 9.6.2. Key executives
- 9.6.3. Company snapshot
- 9.6.4. Operating business segments
- 9.6.5. Product portfolio
- 9.6.6. Business performance
- 9.6.7. Key strategic moves and developments
- 9.7. Aqua Chile
- 9.7.1. Company overview
- 9.7.2. Key executives
- 9.7.3. Company snapshot
- 9.7.4. Operating business segments
- 9.7.5. Product portfolio
- 9.7.6. Business performance
- 9.7.7. Key strategic moves and developments
- 9.8. Nordic Seafood A/S
- 9.8.1. Company overview
- 9.8.2. Key executives
- 9.8.3. Company snapshot
- 9.8.4. Operating business segments
- 9.8.5. Product portfolio
- 9.8.6. Business performance
- 9.8.7. Key strategic moves and developments
- 9.9. Seafood Co.
- 9.9.1. Company overview
- 9.9.2. Key executives
- 9.9.3. Company snapshot
- 9.9.4. Operating business segments
- 9.9.5. Product portfolio
- 9.9.6. Business performance
- 9.9.7. Key strategic moves and developments
- 9.10. Thai Union Group
- 9.10.1. Company overview
- 9.10.2. Key executives
- 9.10.3. Company snapshot
- 9.10.4. Operating business segments
- 9.10.5. Product portfolio
- 9.10.6. Business performance
- 9.10.7. Key strategic moves and developments
