
|
市場調査レポート
商品コード
1414948
エアフライヤー市場:エンドユーザー別、流通チャネル別:世界の機会分析と産業予測 2023-2032年Air Fryer Market By End User (Residential, Commercial), By Distribution Channel (Hypermarkets/Supermarkets, Specialty Stores, Online Channel): Global Opportunity Analysis and Industry Forecast, 2023-2032 |
||||||
|
|||||||

| エアフライヤー市場:エンドユーザー別、流通チャネル別:世界の機会分析と産業予測 2023-2032年 |
|
出版日: 2023年11月30日
発行: Allied Market Research
ページ情報: 英文 200 Pages
納期: 2~3営業日
|

- 全表示
- 概要
- 図表
- 目次
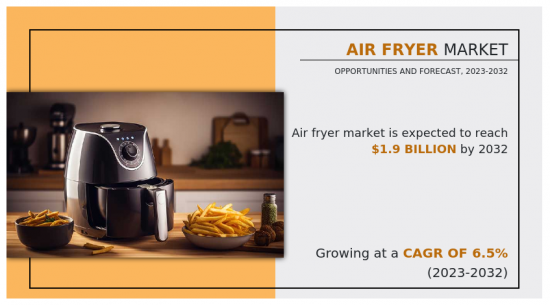
エアフライヤー市場の2022年の市場規模は10億米ドルで、2032年には19億米ドルに達し、2023年から2032年までのCAGRは6.5%で成長すると予測されています。
エアフライヤーは、熱風を周囲に流して調理する厨房機器です。対流技術を利用し、従来のフライ技術に似たサクサクとした食感の皮膜を外側に作りますが、油脂の使用量は大幅に少ないです。この器具は、加熱部と送風機を備えた小型のカウンタートップ製品です。客はフライヤー内の換気されたバスケットや皿の上に食事を置くと、熱風が素早く食品の周りを流れ、均一に揚げられ、カリッとした食感が得られます。エアフライヤーは、ほんのわずかな油を使うだけで、伝統的な揚げ物をヘルシーに仕上げることができるため、大きな人気を博しています。
この画期的な調理技術に伴うアクリルアミド生成の脅威の大幅な低減が、エアフライヤー市場成長の主要な促進要因です。アクリルアミドは潜在的に危険な化学化合物であり、高温調理法中に発生します。
揚げ物は、健康志向の消費者にとって大きな関心事となっています。エアフライヤーは、食品を油に浸す代わりに急速熱風循環方式を採用するため、最終製品としてのアクリルアミドの生成を抑えることができます。アクリルアミドレベルの低減は、健康関連の懸念を解消するだけでなく、安全で健康的な食生活を奨励する大規模な取り組みにも対応しています。多くの消費者が従来の揚げ物調理に伴う危険性を認識するようになり、健康的な調理法としてのエアフライヤーの魅力が高まっています。市場の成長は、おいしさと簡便さを提供し、健康リスクを最小限に抑えることに積極的なキッチン機器への意図的な動きを反映しており、その結果、より安全で健康志向の料理体験を求める個人の間で、エアフライヤーが好ましい選択肢として定着しています。
しかし、偽造品がエアフライヤー市場拡大の主な抑制要因として浮上しています。エアフライヤーの人気上昇に伴い、模倣品や規格外品の数が市場で増加しています。これらの模倣品は、外観は有名ブランドによく似ているが、品質、安全機能、効率基準は純正品に欠けています。模倣品を購入した消費者は、不注意にも劣悪な調理結果、安全性の懸念、製品寿命の短さに直面し、それゆえ市場の絶望と不信につながります。模倣品の存在は、既存企業の評判を落とすだけでなく、消費者の安全を脅かします。さらに、製品の正当性や信頼性に対する懸念から、顧客がフライヤーへの投資を控えるような曖昧な雰囲気を作り出しています。従って、偽造品の氾濫は、消費者の信頼を弱め、市場全体の拡大を阻害することで、成長阻害要因として働きます。
逆に、eコマース販売チャネルの拡大は、エアフライヤー市場にとって繁栄の好機となります。オンラインショッピングプラットフォームの人気が高まり、消費者の購買習慣が一変しました。さらに、eコマース・プラットフォームは、消費者が機能を評価し、レビューを読み、自分の要件に合った最高のエアフライヤー・モデルについて適切な決定を下すことができる、広範で多様な市場を提供しています。メーカー各社は、インターネット小売の場を通じて世界中の消費者と交流し、従来の実店舗の枠を超えて市場での存在感を高めています。さらに、オンライン取引の簡便さは、戸口配送オプションとともに顧客の利便性を高め、それによってエアフライヤーの販売に有利な雰囲気を作り出しています。加えて、eコマース・プラットフォームがインセンティブ、割引、パッケージ販売などを提供することで、消費者の関心が高まり、販売が促進されます。eコマース・チャネルは、革新的で成長する市場拡大の手段として、eフライヤー業界は有利な立場にあります。
目次
第1章 イントロダクション
第2章 エグゼクティブサマリー
第3章 市場概要
- 市場の定義と範囲
- 主な調査結果
- 影響要因
- 主な投資機会
- ポーターのファイブフォース分析
- 市場力学
- 促進要因
- 便利で時間の節約になる機能
- 健康とウェルネスに対する意識の高まり
- 肥満に対する懸念の高まり
- 抑制要因
- 調理能力の制限
- エアフライヤーの高価格
- 機会
- スマート技術によるエアフライヤーの統合
- 促進要因
第4章 エンドユーザー別エアフライヤー市場
- 概要
- 住宅用
- 業務用
第5章 エアフライヤー市場:流通チャネル別
- 概要
- ハイパーマーケット/スーパーマーケット
- 専門店
- オンラインチャネル
第6章 エアフライヤー市場:地域別
- 概要
- 北米
- 米国
- カナダ
- メキシコ
- 欧州
- 英国
- ドイツ
- ベネルクス
- イタリア
- スペイン
- その他
- アジア太平洋
- 中国
- インド
- 日本
- 韓国
- その他
- ラテンアメリカ
- ラテンアメリカ
- 中東
- アフリカ
第7章 競合情勢
- イントロダクション
- 主要成功戦略
- 主要10社の製品マッピング
- 競合ダッシュボード
- 競合ヒートマップ
- 主要企業のポジショニング(2022年)
第8章 企業プロファイル
- Kent RO Systems Ltd.
- Newell Brands Inc.
- Koninklijke Philips N.V.
- TTK Prestige Limited
- Havells India Ltd.
- Taurus Group
- NuWave, LLC
- Arovast Corporation
- Wonderchef Home Appliances Pvt. Ltd.
- GoWISE USA
LIST OF TABLES
- TABLE 01. GLOBAL AIR FRYER MARKET, BY END USER, 2022-2032 ($MILLION)
- TABLE 02. AIR FRYER MARKET FOR RESIDENTIAL, BY REGION, 2022-2032 ($MILLION)
- TABLE 03. AIR FRYER MARKET FOR COMMERCIAL, BY REGION, 2022-2032 ($MILLION)
- TABLE 04. GLOBAL AIR FRYER MARKET, BY DISTRIBUTION CHANNEL, 2022-2032 ($MILLION)
- TABLE 05. AIR FRYER MARKET FOR HYPERMARKETS/SUPERMARKETS, BY REGION, 2022-2032 ($MILLION)
- TABLE 06. AIR FRYER MARKET FOR SPECIALTY STORES, BY REGION, 2022-2032 ($MILLION)
- TABLE 07. AIR FRYER MARKET FOR ONLINE CHANNEL, BY REGION, 2022-2032 ($MILLION)
- TABLE 08. AIR FRYER MARKET, BY REGION, 2022-2032 ($MILLION)
- TABLE 09. NORTH AMERICA AIR FRYER MARKET, BY END USER, 2022-2032 ($MILLION)
- TABLE 10. NORTH AMERICA AIR FRYER MARKET, BY DISTRIBUTION CHANNEL, 2022-2032 ($MILLION)
- TABLE 11. NORTH AMERICA AIR FRYER MARKET, BY COUNTRY, 2022-2032 ($MILLION)
- TABLE 12. U.S. AIR FRYER MARKET, BY END USER, 2022-2032 ($MILLION)
- TABLE 13. U.S. AIR FRYER MARKET, BY DISTRIBUTION CHANNEL, 2022-2032 ($MILLION)
- TABLE 14. CANADA AIR FRYER MARKET, BY END USER, 2022-2032 ($MILLION)
- TABLE 15. CANADA AIR FRYER MARKET, BY DISTRIBUTION CHANNEL, 2022-2032 ($MILLION)
- TABLE 16. MEXICO AIR FRYER MARKET, BY END USER, 2022-2032 ($MILLION)
- TABLE 17. MEXICO AIR FRYER MARKET, BY DISTRIBUTION CHANNEL, 2022-2032 ($MILLION)
- TABLE 18. EUROPE AIR FRYER MARKET, BY END USER, 2022-2032 ($MILLION)
- TABLE 19. EUROPE AIR FRYER MARKET, BY DISTRIBUTION CHANNEL, 2022-2032 ($MILLION)
- TABLE 20. EUROPE AIR FRYER MARKET, BY COUNTRY, 2022-2032 ($MILLION)
- TABLE 21. UK AIR FRYER MARKET, BY END USER, 2022-2032 ($MILLION)
- TABLE 22. UK AIR FRYER MARKET, BY DISTRIBUTION CHANNEL, 2022-2032 ($MILLION)
- TABLE 23. GERMANY AIR FRYER MARKET, BY END USER, 2022-2032 ($MILLION)
- TABLE 24. GERMANY AIR FRYER MARKET, BY DISTRIBUTION CHANNEL, 2022-2032 ($MILLION)
- TABLE 25. BENELUX AIR FRYER MARKET, BY END USER, 2022-2032 ($MILLION)
- TABLE 26. BENELUX AIR FRYER MARKET, BY DISTRIBUTION CHANNEL, 2022-2032 ($MILLION)
- TABLE 27. ITALY AIR FRYER MARKET, BY END USER, 2022-2032 ($MILLION)
- TABLE 28. ITALY AIR FRYER MARKET, BY DISTRIBUTION CHANNEL, 2022-2032 ($MILLION)
- TABLE 29. SPAIN AIR FRYER MARKET, BY END USER, 2022-2032 ($MILLION)
- TABLE 30. SPAIN AIR FRYER MARKET, BY DISTRIBUTION CHANNEL, 2022-2032 ($MILLION)
- TABLE 31. REST OF EUROPE AIR FRYER MARKET, BY END USER, 2022-2032 ($MILLION)
- TABLE 32. REST OF EUROPE AIR FRYER MARKET, BY DISTRIBUTION CHANNEL, 2022-2032 ($MILLION)
- TABLE 33. ASIA-PACIFIC AIR FRYER MARKET, BY END USER, 2022-2032 ($MILLION)
- TABLE 34. ASIA-PACIFIC AIR FRYER MARKET, BY DISTRIBUTION CHANNEL, 2022-2032 ($MILLION)
- TABLE 35. ASIA-PACIFIC AIR FRYER MARKET, BY COUNTRY, 2022-2032 ($MILLION)
- TABLE 36. CHINA AIR FRYER MARKET, BY END USER, 2022-2032 ($MILLION)
- TABLE 37. CHINA AIR FRYER MARKET, BY DISTRIBUTION CHANNEL, 2022-2032 ($MILLION)
- TABLE 38. INDIA AIR FRYER MARKET, BY END USER, 2022-2032 ($MILLION)
- TABLE 39. INDIA AIR FRYER MARKET, BY DISTRIBUTION CHANNEL, 2022-2032 ($MILLION)
- TABLE 40. JAPAN AIR FRYER MARKET, BY END USER, 2022-2032 ($MILLION)
- TABLE 41. JAPAN AIR FRYER MARKET, BY DISTRIBUTION CHANNEL, 2022-2032 ($MILLION)
- TABLE 42. SOUTH KOREA AIR FRYER MARKET, BY END USER, 2022-2032 ($MILLION)
- TABLE 43. SOUTH KOREA AIR FRYER MARKET, BY DISTRIBUTION CHANNEL, 2022-2032 ($MILLION)
- TABLE 44. REST OF ASIA-PACIFIC AIR FRYER MARKET, BY END USER, 2022-2032 ($MILLION)
- TABLE 45. REST OF ASIA-PACIFIC AIR FRYER MARKET, BY DISTRIBUTION CHANNEL, 2022-2032 ($MILLION)
- TABLE 46. LAMEA AIR FRYER MARKET, BY END USER, 2022-2032 ($MILLION)
- TABLE 47. LAMEA AIR FRYER MARKET, BY DISTRIBUTION CHANNEL, 2022-2032 ($MILLION)
- TABLE 48. LAMEA AIR FRYER MARKET, BY COUNTRY, 2022-2032 ($MILLION)
- TABLE 49. LATIN AMERICA AIR FRYER MARKET, BY END USER, 2022-2032 ($MILLION)
- TABLE 50. LATIN AMERICA AIR FRYER MARKET, BY DISTRIBUTION CHANNEL, 2022-2032 ($MILLION)
- TABLE 51. MIDDLE EAST AIR FRYER MARKET, BY END USER, 2022-2032 ($MILLION)
- TABLE 52. MIDDLE EAST AIR FRYER MARKET, BY DISTRIBUTION CHANNEL, 2022-2032 ($MILLION)
- TABLE 53. AFRICA AIR FRYER MARKET, BY END USER, 2022-2032 ($MILLION)
- TABLE 54. AFRICA AIR FRYER MARKET, BY DISTRIBUTION CHANNEL, 2022-2032 ($MILLION)
- TABLE 55. KENT RO SYSTEMS LTD.: KEY EXECUTIVES
- TABLE 56. KENT RO SYSTEMS LTD.: COMPANY SNAPSHOT
- TABLE 57. KENT RO SYSTEMS LTD.: PRODUCT SEGMENTS
- TABLE 58. KENT RO SYSTEMS LTD.: PRODUCT PORTFOLIO
- TABLE 59. NEWELL BRANDS INC.: KEY EXECUTIVES
- TABLE 60. NEWELL BRANDS INC.: COMPANY SNAPSHOT
- TABLE 61. NEWELL BRANDS INC.: PRODUCT SEGMENTS
- TABLE 62. NEWELL BRANDS INC.: PRODUCT PORTFOLIO
- TABLE 63. KONINKLIJKE PHILIPS N.V.: KEY EXECUTIVES
- TABLE 64. KONINKLIJKE PHILIPS N.V.: COMPANY SNAPSHOT
- TABLE 65. KONINKLIJKE PHILIPS N.V.: PRODUCT SEGMENTS
- TABLE 66. KONINKLIJKE PHILIPS N.V.: PRODUCT PORTFOLIO
- TABLE 67. TTK PRESTIGE LIMITED: KEY EXECUTIVES
- TABLE 68. TTK PRESTIGE LIMITED: COMPANY SNAPSHOT
- TABLE 69. TTK PRESTIGE LIMITED: PRODUCT SEGMENTS
- TABLE 70. TTK PRESTIGE LIMITED: PRODUCT PORTFOLIO
- TABLE 71. TTK PRESTIGE LIMITED: KEY STRATERGIES
- TABLE 72. HAVELLS INDIA LTD.: KEY EXECUTIVES
- TABLE 73. HAVELLS INDIA LTD.: COMPANY SNAPSHOT
- TABLE 74. HAVELLS INDIA LTD.: PRODUCT SEGMENTS
- TABLE 75. HAVELLS INDIA LTD.: PRODUCT PORTFOLIO
- TABLE 76. TAURUS GROUP: KEY EXECUTIVES
- TABLE 77. TAURUS GROUP: COMPANY SNAPSHOT
- TABLE 78. TAURUS GROUP: PRODUCT SEGMENTS
- TABLE 79. TAURUS GROUP: PRODUCT PORTFOLIO
- TABLE 80. TAURUS GROUP: KEY STRATERGIES
- TABLE 81. NUWAVE, LLC: KEY EXECUTIVES
- TABLE 82. NUWAVE, LLC: COMPANY SNAPSHOT
- TABLE 83. NUWAVE, LLC: PRODUCT SEGMENTS
- TABLE 84. NUWAVE, LLC: PRODUCT PORTFOLIO
- TABLE 85. AROVAST CORPORATION: KEY EXECUTIVES
- TABLE 86. AROVAST CORPORATION: COMPANY SNAPSHOT
- TABLE 87. AROVAST CORPORATION: PRODUCT SEGMENTS
- TABLE 88. AROVAST CORPORATION: PRODUCT PORTFOLIO
- TABLE 89. WONDERCHEF HOME APPLIANCES PVT. LTD.: KEY EXECUTIVES
- TABLE 90. WONDERCHEF HOME APPLIANCES PVT. LTD.: COMPANY SNAPSHOT
- TABLE 91. WONDERCHEF HOME APPLIANCES PVT. LTD.: PRODUCT SEGMENTS
- TABLE 92. WONDERCHEF HOME APPLIANCES PVT. LTD.: PRODUCT PORTFOLIO
- TABLE 93. WONDERCHEF HOME APPLIANCES PVT. LTD.: KEY STRATERGIES
- TABLE 94. GOWISE USA: KEY EXECUTIVES
- TABLE 95. GOWISE USA: COMPANY SNAPSHOT
- TABLE 96. GOWISE USA: PRODUCT SEGMENTS
- TABLE 97. GOWISE USA: PRODUCT PORTFOLIO
LIST OF FIGURES
- FIGURE 01. AIR FRYER MARKET, 2022-2032
- FIGURE 02. SEGMENTATION OF AIR FRYER MARKET,2022-2032
- FIGURE 03. TOP IMPACTING FACTORS IN AIR FRYER MARKET (2022 TO 2032)
- FIGURE 04. TOP INVESTMENT POCKETS IN AIR FRYER MARKET (2023-2032)
- FIGURE 05. MODERATE BARGAINING POWER OF SUPPLIERS
- FIGURE 06. MODERATE THREAT OF NEW ENTRANTS
- FIGURE 07. LOW TO MODERATE THREAT OF SUBSTITUTES
- FIGURE 08. MODERATE INTENSITY OF RIVALRY
- FIGURE 09. MODERATE BARGAINING POWER OF BUYERS
- FIGURE 10. GLOBAL AIR FRYER MARKET:DRIVERS, RESTRAINTS AND OPPORTUNITIES
- FIGURE 11. AIR FRYER MARKET, BY END USER, 2022 AND 2032(%)
- FIGURE 12. COMPARATIVE SHARE ANALYSIS OF AIR FRYER MARKET FOR RESIDENTIAL, BY COUNTRY 2022 AND 2032(%)
- FIGURE 13. COMPARATIVE SHARE ANALYSIS OF AIR FRYER MARKET FOR COMMERCIAL, BY COUNTRY 2022 AND 2032(%)
- FIGURE 14. AIR FRYER MARKET, BY DISTRIBUTION CHANNEL, 2022 AND 2032(%)
- FIGURE 15. COMPARATIVE SHARE ANALYSIS OF AIR FRYER MARKET FOR HYPERMARKETS/SUPERMARKETS, BY COUNTRY 2022 AND 2032(%)
- FIGURE 16. COMPARATIVE SHARE ANALYSIS OF AIR FRYER MARKET FOR SPECIALTY STORES, BY COUNTRY 2022 AND 2032(%)
- FIGURE 17. COMPARATIVE SHARE ANALYSIS OF AIR FRYER MARKET FOR ONLINE CHANNEL, BY COUNTRY 2022 AND 2032(%)
- FIGURE 18. AIR FRYER MARKET BY REGION, 2022 AND 2032(%)
- FIGURE 19. U.S. AIR FRYER MARKET, 2022-2032 ($MILLION)
- FIGURE 20. CANADA AIR FRYER MARKET, 2022-2032 ($MILLION)
- FIGURE 21. MEXICO AIR FRYER MARKET, 2022-2032 ($MILLION)
- FIGURE 22. UK AIR FRYER MARKET, 2022-2032 ($MILLION)
- FIGURE 23. GERMANY AIR FRYER MARKET, 2022-2032 ($MILLION)
- FIGURE 24. BENELUX AIR FRYER MARKET, 2022-2032 ($MILLION)
- FIGURE 25. ITALY AIR FRYER MARKET, 2022-2032 ($MILLION)
- FIGURE 26. SPAIN AIR FRYER MARKET, 2022-2032 ($MILLION)
- FIGURE 27. REST OF EUROPE AIR FRYER MARKET, 2022-2032 ($MILLION)
- FIGURE 28. CHINA AIR FRYER MARKET, 2022-2032 ($MILLION)
- FIGURE 29. INDIA AIR FRYER MARKET, 2022-2032 ($MILLION)
- FIGURE 30. JAPAN AIR FRYER MARKET, 2022-2032 ($MILLION)
- FIGURE 31. SOUTH KOREA AIR FRYER MARKET, 2022-2032 ($MILLION)
- FIGURE 32. REST OF ASIA-PACIFIC AIR FRYER MARKET, 2022-2032 ($MILLION)
- FIGURE 33. LATIN AMERICA AIR FRYER MARKET, 2022-2032 ($MILLION)
- FIGURE 34. MIDDLE EAST AIR FRYER MARKET, 2022-2032 ($MILLION)
- FIGURE 35. AFRICA AIR FRYER MARKET, 2022-2032 ($MILLION)
- FIGURE 36. TOP WINNING STRATEGIES, BY YEAR (2021-2023)
- FIGURE 37. TOP WINNING STRATEGIES, BY DEVELOPMENT (2021-2023)
- FIGURE 38. TOP WINNING STRATEGIES, BY COMPANY (2021-2023)
- FIGURE 39. PRODUCT MAPPING OF TOP 10 PLAYERS
- FIGURE 40. COMPETITIVE DASHBOARD
- FIGURE 41. COMPETITIVE HEATMAP: AIR FRYER MARKET
- FIGURE 42. TOP PLAYER POSITIONING, 2022
- FIGURE 43. NEWELL BRANDS INC.: NET SALES, 2020-2022 ($MILLION)
- FIGURE 44. NEWELL BRANDS INC.: RESEARCH & DEVELOPMENT EXPENDITURE, 2020-2022 ($MILLION)
- FIGURE 45. NEWELL BRANDS INC.: REVENUE SHARE BY SEGMENT, 2022 (%)
- FIGURE 46. NEWELL BRANDS INC.: REVENUE SHARE BY REGION, 2022 (%)
- FIGURE 47. KONINKLIJKE PHILIPS N.V.: NET SALES, 2020-2022 ($MILLION)
- FIGURE 48. KONINKLIJKE PHILIPS N.V.: RESEARCH & DEVELOPMENT EXPENDITURE, 2020-2022 ($MILLION)
- FIGURE 49. KONINKLIJKE PHILIPS N.V.: REVENUE SHARE BY SEGMENT, 2022 (%)
- FIGURE 50. KONINKLIJKE PHILIPS N.V.: REVENUE SHARE BY REGION, 2022 (%)
- FIGURE 51. TTK PRESTIGE LIMITED: NET SALES, 2020-2022 ($MILLION)
- FIGURE 52. TTK PRESTIGE LIMITED: RESEARCH & DEVELOPMENT EXPENDITURE, 2020-2022 ($MILLION)
- FIGURE 53. TTK PRESTIGE LIMITED: REVENUE SHARE BY REGION, 2022 (%)
- FIGURE 54. HAVELLS INDIA LTD.: NET REVENUE, 2020-2022 ($MILLION)
- FIGURE 55. HAVELLS INDIA LTD.: REVENUE SHARE BY SEGMENT, 2022 (%)
- FIGURE 56. HAVELLS INDIA LTD.: REVENUE SHARE BY REGION, 2022 (%)
According to a new report published by Allied Market Research, titled, "Air Fryer Market," The air fryer market was valued at $1 billion in 2022, and is estimated to reach $1.9 billion by 2032, growing at a CAGR of 6.5% from 2023 to 2032.
Air fryer is a kitchen equipment that prepares meals by flowing hot air around it. It uses convection technology to create a crispy coating on the outside of the meal similar to conventional frying techniques, however, with substantially less oil or fat. The appliance is a small countertop product with a heating component and a blower. Customers place their meals in a ventilated basket or on a plate within the fryer, and hot air speedily flows around the food, frying it evenly & providing a crisp texture. Air fryers have gained substantial popularity due to their capacity to generate healthy versions of classic deep-fried food products by using a fraction of the oil.
Significant reduction in the threat of acrylamide production associated with this revolutionary cooking technology is a key driver of the growth of the air fryer market. Acrylamide, a potentially dangerous chemical compound, generated during high-temperature cooking methods such as deep frying has become a major concern for health-conscious consumers. Air fryers use rapid hot air circulation method instead of soaking food in oil, thereby reducing the production of acrylamide as end product. The reduced acrylamide levels resolve health-related concerns as well as correspond with large initiatives to encourage safe and healthy eating practices. With large numbers of consumers becoming aware of the hazards associated with traditional frying processes, the appeal of air fryers as a healthy cooking choice is increasing. The market's growth reflects an intentional move toward kitchen appliances which provide taste and simplicity as well as actively assist in minimizing health risks, thus establishing air fryers as a preferred choice among individuals seeking more secure & health-conscious culinary experience.
However, counterfeit products have emerged as key restraint to the expansion of the air fryer market. With rise in popularity of air fryers, the number of counterfeit or substandard models has increased in the market. These models frequently resemble recognized brands in appearance but lack the quality, security features, and efficiency criteria of genuine products. Consumers who purchase counterfeit air fryers inadvertently face inferior cooking results, safety concerns, and short product lifespans, hence leading to market despair and distrust. The existence of counterfeit products not only damages the reputation of established businesses but also endangers consumer safety. Furthermore, it creates a vague ambience where customers retreat from making investments in air fryers due to concerns regarding product legitimacy and trustworthiness. Therefore, the abundance of counterfeit air fryers works as a growth inhibitor by weakening consumer confidence and stifling overall market expansion.
On the contrary, the expansion of e-commerce sales channel provides a lucrative opportunity for the air fryer market to flourish. Boost in popularity of online shopping platforms has transformed consumer purchasing habits, providing a quick and accessible route for customers to research and purchase kitchen equipment such as air fryers. Moreover, e-commerce platforms offer a broad and diversified market wherein consumers are able to evaluate features, read reviews, and make sound decisions about the finest air fryer models as per their requirements. Manufacturers interact with the global audience through internet retail arena, expanding their presence in the market beyond traditional brick-and-mortar limits. Furthermore, the simplicity of online transactions, along with doorstep delivery options, increases customer convenience, thereby creating a favorable atmosphere for air fryer sales. In addition, e-commerce platforms' capacity to offer incentives, discounts, and package deals increases consumer interest and drives the sales. The air fryer industry is well-positioned to exploit e-commerce channel as an innovative and growing avenue for market expansion as the inclination toward purchasing goods online continues to rise.
The air fryer market is segmented by end user, distribution channel, and region. On the basis of end user, the market is bifurcated into residential and commercial. According to distribution channel, the market is categorized into hypermarkets/supermarkets, specialty stores, and online channels. Depending on region, the market is analyzed across North America, Europe, Asia-Pacific, and LAMEA.
Players operating in the air fryer market have adopted various developmental strategies to expand their market share, increase profitability, and remain competitive in the market. Key players profiled in this report include Kent RO Systems Ltd., Newell Brands (Oster), Koninklijke Phillips N.V., Bajaj Electricals Ltd, TTK Prestige Limited, Havells India Ltd, Taurus Group (Inalsa), NuWave LLC, Arovast Corporation (Cosori), and Wonderchef Home Appliances PVT Ltd.
Key Benefits For Stakeholders
- This report provides a quantitative analysis of the market segments, current trends, estimations, and dynamics of the air fryer market analysis from 2022 to 2032 to identify the prevailing air fryer market opportunities.
- The market research is offered along with information related to key drivers, restraints, and opportunities.
- Porter's five forces analysis highlights the potency of buyers and suppliers to enable stakeholders make profit-oriented business decisions and strengthen their supplier-buyer network.
- In-depth analysis of the air fryer market segmentation assists to determine the prevailing market opportunities.
- Major countries in each region are mapped according to their revenue contribution to the global market.
- Market player positioning facilitates benchmarking and provides a clear understanding of the present position of the market players.
- The report includes the analysis of the regional as well as global air fryer market trends, key players, market segments, application areas, and market growth strategies.
Additional benefits you will get with this purchase are:
- Quarterly Update and* (only available with a corporate license, on listed price)
- 5 additional Company Profile of client Choice pre- or Post-purchase, as a free update.
- Free Upcoming Version on the Purchase of Five and Enterprise User License.
- 16 analyst hours of support* (post-purchase, if you find additional data requirements upon review of the report, you may receive support amounting to 16 analyst hours to solve questions, and post-sale queries)
- 15% Free Customization* (in case the scope or segment of the report does not match your requirements, 15% is equivalent to 3 working days of free work, applicable once)
- Free data Pack on the Five and Enterprise User License. (Excel version of the report)
- Free Updated report if the report is 6-12 months old or older.
- 24-hour priority response*
- Free Industry updates and white papers.
Possible Customization with this report (with additional cost and timeline, please talk to the sales executive to know more)
- Additional company profiles with specific to client's interest
- Additional country or region analysis- market size and forecast
- Criss-cross segment analysis- market size and forecast
- Expanded list for Company Profiles
- Historic market data
- SWOT Analysis
Key Market Segments
By End User
- Residential
- Commercial
By Distribution Channel
- Hypermarkets/Supermarkets
- Specialty Stores
- Online Channel
By Region
- North America
- U.S.
- Canada
- Mexico
- Europe
- UK
- Germany
- Benelux
- Italy
- Spain
- Rest of Europe
- Asia-Pacific
- China
- India
- Japan
- South Korea
- Rest of Asia-Pacific
- LAMEA
- Latin America
- Middle East
- Africa
Key Market Players:
- Kent RO Systems Ltd.
- NuWave, LLC
- TTK Prestige Limited
- Havells India Ltd.
- Taurus Group
- Wonderchef Home Appliances Pvt. Ltd.
- GoWISE USA
- Koninklijke Philips N.V.
- Newell Brands Inc.
- Arovast Corporation
TABLE OF CONTENTS
CHAPTER 1: INTRODUCTION
- 1.1. Report description
- 1.2. Key market segments
- 1.3. Key benefits to the stakeholders
- 1.4. Research methodology
- 1.4.1. Primary research
- 1.4.2. Secondary research
- 1.4.3. Analyst tools and models
CHAPTER 2: EXECUTIVE SUMMARY
- 2.1. CXO Perspective
CHAPTER 3: MARKET OVERVIEW
- 3.1. Market definition and scope
- 3.2. Key findings
- 3.2.1. Top impacting factors
- 3.2.2. Top investment pockets
- 3.3. Porter's five forces analysis
- 3.3.1. Moderate bargaining power of suppliers
- 3.3.2. Moderate threat of new entrants
- 3.3.3. Low to moderate threat of substitutes
- 3.3.4. Moderate intensity of rivalry
- 3.3.5. Moderate bargaining power of buyers
- 3.4. Market dynamics
- 3.4.1. Drivers
- 3.4.1.1. Convenient and time saving features
- 3.4.1.2. Growing awareness for health and wellness
- 3.4.1.3. Rising obesity concerns
- 3.4.2. Restraints
- 3.4.2.1. Limited cooking capacity
- 3.4.2.2. High prices of air fryers
- 3.4.3. Opportunities
- 3.4.3.1. Integration of smart technological air fryers
- 3.4.1. Drivers
CHAPTER 4: AIR FRYER MARKET, BY END USER
- 4.1. Overview
- 4.1.1. Market size and forecast
- 4.2. Residential
- 4.2.1. Key market trends, growth factors and opportunities
- 4.2.2. Market size and forecast, by region
- 4.2.3. Market share analysis by country
- 4.3. Commercial
- 4.3.1. Key market trends, growth factors and opportunities
- 4.3.2. Market size and forecast, by region
- 4.3.3. Market share analysis by country
CHAPTER 5: AIR FRYER MARKET, BY DISTRIBUTION CHANNEL
- 5.1. Overview
- 5.1.1. Market size and forecast
- 5.2. Hypermarkets/Supermarkets
- 5.2.1. Key market trends, growth factors and opportunities
- 5.2.2. Market size and forecast, by region
- 5.2.3. Market share analysis by country
- 5.3. Specialty Stores
- 5.3.1. Key market trends, growth factors and opportunities
- 5.3.2. Market size and forecast, by region
- 5.3.3. Market share analysis by country
- 5.4. Online Channel
- 5.4.1. Key market trends, growth factors and opportunities
- 5.4.2. Market size and forecast, by region
- 5.4.3. Market share analysis by country
CHAPTER 6: AIR FRYER MARKET, BY REGION
- 6.1. Overview
- 6.1.1. Market size and forecast By Region
- 6.2. North America
- 6.2.1. Key market trends, growth factors and opportunities
- 6.2.2. Market size and forecast, by End User
- 6.2.3. Market size and forecast, by Distribution Channel
- 6.2.4. Market size and forecast, by country
- 6.2.4.1. U.S.
- 6.2.4.1.1. Market size and forecast, by End User
- 6.2.4.1.2. Market size and forecast, by Distribution Channel
- 6.2.4.2. Canada
- 6.2.4.2.1. Market size and forecast, by End User
- 6.2.4.2.2. Market size and forecast, by Distribution Channel
- 6.2.4.3. Mexico
- 6.2.4.3.1. Market size and forecast, by End User
- 6.2.4.3.2. Market size and forecast, by Distribution Channel
- 6.3. Europe
- 6.3.1. Key market trends, growth factors and opportunities
- 6.3.2. Market size and forecast, by End User
- 6.3.3. Market size and forecast, by Distribution Channel
- 6.3.4. Market size and forecast, by country
- 6.3.4.1. UK
- 6.3.4.1.1. Market size and forecast, by End User
- 6.3.4.1.2. Market size and forecast, by Distribution Channel
- 6.3.4.2. Germany
- 6.3.4.2.1. Market size and forecast, by End User
- 6.3.4.2.2. Market size and forecast, by Distribution Channel
- 6.3.4.3. Benelux
- 6.3.4.3.1. Market size and forecast, by End User
- 6.3.4.3.2. Market size and forecast, by Distribution Channel
- 6.3.4.4. Italy
- 6.3.4.4.1. Market size and forecast, by End User
- 6.3.4.4.2. Market size and forecast, by Distribution Channel
- 6.3.4.5. Spain
- 6.3.4.5.1. Market size and forecast, by End User
- 6.3.4.5.2. Market size and forecast, by Distribution Channel
- 6.3.4.6. Rest of Europe
- 6.3.4.6.1. Market size and forecast, by End User
- 6.3.4.6.2. Market size and forecast, by Distribution Channel
- 6.4. Asia-Pacific
- 6.4.1. Key market trends, growth factors and opportunities
- 6.4.2. Market size and forecast, by End User
- 6.4.3. Market size and forecast, by Distribution Channel
- 6.4.4. Market size and forecast, by country
- 6.4.4.1. China
- 6.4.4.1.1. Market size and forecast, by End User
- 6.4.4.1.2. Market size and forecast, by Distribution Channel
- 6.4.4.2. India
- 6.4.4.2.1. Market size and forecast, by End User
- 6.4.4.2.2. Market size and forecast, by Distribution Channel
- 6.4.4.3. Japan
- 6.4.4.3.1. Market size and forecast, by End User
- 6.4.4.3.2. Market size and forecast, by Distribution Channel
- 6.4.4.4. South Korea
- 6.4.4.4.1. Market size and forecast, by End User
- 6.4.4.4.2. Market size and forecast, by Distribution Channel
- 6.4.4.5. Rest of Asia-Pacific
- 6.4.4.5.1. Market size and forecast, by End User
- 6.4.4.5.2. Market size and forecast, by Distribution Channel
- 6.5. LAMEA
- 6.5.1. Key market trends, growth factors and opportunities
- 6.5.2. Market size and forecast, by End User
- 6.5.3. Market size and forecast, by Distribution Channel
- 6.5.4. Market size and forecast, by country
- 6.5.4.1. Latin America
- 6.5.4.1.1. Market size and forecast, by End User
- 6.5.4.1.2. Market size and forecast, by Distribution Channel
- 6.5.4.2. Middle East
- 6.5.4.2.1. Market size and forecast, by End User
- 6.5.4.2.2. Market size and forecast, by Distribution Channel
- 6.5.4.3. Africa
- 6.5.4.3.1. Market size and forecast, by End User
- 6.5.4.3.2. Market size and forecast, by Distribution Channel
CHAPTER 7: COMPETITIVE LANDSCAPE
- 7.1. Introduction
- 7.2. Top winning strategies
- 7.3. Product mapping of top 10 player
- 7.4. Competitive dashboard
- 7.5. Competitive heatmap
- 7.6. Top player positioning, 2022
CHAPTER 8: COMPANY PROFILES
- 8.1. Kent RO Systems Ltd.
- 8.1.1. Company overview
- 8.1.2. Key executives
- 8.1.3. Company snapshot
- 8.1.4. Operating business segments
- 8.1.5. Product portfolio
- 8.2. Newell Brands Inc.
- 8.2.1. Company overview
- 8.2.2. Key executives
- 8.2.3. Company snapshot
- 8.2.4. Operating business segments
- 8.2.5. Product portfolio
- 8.2.6. Business performance
- 8.3. Koninklijke Philips N.V.
- 8.3.1. Company overview
- 8.3.2. Key executives
- 8.3.3. Company snapshot
- 8.3.4. Operating business segments
- 8.3.5. Product portfolio
- 8.3.6. Business performance
- 8.4. TTK Prestige Limited
- 8.4.1. Company overview
- 8.4.2. Key executives
- 8.4.3. Company snapshot
- 8.4.4. Operating business segments
- 8.4.5. Product portfolio
- 8.4.6. Business performance
- 8.4.7. Key strategic moves and developments
- 8.5. Havells India Ltd.
- 8.5.1. Company overview
- 8.5.2. Key executives
- 8.5.3. Company snapshot
- 8.5.4. Operating business segments
- 8.5.5. Product portfolio
- 8.5.6. Business performance
- 8.6. Taurus Group
- 8.6.1. Company overview
- 8.6.2. Key executives
- 8.6.3. Company snapshot
- 8.6.4. Operating business segments
- 8.6.5. Product portfolio
- 8.6.6. Key strategic moves and developments
- 8.7. NuWave, LLC
- 8.7.1. Company overview
- 8.7.2. Key executives
- 8.7.3. Company snapshot
- 8.7.4. Operating business segments
- 8.7.5. Product portfolio
- 8.8. Arovast Corporation
- 8.8.1. Company overview
- 8.8.2. Key executives
- 8.8.3. Company snapshot
- 8.8.4. Operating business segments
- 8.8.5. Product portfolio
- 8.9. Wonderchef Home Appliances Pvt. Ltd.
- 8.9.1. Company overview
- 8.9.2. Key executives
- 8.9.3. Company snapshot
- 8.9.4. Operating business segments
- 8.9.5. Product portfolio
- 8.9.6. Key strategic moves and developments
- 8.10. GoWISE USA
- 8.10.1. Company overview
- 8.10.2. Key executives
- 8.10.3. Company snapshot
- 8.10.4. Operating business segments
- 8.10.5. Product portfolio
