|
|
市場調査レポート
商品コード
1414872
保険業界における生成AI市場:コンポーネント別、技術別、用途別:2023年~2032年の世界機会分析と産業予測Generative AI in Insurance Market By Component, By Technology (Generative Adversarial Networks, Transformers, Variational Auto-encoders, Diffusion Networks, Others), By Application : Global Opportunity Analysis and Industry Forecast, 2023-2032 |
||||||
|
|
|||||||
|
|||||||


| 保険業界における生成AI市場:コンポーネント別、技術別、用途別:2023年~2032年の世界機会分析と産業予測 |
|
出版日: 2023年11月30日
発行: Allied Market Research
ページ情報: 英文 274 Pages
納期: 2~3営業日
|

- 全表示
- 概要
- 図表
- 目次
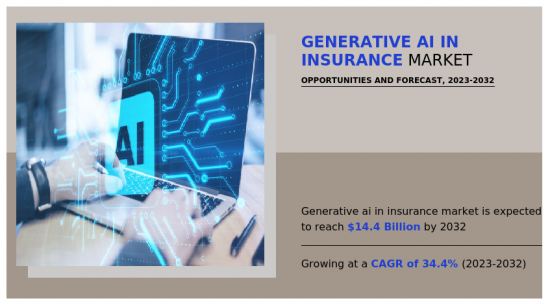
保険業界における生成AI市場は、2022年に7億6,136万米ドルと評価され、2023年から2032年にかけて34.4%のCAGRで成長し、2032年には144億米ドルに達すると推定されます。
保険業界における生成AI市場の主要促進要因の1つは、クレーム処理の迅速化です。生成AIはクレーム処理を迅速化し、データ分析プロセスを自動化することで、あらゆる異常を浮き彫りにし、迅速に解決することで真正なクレームを保証します。さらに、生成AIは、高度なチャットボットやバーチャルアシスタントを通じて、保険会社との顧客とのやり取りを再定義します。これらのAIを搭載したアシスタントは、日常的な問い合わせに対応し、高度な会話を行い、複雑な顧客ニーズを理解し、保険契約や補償オプションについてパーソナライズされた提案を行います。このように、迅速かつ効率的な顧客サービスは、保険市場における生成AIの急成長を支える重要な 促進要因となっています。さらに、生成AIは、過去のデータに基づいてさまざまなリスクシナリオをシミュレーションし、それに応じて保険料を算出するために使用されます。例えば、過去の顧客データから学習することで、生成モデルは将来の潜在的な顧客データとその潜在的なリスクのシミュレーションを作成します。これらのシミュレーションは、リスクをより適切に推定し、保険料を設定するための予測モデルの訓練に使用することができ、保険業界における生成AIの採用を後押ししています。しかし、データの品質と規制上の課題が、保険市場における生成AIの成長を阻む大きな障壁となっています。さらに、必要な計算能力のために、生成AI技術はコストが高く、導入が困難な場合があります。企業は、既存の技術インフラに生成AIを統合する際に新たな課題に直面しています。このように、生成AIの導入コストが高いことが、保険市場における生成AIの成長を阻害しています。逆に、リスクモデリングと保険引受の進歩、透明性のための説明可能なAI(XAI)の採用は、今後数年間、保険業界における生成AI市場に有利な成長機会を提供すると予想されます。
目次
第1章 イントロダクション
第2章 エグゼクティブサマリー
第3章 市場概要
- 市場の定義と範囲
- 主な調査結果
- 影響要因
- 主な投資機会
- ポーターのファイブフォース分析
- 市場力学
- 促進要因
- 生成AIによるクレーム処理の高速化
- 迅速かつ効率的な顧客サービス
- より良いリスク評価と保険料決定
- 抑制要因
- データ品質と規制上の課題
- 高い導入コスト
- 機会
- リスク・モデリングと保険引受の進歩
- 透明性のための説明可能なAI(XAI)の採用
- 促進要因
第4章 保険業界における生成AI市場:コンポーネント別
- 概要
- ソリューション
- サービス
第5章 保険業界における生成AI市場:技術別
- 概要
- 生成的逆数ネットワーク(GANs)
- トランスフォーマー
- 変分オートエンコーダ
- 拡散ネットワーク
- その他
第6章 保険業界における生成AI市場:用途別
- 概要
- パーソナライズされた保険契約
- 保険引受の自動化
- 保険金請求処理の自動化
- 不正行為の検出と防止
- バーチャルアシスタントとカスタマーサポート
- その他
第7章 保険業界における生成AI市場:地域別
- 概要
- 北米
- 米国
- カナダ
- 欧州
- 英国
- ドイツ
- フランス
- イタリア
- スペイン
- その他
- アジア太平洋
- 中国
- 日本
- インド
- オーストラリア
- 韓国
- その他
- ラテンアメリカ・中東・アフリカ
- ラテンアメリカ
- 中東
- アフリカ
第8章 競合情勢
- イントロダクション
- 主要成功戦略
- 主要10社の製品マッピング
- 競合ダッシュボード
- 競合ヒートマップ
- 主要企業ポジショニング(2022年)
第9章 企業プロファイル
- DataRobot, Inc.
- Amazon Web Services, Inc.
- Avaamo
- IBM Corporation
- Microsoft Corporation
- LeewayHertz
- Persado, Inc.
- Aisera
- Shift Technology
- AlphaChat
LIST OF TABLES
- TABLE 01. GLOBAL GENERATIVE AI IN INSURANCE MARKET, BY COMPONENT, 2022-2032 ($MILLION)
- TABLE 02. GENERATIVE AI IN INSURANCE MARKET FOR SOLUTION, BY REGION, 2022-2032 ($MILLION)
- TABLE 03. GENERATIVE AI IN INSURANCE MARKET FOR SERVICE, BY REGION, 2022-2032 ($MILLION)
- TABLE 04. GLOBAL GENERATIVE AI IN INSURANCE MARKET, BY TECHNOLOGY, 2022-2032 ($MILLION)
- TABLE 05. GENERATIVE AI IN INSURANCE MARKET FOR GENERATIVE ADVERSARIAL NETWORKS (GANS), BY REGION, 2022-2032 ($MILLION)
- TABLE 06. GENERATIVE AI IN INSURANCE MARKET FOR TRANSFORMERS, BY REGION, 2022-2032 ($MILLION)
- TABLE 07. GENERATIVE AI IN INSURANCE MARKET FOR VARIATIONAL AUTO-ENCODERS, BY REGION, 2022-2032 ($MILLION)
- TABLE 08. GENERATIVE AI IN INSURANCE MARKET FOR DIFFUSION NETWORKS, BY REGION, 2022-2032 ($MILLION)
- TABLE 09. GENERATIVE AI IN INSURANCE MARKET FOR OTHERS, BY REGION, 2022-2032 ($MILLION)
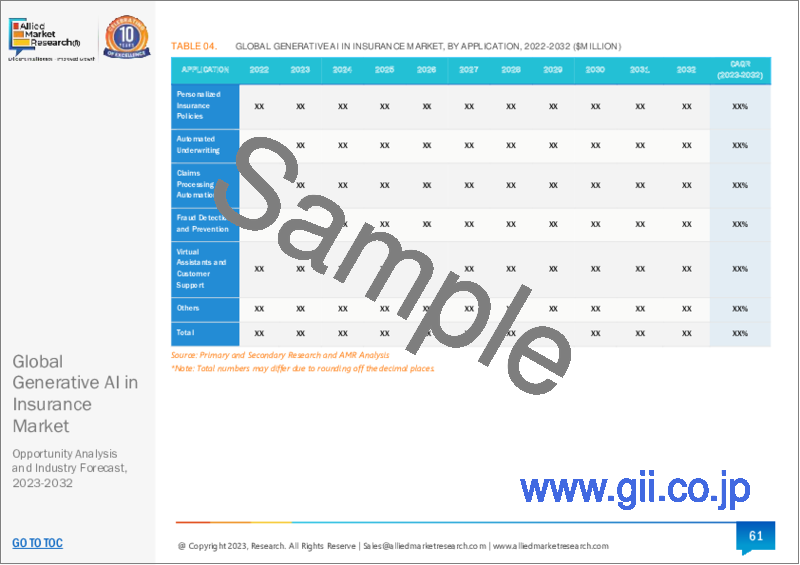
- TABLE 10. GLOBAL GENERATIVE AI IN INSURANCE MARKET, BY APPLICATION, 2022-2032 ($MILLION)
- TABLE 11. GENERATIVE AI IN INSURANCE MARKET FOR PERSONALIZED INSURANCE POLICIES, BY REGION, 2022-2032 ($MILLION)
- TABLE 12. GENERATIVE AI IN INSURANCE MARKET FOR AUTOMATED UNDERWRITING, BY REGION, 2022-2032 ($MILLION)
- TABLE 13. GENERATIVE AI IN INSURANCE MARKET FOR CLAIMS PROCESSING AUTOMATION, BY REGION, 2022-2032 ($MILLION)
- TABLE 14. GENERATIVE AI IN INSURANCE MARKET FOR FRAUD DETECTION AND PREVENTION, BY REGION, 2022-2032 ($MILLION)
- TABLE 15. GENERATIVE AI IN INSURANCE MARKET FOR VIRTUAL ASSISTANTS AND CUSTOMER SUPPORT, BY REGION, 2022-2032 ($MILLION)
- TABLE 16. GENERATIVE AI IN INSURANCE MARKET FOR OTHERS, BY REGION, 2022-2032 ($MILLION)
- TABLE 17. GENERATIVE AI IN INSURANCE MARKET, BY REGION, 2022-2032 ($MILLION)
- TABLE 18. NORTH AMERICA GENERATIVE AI IN INSURANCE MARKET, BY COMPONENT, 2022-2032 ($MILLION)
- TABLE 19. NORTH AMERICA GENERATIVE AI IN INSURANCE MARKET, BY TECHNOLOGY, 2022-2032 ($MILLION)
- TABLE 20. NORTH AMERICA GENERATIVE AI IN INSURANCE MARKET, BY APPLICATION, 2022-2032 ($MILLION)
- TABLE 21. NORTH AMERICA GENERATIVE AI IN INSURANCE MARKET, BY COUNTRY, 2022-2032 ($MILLION)
- TABLE 22. U.S. GENERATIVE AI IN INSURANCE MARKET, BY COMPONENT, 2022-2032 ($MILLION)
- TABLE 23. U.S. GENERATIVE AI IN INSURANCE MARKET, BY TECHNOLOGY, 2022-2032 ($MILLION)
- TABLE 24. U.S. GENERATIVE AI IN INSURANCE MARKET, BY APPLICATION, 2022-2032 ($MILLION)
- TABLE 25. CANADA GENERATIVE AI IN INSURANCE MARKET, BY COMPONENT, 2022-2032 ($MILLION)
- TABLE 26. CANADA GENERATIVE AI IN INSURANCE MARKET, BY TECHNOLOGY, 2022-2032 ($MILLION)
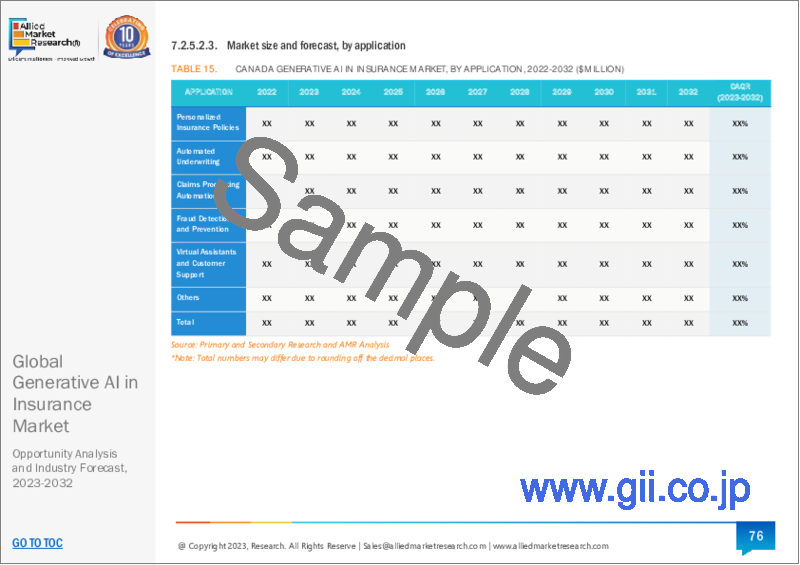
- TABLE 27. CANADA GENERATIVE AI IN INSURANCE MARKET, BY APPLICATION, 2022-2032 ($MILLION)
- TABLE 28. EUROPE GENERATIVE AI IN INSURANCE MARKET, BY COMPONENT, 2022-2032 ($MILLION)
- TABLE 29. EUROPE GENERATIVE AI IN INSURANCE MARKET, BY TECHNOLOGY, 2022-2032 ($MILLION)
- TABLE 30. EUROPE GENERATIVE AI IN INSURANCE MARKET, BY APPLICATION, 2022-2032 ($MILLION)
- TABLE 31. EUROPE GENERATIVE AI IN INSURANCE MARKET, BY COUNTRY, 2022-2032 ($MILLION)
- TABLE 32. UK GENERATIVE AI IN INSURANCE MARKET, BY COMPONENT, 2022-2032 ($MILLION)
- TABLE 33. UK GENERATIVE AI IN INSURANCE MARKET, BY TECHNOLOGY, 2022-2032 ($MILLION)
- TABLE 34. UK GENERATIVE AI IN INSURANCE MARKET, BY APPLICATION, 2022-2032 ($MILLION)
- TABLE 35. GERMANY GENERATIVE AI IN INSURANCE MARKET, BY COMPONENT, 2022-2032 ($MILLION)
- TABLE 36. GERMANY GENERATIVE AI IN INSURANCE MARKET, BY TECHNOLOGY, 2022-2032 ($MILLION)
- TABLE 37. GERMANY GENERATIVE AI IN INSURANCE MARKET, BY APPLICATION, 2022-2032 ($MILLION)
- TABLE 38. FRANCE GENERATIVE AI IN INSURANCE MARKET, BY COMPONENT, 2022-2032 ($MILLION)
- TABLE 39. FRANCE GENERATIVE AI IN INSURANCE MARKET, BY TECHNOLOGY, 2022-2032 ($MILLION)
- TABLE 40. FRANCE GENERATIVE AI IN INSURANCE MARKET, BY APPLICATION, 2022-2032 ($MILLION)
- TABLE 41. ITALY GENERATIVE AI IN INSURANCE MARKET, BY COMPONENT, 2022-2032 ($MILLION)
- TABLE 42. ITALY GENERATIVE AI IN INSURANCE MARKET, BY TECHNOLOGY, 2022-2032 ($MILLION)
- TABLE 43. ITALY GENERATIVE AI IN INSURANCE MARKET, BY APPLICATION, 2022-2032 ($MILLION)
- TABLE 44. SPAIN GENERATIVE AI IN INSURANCE MARKET, BY COMPONENT, 2022-2032 ($MILLION)
- TABLE 45. SPAIN GENERATIVE AI IN INSURANCE MARKET, BY TECHNOLOGY, 2022-2032 ($MILLION)
- TABLE 46. SPAIN GENERATIVE AI IN INSURANCE MARKET, BY APPLICATION, 2022-2032 ($MILLION)
- TABLE 47. REST OF EUROPE GENERATIVE AI IN INSURANCE MARKET, BY COMPONENT, 2022-2032 ($MILLION)
- TABLE 48. REST OF EUROPE GENERATIVE AI IN INSURANCE MARKET, BY TECHNOLOGY, 2022-2032 ($MILLION)
- TABLE 49. REST OF EUROPE GENERATIVE AI IN INSURANCE MARKET, BY APPLICATION, 2022-2032 ($MILLION)
- TABLE 50. ASIA-PACIFIC GENERATIVE AI IN INSURANCE MARKET, BY COMPONENT, 2022-2032 ($MILLION)
- TABLE 51. ASIA-PACIFIC GENERATIVE AI IN INSURANCE MARKET, BY TECHNOLOGY, 2022-2032 ($MILLION)
- TABLE 52. ASIA-PACIFIC GENERATIVE AI IN INSURANCE MARKET, BY APPLICATION, 2022-2032 ($MILLION)
- TABLE 53. ASIA-PACIFIC GENERATIVE AI IN INSURANCE MARKET, BY COUNTRY, 2022-2032 ($MILLION)
- TABLE 54. CHINA GENERATIVE AI IN INSURANCE MARKET, BY COMPONENT, 2022-2032 ($MILLION)
- TABLE 55. CHINA GENERATIVE AI IN INSURANCE MARKET, BY TECHNOLOGY, 2022-2032 ($MILLION)
- TABLE 56. CHINA GENERATIVE AI IN INSURANCE MARKET, BY APPLICATION, 2022-2032 ($MILLION)
- TABLE 57. JAPAN GENERATIVE AI IN INSURANCE MARKET, BY COMPONENT, 2022-2032 ($MILLION)
- TABLE 58. JAPAN GENERATIVE AI IN INSURANCE MARKET, BY TECHNOLOGY, 2022-2032 ($MILLION)
- TABLE 59. JAPAN GENERATIVE AI IN INSURANCE MARKET, BY APPLICATION, 2022-2032 ($MILLION)
- TABLE 60. INDIA GENERATIVE AI IN INSURANCE MARKET, BY COMPONENT, 2022-2032 ($MILLION)
- TABLE 61. INDIA GENERATIVE AI IN INSURANCE MARKET, BY TECHNOLOGY, 2022-2032 ($MILLION)
- TABLE 62. INDIA GENERATIVE AI IN INSURANCE MARKET, BY APPLICATION, 2022-2032 ($MILLION)
- TABLE 63. AUSTRALIA GENERATIVE AI IN INSURANCE MARKET, BY COMPONENT, 2022-2032 ($MILLION)
- TABLE 64. AUSTRALIA GENERATIVE AI IN INSURANCE MARKET, BY TECHNOLOGY, 2022-2032 ($MILLION)
- TABLE 65. AUSTRALIA GENERATIVE AI IN INSURANCE MARKET, BY APPLICATION, 2022-2032 ($MILLION)
- TABLE 66. SOUTH KOREA GENERATIVE AI IN INSURANCE MARKET, BY COMPONENT, 2022-2032 ($MILLION)
- TABLE 67. SOUTH KOREA GENERATIVE AI IN INSURANCE MARKET, BY TECHNOLOGY, 2022-2032 ($MILLION)
- TABLE 68. SOUTH KOREA GENERATIVE AI IN INSURANCE MARKET, BY APPLICATION, 2022-2032 ($MILLION)
- TABLE 69. REST OF ASIA-PACIFIC GENERATIVE AI IN INSURANCE MARKET, BY COMPONENT, 2022-2032 ($MILLION)
- TABLE 70. REST OF ASIA-PACIFIC GENERATIVE AI IN INSURANCE MARKET, BY TECHNOLOGY, 2022-2032 ($MILLION)
- TABLE 71. REST OF ASIA-PACIFIC GENERATIVE AI IN INSURANCE MARKET, BY APPLICATION, 2022-2032 ($MILLION)
- TABLE 72. LAMEA GENERATIVE AI IN INSURANCE MARKET, BY COMPONENT, 2022-2032 ($MILLION)
- TABLE 73. LAMEA GENERATIVE AI IN INSURANCE MARKET, BY TECHNOLOGY, 2022-2032 ($MILLION)
- TABLE 74. LAMEA GENERATIVE AI IN INSURANCE MARKET, BY APPLICATION, 2022-2032 ($MILLION)
- TABLE 75. LAMEA GENERATIVE AI IN INSURANCE MARKET, BY COUNTRY, 2022-2032 ($MILLION)
- TABLE 76. LATIN AMERICA GENERATIVE AI IN INSURANCE MARKET, BY COMPONENT, 2022-2032 ($MILLION)
- TABLE 77. LATIN AMERICA GENERATIVE AI IN INSURANCE MARKET, BY TECHNOLOGY, 2022-2032 ($MILLION)
- TABLE 78. LATIN AMERICA GENERATIVE AI IN INSURANCE MARKET, BY APPLICATION, 2022-2032 ($MILLION)
- TABLE 79. MIDDLE EAST GENERATIVE AI IN INSURANCE MARKET, BY COMPONENT, 2022-2032 ($MILLION)
- TABLE 80. MIDDLE EAST GENERATIVE AI IN INSURANCE MARKET, BY TECHNOLOGY, 2022-2032 ($MILLION)
- TABLE 81. MIDDLE EAST GENERATIVE AI IN INSURANCE MARKET, BY APPLICATION, 2022-2032 ($MILLION)
- TABLE 82. AFRICA GENERATIVE AI IN INSURANCE MARKET, BY COMPONENT, 2022-2032 ($MILLION)
- TABLE 83. AFRICA GENERATIVE AI IN INSURANCE MARKET, BY TECHNOLOGY, 2022-2032 ($MILLION)
- TABLE 84. AFRICA GENERATIVE AI IN INSURANCE MARKET, BY APPLICATION, 2022-2032 ($MILLION)
- TABLE 85. DATAROBOT, INC.: KEY EXECUTIVES
- TABLE 86. DATAROBOT, INC.: COMPANY SNAPSHOT
- TABLE 87. DATAROBOT, INC.: SERVICE SEGMENTS
- TABLE 88. DATAROBOT, INC.: PRODUCT PORTFOLIO
- TABLE 89. AMAZON WEB SERVICES, INC.: KEY EXECUTIVES
- TABLE 90. AMAZON WEB SERVICES, INC.: COMPANY SNAPSHOT
- TABLE 91. AMAZON WEB SERVICES, INC.: SERVICE SEGMENTS
- TABLE 92. AMAZON WEB SERVICES, INC.: PRODUCT PORTFOLIO
- TABLE 93. AVAAMO: KEY EXECUTIVES
- TABLE 94. AVAAMO: COMPANY SNAPSHOT
- TABLE 95. AVAAMO: SERVICE SEGMENTS
- TABLE 96. AVAAMO: PRODUCT PORTFOLIO
- TABLE 97. AVAAMO: KEY STRATERGIES
- TABLE 98. IBM CORPORATION: KEY EXECUTIVES
- TABLE 99. IBM CORPORATION: COMPANY SNAPSHOT
- TABLE 100. IBM CORPORATION: PRODUCT SEGMENTS
- TABLE 101. IBM CORPORATION: PRODUCT PORTFOLIO
- TABLE 102. IBM CORPORATION: KEY STRATERGIES
- TABLE 103. MICROSOFT CORPORATION: KEY EXECUTIVES
- TABLE 104. MICROSOFT CORPORATION: COMPANY SNAPSHOT
- TABLE 105. MICROSOFT CORPORATION: SERVICE SEGMENTS
- TABLE 106. MICROSOFT CORPORATION: PRODUCT PORTFOLIO
- TABLE 107. MICROSOFT CORPORATION: KEY STRATERGIES
- TABLE 108. LEEWAYHERTZ: KEY EXECUTIVES
- TABLE 109. LEEWAYHERTZ: COMPANY SNAPSHOT
- TABLE 110. LEEWAYHERTZ: SERVICE SEGMENTS
- TABLE 111. LEEWAYHERTZ: PRODUCT PORTFOLIO
- TABLE 112. PERSADO, INC.: KEY EXECUTIVES
- TABLE 113. PERSADO, INC.: COMPANY SNAPSHOT
- TABLE 114. PERSADO, INC.: SERVICE SEGMENTS
- TABLE 115. PERSADO, INC.: PRODUCT PORTFOLIO
- TABLE 116. AISERA: KEY EXECUTIVES
- TABLE 117. AISERA: COMPANY SNAPSHOT
- TABLE 118. AISERA: SERVICE SEGMENTS
- TABLE 119. AISERA: PRODUCT PORTFOLIO
- TABLE 120. SHIFT TECHNOLOGY: KEY EXECUTIVES
- TABLE 121. SHIFT TECHNOLOGY: COMPANY SNAPSHOT
- TABLE 122. SHIFT TECHNOLOGY: SERVICE SEGMENTS
- TABLE 123. SHIFT TECHNOLOGY: PRODUCT PORTFOLIO
- TABLE 124. SHIFT TECHNOLOGY: KEY STRATERGIES
- TABLE 125. ALPHACHAT: KEY EXECUTIVES
- TABLE 126. ALPHACHAT: COMPANY SNAPSHOT
- TABLE 127. ALPHACHAT: SERVICE SEGMENTS
- TABLE 128. ALPHACHAT: PRODUCT PORTFOLIO
- TABLE 129. ALPHACHAT: KEY STRATERGIES
LIST OF FIGURES
- FIGURE 01. GENERATIVE AI IN INSURANCE MARKET, 2022-2032
- FIGURE 02. SEGMENTATION OF GENERATIVE AI IN INSURANCE MARKET,2022-2032
- FIGURE 03. TOP IMPACTING FACTORS IN GENERATIVE AI IN INSURANCE MARKET (2022 TO 2032)
- FIGURE 04. TOP INVESTMENT POCKETS IN GENERATIVE AI IN INSURANCE MARKET (2023-2032)
- FIGURE 05. LOW BARGAINING POWER OF SUPPLIERS
- FIGURE 06. LOW THREAT OF NEW ENTRANTS
- FIGURE 07. LOW THREAT OF SUBSTITUTES
- FIGURE 08. LOW INTENSITY OF RIVALRY
- FIGURE 09. LOW BARGAINING POWER OF BUYERS
- FIGURE 10. GLOBAL GENERATIVE AI IN INSURANCE MARKET:DRIVERS, RESTRAINTS AND OPPORTUNITIES
- FIGURE 11. GENERATIVE AI IN INSURANCE MARKET, BY COMPONENT, 2022 AND 2032(%)
- FIGURE 12. COMPARATIVE SHARE ANALYSIS OF GENERATIVE AI IN INSURANCE MARKET FOR SOLUTION, BY COUNTRY 2022 AND 2032(%)
- FIGURE 13. COMPARATIVE SHARE ANALYSIS OF GENERATIVE AI IN INSURANCE MARKET FOR SERVICE, BY COUNTRY 2022 AND 2032(%)
- FIGURE 14. GENERATIVE AI IN INSURANCE MARKET, BY TECHNOLOGY, 2022 AND 2032(%)
- FIGURE 15. COMPARATIVE SHARE ANALYSIS OF GENERATIVE AI IN INSURANCE MARKET FOR GENERATIVE ADVERSARIAL NETWORKS (GANS), BY COUNTRY 2022 AND 2032(%)
- FIGURE 16. COMPARATIVE SHARE ANALYSIS OF GENERATIVE AI IN INSURANCE MARKET FOR TRANSFORMERS, BY COUNTRY 2022 AND 2032(%)
- FIGURE 17. COMPARATIVE SHARE ANALYSIS OF GENERATIVE AI IN INSURANCE MARKET FOR VARIATIONAL AUTO-ENCODERS, BY COUNTRY 2022 AND 2032(%)
- FIGURE 18. COMPARATIVE SHARE ANALYSIS OF GENERATIVE AI IN INSURANCE MARKET FOR DIFFUSION NETWORKS, BY COUNTRY 2022 AND 2032(%)
- FIGURE 19. COMPARATIVE SHARE ANALYSIS OF GENERATIVE AI IN INSURANCE MARKET FOR OTHERS, BY COUNTRY 2022 AND 2032(%)
- FIGURE 20. GENERATIVE AI IN INSURANCE MARKET, BY APPLICATION, 2022 AND 2032(%)
- FIGURE 21. COMPARATIVE SHARE ANALYSIS OF GENERATIVE AI IN INSURANCE MARKET FOR PERSONALIZED INSURANCE POLICIES, BY COUNTRY 2022 AND 2032(%)
- FIGURE 22. COMPARATIVE SHARE ANALYSIS OF GENERATIVE AI IN INSURANCE MARKET FOR AUTOMATED UNDERWRITING, BY COUNTRY 2022 AND 2032(%)
- FIGURE 23. COMPARATIVE SHARE ANALYSIS OF GENERATIVE AI IN INSURANCE MARKET FOR CLAIMS PROCESSING AUTOMATION, BY COUNTRY 2022 AND 2032(%)
- FIGURE 24. COMPARATIVE SHARE ANALYSIS OF GENERATIVE AI IN INSURANCE MARKET FOR FRAUD DETECTION AND PREVENTION, BY COUNTRY 2022 AND 2032(%)
- FIGURE 25. COMPARATIVE SHARE ANALYSIS OF GENERATIVE AI IN INSURANCE MARKET FOR VIRTUAL ASSISTANTS AND CUSTOMER SUPPORT, BY COUNTRY 2022 AND 2032(%)
- FIGURE 26. COMPARATIVE SHARE ANALYSIS OF GENERATIVE AI IN INSURANCE MARKET FOR OTHERS, BY COUNTRY 2022 AND 2032(%)
- FIGURE 27. GENERATIVE AI IN INSURANCE MARKET BY REGION, 2022 AND 2032(%)
- FIGURE 28. U.S. GENERATIVE AI IN INSURANCE MARKET, 2022-2032 ($MILLION)
- FIGURE 29. CANADA GENERATIVE AI IN INSURANCE MARKET, 2022-2032 ($MILLION)
- FIGURE 30. UK GENERATIVE AI IN INSURANCE MARKET, 2022-2032 ($MILLION)
- FIGURE 31. GERMANY GENERATIVE AI IN INSURANCE MARKET, 2022-2032 ($MILLION)
- FIGURE 32. FRANCE GENERATIVE AI IN INSURANCE MARKET, 2022-2032 ($MILLION)
- FIGURE 33. ITALY GENERATIVE AI IN INSURANCE MARKET, 2022-2032 ($MILLION)
- FIGURE 34. SPAIN GENERATIVE AI IN INSURANCE MARKET, 2022-2032 ($MILLION)
- FIGURE 35. REST OF EUROPE GENERATIVE AI IN INSURANCE MARKET, 2022-2032 ($MILLION)
- FIGURE 36. CHINA GENERATIVE AI IN INSURANCE MARKET, 2022-2032 ($MILLION)
- FIGURE 37. JAPAN GENERATIVE AI IN INSURANCE MARKET, 2022-2032 ($MILLION)
- FIGURE 38. INDIA GENERATIVE AI IN INSURANCE MARKET, 2022-2032 ($MILLION)
- FIGURE 39. AUSTRALIA GENERATIVE AI IN INSURANCE MARKET, 2022-2032 ($MILLION)
- FIGURE 40. SOUTH KOREA GENERATIVE AI IN INSURANCE MARKET, 2022-2032 ($MILLION)
- FIGURE 41. REST OF ASIA-PACIFIC GENERATIVE AI IN INSURANCE MARKET, 2022-2032 ($MILLION)
- FIGURE 42. LATIN AMERICA GENERATIVE AI IN INSURANCE MARKET, 2022-2032 ($MILLION)
- FIGURE 43. MIDDLE EAST GENERATIVE AI IN INSURANCE MARKET, 2022-2032 ($MILLION)
- FIGURE 44. AFRICA GENERATIVE AI IN INSURANCE MARKET, 2022-2032 ($MILLION)
- FIGURE 45. TOP WINNING STRATEGIES, BY YEAR (2021-2023)
- FIGURE 46. TOP WINNING STRATEGIES, BY DEVELOPMENT (2021-2023)
- FIGURE 47. TOP WINNING STRATEGIES, BY COMPANY (2021-2023)
- FIGURE 48. PRODUCT MAPPING OF TOP 10 PLAYERS
- FIGURE 49. COMPETITIVE DASHBOARD
- FIGURE 50. COMPETITIVE HEATMAP: GENERATIVE AI IN INSURANCE MARKET
- FIGURE 51. TOP PLAYER POSITIONING, 2022
- FIGURE 52. AMAZON WEB SERVICES, INC.: NET REVENUE, 2020-2022 ($MILLION)
- FIGURE 53. AMAZON WEB SERVICES, INC.: REVENUE SHARE BY SEGMENT, 2022 (%)
- FIGURE 54. AMAZON WEB SERVICES, INC.: REVENUE SHARE BY REGION, 2022 (%)
- FIGURE 55. IBM CORPORATION: NET REVENUE, 2020-2022 ($MILLION)
- FIGURE 56. IBM CORPORATION: RESEARCH & DEVELOPMENT EXPENDITURE, 2020-2022 ($MILLION)
- FIGURE 57. IBM CORPORATION: REVENUE SHARE BY SEGMENT, 2022 (%)
- FIGURE 58. IBM CORPORATION: REVENUE SHARE BY REGION, 2022 (%)
- FIGURE 59. MICROSOFT CORPORATION: NET REVENUE, 2020-2022 ($MILLION)
- FIGURE 60. MICROSOFT CORPORATION: RESEARCH & DEVELOPMENT EXPENDITURE, 2020-2022 ($MILLION)
- FIGURE 61. MICROSOFT CORPORATION: REVENUE SHARE BY SEGMENT, 2022 (%)
- FIGURE 62. MICROSOFT CORPORATION: REVENUE SHARE BY REGION, 2022 (%)
- FIGURE 63. ALPHACHAT: NET REVENUE, 2020-2022 ($MILLION)
According to a new report published by Allied Market Research, titled, "Generative AI in Insurance Market," The generative ai in insurance market was valued at $761.36 million in 2022, and is estimated to reach $14.4 billion by 2032, growing at a CAGR of 34.4% from 2023 to 2032.
One of the key drivers of generative AI in insurance market is faster claims processing. Generative AI speeds up the claims process and automates the data analysis process, highlighting any anomalies and ensuring genuine claims by quickly resolving them. Furthermore, generative AI redefines customer interactions with insurers through advanced chatbots and virtual assistants. These AI-powered assistants handle routine queries and engage in sophisticated conversations, understanding complex customer needs and offering personalized recommendations for policies and coverage options. Thus, responsive and efficient customer service is a key driver behind the rapid growth of the generative AI in insurance market. In addition, generative AI is used to simulate different risk scenarios based on historical data and calculate the premium accordingly. For instance, by learning from previous customer data, generative models produce simulations of potential future customer data and their potential risks. These simulations can be used to train predictive models to better estimate risk and set insurance premiums, which drives the adoption of generative AI in insurance industry. However, data quality and regulatory challenges have emerged as significant barriers to the growth of the generative AI in insurance market. Moreover, due to the required computational power, generative AI technology may be costly and difficult to implement. Enterprises are facing new challenges when integrating generative AI with their existing technical infrastructures. Thus, high implementation cost of generative AI hampers the growth of the generative AI in insurance market. On the contrary, risk modeling and underwriting advancements, and the adoption of explainable AI (XAI) for transparency are expected to offer lucrative growth opportunities to the generative AI in insurance market in the upcoming years.
The generative AI in insurance market is segmented into component, technology, application, and region. On the basis of component, the market is differentiated into solution and service. On the basis of technology, the market is segmented into generative adversarial networks (GANs), transformers, variational auto-encoders, diffusion networks, and others. By application, the market is divided into personalized insurance policies, automated underwriting, claims processing automation, fraud detection and prevention, virtual assistants and customer support, and others. Region-wise, the market is segmented into North America, Europe, Asia-Pacific, and LAMEA.
The key players operating in the generative AI in insurance market include DataRobot, Inc., Microsoft Corporation, Amazon Web Services, Inc., Avaamo, IBM Corporation, LeewayHertz, Persado, Inc., Aisera, Shift Technology, and AlphaChat. These players have adopted various strategies to increase their market penetration and strengthen their position in the generative AI in insurance industry.
Key Benefits for Stakeholders
- The study provides in-depth analysis of the generative AI in insurance market along with current trends and future estimations to illustrate the imminent investment pockets.
- Information about key drivers, restrains, & opportunities and their impact analysis on the Generative AI in insurance market size are provided in the report.
- The Porter's five forces analysis illustrates the potency of buyers and suppliers operating in the industry.
- The quantitative analysis of the generative AI in insurance market from 2022 to 2032 is provided to determine the market potential.
Additional benefits you will get with this purchase are:
- Quarterly Update and* (only available with a corporate license, on listed price)
- 5 additional Company Profile of client Choice pre- or Post-purchase, as a free update.
- Free Upcoming Version on the Purchase of Five and Enterprise User License.
- 16 analyst hours of support* (post-purchase, if you find additional data requirements upon review of the report, you may receive support amounting to 16 analyst hours to solve questions, and post-sale queries)
- 15% Free Customization* (in case the scope or segment of the report does not match your requirements, 15% is equivalent to 3 working days of free work, applicable once)
- Free data Pack on the Five and Enterprise User License. (Excel version of the report)
- Free Updated report if the report is 6-12 months old or older.
- 24-hour priority response*
- Free Industry updates and white papers.
Possible Customization with this report (with additional cost and timeline, please talk to the sales executive to know more)
- Investment Opportunities
- Market share analysis of players by products/segments
- Regulatory Guidelines
- Additional company profiles with specific to client's interest
- Additional country or region analysis- market size and forecast
- Expanded list for Company Profiles
- Market share analysis of players at global/region/country level
Key Market Segments
By Component
- Solution
- Service
By Technology
- Generative Adversarial Networks (GANs)
- Transformers
- Variational Auto-encoders
- Diffusion Networks
- Others
By Application
- Personalized Insurance Policies
- Automated Underwriting
- Claims Processing Automation
- Fraud Detection and Prevention
- Virtual Assistants and Customer Support
- Others
By Region
- North America
- U.S.
- Canada
- Europe
- UK
- Germany
- France
- Italy
- Spain
- Rest of Europe
- Asia-Pacific
- China
- Japan
- India
- Australia
- South Korea
- Rest of Asia-Pacific
- LAMEA
- Latin America
- Middle East
- Africa
Key Market Players:
- IBM Corporation
- Microsoft Corporation
- DataRobot, Inc.
- Amazon Web Services, Inc.
- AlphaChat
- Avaamo
- LeewayHertz
- Aisera
- Shift Technology
- Persado, Inc.
TABLE OF CONTENTS
CHAPTER 1: INTRODUCTION
- 1.1. Report description
- 1.2. Key market segments
- 1.3. Key benefits to the stakeholders
- 1.4. Research methodology
- 1.4.1. Primary research
- 1.4.2. Secondary research
- 1.4.3. Analyst tools and models
CHAPTER 2: EXECUTIVE SUMMARY
- 2.1. CXO Perspective
CHAPTER 3: MARKET OVERVIEW
- 3.1. Market definition and scope
- 3.2. Key findings
- 3.2.1. Top impacting factors
- 3.2.2. Top investment pockets
- 3.3. Porter's five forces analysis
- 3.3.1. Low bargaining power of suppliers
- 3.3.2. Low threat of new entrants
- 3.3.3. Low threat of substitutes
- 3.3.4. Low intensity of rivalry
- 3.3.5. Low bargaining power of buyers
- 3.4. Market dynamics
- 3.4.1. Drivers
- 3.4.1.1. Faster claims processing through generative AI
- 3.4.1.2. Responsive and efficient customer service
- 3.4.1.3. Better risk assessment and premium determination
- 3.4.2. Restraints
- 3.4.2.1. Data quality and regulatory challenges
- 3.4.2.2. High implementation cost
- 3.4.3. Opportunities
- 3.4.3.1. Risk modeling and underwriting advancements
- 3.4.3.2. Adoption of explainable AI (XAI) for transparency
- 3.4.1. Drivers
CHAPTER 4: GENERATIVE AI IN INSURANCE MARKET, BY COMPONENT
- 4.1. Overview
- 4.1.1. Market size and forecast
- 4.2. Solution
- 4.2.1. Key market trends, growth factors and opportunities
- 4.2.2. Market size and forecast, by region
- 4.2.3. Market share analysis by country
- 4.3. Service
- 4.3.1. Key market trends, growth factors and opportunities
- 4.3.2. Market size and forecast, by region
- 4.3.3. Market share analysis by country
CHAPTER 5: GENERATIVE AI IN INSURANCE MARKET, BY TECHNOLOGY
- 5.1. Overview
- 5.1.1. Market size and forecast
- 5.2. Generative Adversarial Networks (GANs)
- 5.2.1. Key market trends, growth factors and opportunities
- 5.2.2. Market size and forecast, by region
- 5.2.3. Market share analysis by country
- 5.3. Transformers
- 5.3.1. Key market trends, growth factors and opportunities
- 5.3.2. Market size and forecast, by region
- 5.3.3. Market share analysis by country
- 5.4. Variational Auto-encoders
- 5.4.1. Key market trends, growth factors and opportunities
- 5.4.2. Market size and forecast, by region
- 5.4.3. Market share analysis by country
- 5.5. Diffusion Networks
- 5.5.1. Key market trends, growth factors and opportunities
- 5.5.2. Market size and forecast, by region
- 5.5.3. Market share analysis by country
- 5.6. Others
- 5.6.1. Key market trends, growth factors and opportunities
- 5.6.2. Market size and forecast, by region
- 5.6.3. Market share analysis by country
CHAPTER 6: GENERATIVE AI IN INSURANCE MARKET, BY APPLICATION
- 6.1. Overview
- 6.1.1. Market size and forecast
- 6.2. Personalized Insurance Policies
- 6.2.1. Key market trends, growth factors and opportunities
- 6.2.2. Market size and forecast, by region
- 6.2.3. Market share analysis by country
- 6.3. Automated Underwriting
- 6.3.1. Key market trends, growth factors and opportunities
- 6.3.2. Market size and forecast, by region
- 6.3.3. Market share analysis by country
- 6.4. Claims Processing Automation
- 6.4.1. Key market trends, growth factors and opportunities
- 6.4.2. Market size and forecast, by region
- 6.4.3. Market share analysis by country
- 6.5. Fraud Detection and Prevention
- 6.5.1. Key market trends, growth factors and opportunities
- 6.5.2. Market size and forecast, by region
- 6.5.3. Market share analysis by country
- 6.6. Virtual Assistants and Customer Support
- 6.6.1. Key market trends, growth factors and opportunities
- 6.6.2. Market size and forecast, by region
- 6.6.3. Market share analysis by country
- 6.7. Others
- 6.7.1. Key market trends, growth factors and opportunities
- 6.7.2. Market size and forecast, by region
- 6.7.3. Market share analysis by country
CHAPTER 7: GENERATIVE AI IN INSURANCE MARKET, BY REGION
- 7.1. Overview
- 7.1.1. Market size and forecast By Region
- 7.2. North America
- 7.2.1. Key market trends, growth factors and opportunities
- 7.2.2. Market size and forecast, by Component
- 7.2.3. Market size and forecast, by Technology
- 7.2.4. Market size and forecast, by Application
- 7.2.5. Market size and forecast, by country
- 7.2.5.1. U.S.
- 7.2.5.1.1. Market size and forecast, by Component
- 7.2.5.1.2. Market size and forecast, by Technology
- 7.2.5.1.3. Market size and forecast, by Application
- 7.2.5.2. Canada
- 7.2.5.2.1. Market size and forecast, by Component
- 7.2.5.2.2. Market size and forecast, by Technology
- 7.2.5.2.3. Market size and forecast, by Application
- 7.3. Europe
- 7.3.1. Key market trends, growth factors and opportunities
- 7.3.2. Market size and forecast, by Component
- 7.3.3. Market size and forecast, by Technology
- 7.3.4. Market size and forecast, by Application
- 7.3.5. Market size and forecast, by country
- 7.3.5.1. UK
- 7.3.5.1.1. Market size and forecast, by Component
- 7.3.5.1.2. Market size and forecast, by Technology
- 7.3.5.1.3. Market size and forecast, by Application
- 7.3.5.2. Germany
- 7.3.5.2.1. Market size and forecast, by Component
- 7.3.5.2.2. Market size and forecast, by Technology
- 7.3.5.2.3. Market size and forecast, by Application
- 7.3.5.3. France
- 7.3.5.3.1. Market size and forecast, by Component
- 7.3.5.3.2. Market size and forecast, by Technology
- 7.3.5.3.3. Market size and forecast, by Application
- 7.3.5.4. Italy
- 7.3.5.4.1. Market size and forecast, by Component
- 7.3.5.4.2. Market size and forecast, by Technology
- 7.3.5.4.3. Market size and forecast, by Application
- 7.3.5.5. Spain
- 7.3.5.5.1. Market size and forecast, by Component
- 7.3.5.5.2. Market size and forecast, by Technology
- 7.3.5.5.3. Market size and forecast, by Application
- 7.3.5.6. Rest of Europe
- 7.3.5.6.1. Market size and forecast, by Component
- 7.3.5.6.2. Market size and forecast, by Technology
- 7.3.5.6.3. Market size and forecast, by Application
- 7.4. Asia-Pacific
- 7.4.1. Key market trends, growth factors and opportunities
- 7.4.2. Market size and forecast, by Component
- 7.4.3. Market size and forecast, by Technology
- 7.4.4. Market size and forecast, by Application
- 7.4.5. Market size and forecast, by country
- 7.4.5.1. China
- 7.4.5.1.1. Market size and forecast, by Component
- 7.4.5.1.2. Market size and forecast, by Technology
- 7.4.5.1.3. Market size and forecast, by Application
- 7.4.5.2. Japan
- 7.4.5.2.1. Market size and forecast, by Component
- 7.4.5.2.2. Market size and forecast, by Technology
- 7.4.5.2.3. Market size and forecast, by Application
- 7.4.5.3. India
- 7.4.5.3.1. Market size and forecast, by Component
- 7.4.5.3.2. Market size and forecast, by Technology
- 7.4.5.3.3. Market size and forecast, by Application
- 7.4.5.4. Australia
- 7.4.5.4.1. Market size and forecast, by Component
- 7.4.5.4.2. Market size and forecast, by Technology
- 7.4.5.4.3. Market size and forecast, by Application
- 7.4.5.5. South Korea
- 7.4.5.5.1. Market size and forecast, by Component
- 7.4.5.5.2. Market size and forecast, by Technology
- 7.4.5.5.3. Market size and forecast, by Application
- 7.4.5.6. Rest of Asia-Pacific
- 7.4.5.6.1. Market size and forecast, by Component
- 7.4.5.6.2. Market size and forecast, by Technology
- 7.4.5.6.3. Market size and forecast, by Application
- 7.5. LAMEA
- 7.5.1. Key market trends, growth factors and opportunities
- 7.5.2. Market size and forecast, by Component
- 7.5.3. Market size and forecast, by Technology
- 7.5.4. Market size and forecast, by Application
- 7.5.5. Market size and forecast, by country
- 7.5.5.1. Latin America
- 7.5.5.1.1. Market size and forecast, by Component
- 7.5.5.1.2. Market size and forecast, by Technology
- 7.5.5.1.3. Market size and forecast, by Application
- 7.5.5.2. Middle East
- 7.5.5.2.1. Market size and forecast, by Component
- 7.5.5.2.2. Market size and forecast, by Technology
- 7.5.5.2.3. Market size and forecast, by Application
- 7.5.5.3. Africa
- 7.5.5.3.1. Market size and forecast, by Component
- 7.5.5.3.2. Market size and forecast, by Technology
- 7.5.5.3.3. Market size and forecast, by Application
CHAPTER 8: COMPETITIVE LANDSCAPE
- 8.1. Introduction
- 8.2. Top winning strategies
- 8.3. Product mapping of top 10 player
- 8.4. Competitive dashboard
- 8.5. Competitive heatmap
- 8.6. Top player positioning, 2022
CHAPTER 9: COMPANY PROFILES
- 9.1. DataRobot, Inc.
- 9.1.1. Company overview
- 9.1.2. Key executives
- 9.1.3. Company snapshot
- 9.1.4. Operating business segments
- 9.1.5. Product portfolio
- 9.2. Amazon Web Services, Inc.
- 9.2.1. Company overview
- 9.2.2. Key executives
- 9.2.3. Company snapshot
- 9.2.4. Operating business segments
- 9.2.5. Product portfolio
- 9.2.6. Business performance
- 9.3. Avaamo
- 9.3.1. Company overview
- 9.3.2. Key executives
- 9.3.3. Company snapshot
- 9.3.4. Operating business segments
- 9.3.5. Product portfolio
- 9.3.6. Key strategic moves and developments
- 9.4. IBM Corporation
- 9.4.1. Company overview
- 9.4.2. Key executives
- 9.4.3. Company snapshot
- 9.4.4. Operating business segments
- 9.4.5. Product portfolio
- 9.4.6. Business performance
- 9.4.7. Key strategic moves and developments
- 9.5. Microsoft Corporation
- 9.5.1. Company overview
- 9.5.2. Key executives
- 9.5.3. Company snapshot
- 9.5.4. Operating business segments
- 9.5.5. Product portfolio
- 9.5.6. Business performance
- 9.5.7. Key strategic moves and developments
- 9.6. LeewayHertz
- 9.6.1. Company overview
- 9.6.2. Key executives
- 9.6.3. Company snapshot
- 9.6.4. Operating business segments
- 9.6.5. Product portfolio
- 9.7. Persado, Inc.
- 9.7.1. Company overview
- 9.7.2. Key executives
- 9.7.3. Company snapshot
- 9.7.4. Operating business segments
- 9.7.5. Product portfolio
- 9.8. Aisera
- 9.8.1. Company overview
- 9.8.2. Key executives
- 9.8.3. Company snapshot
- 9.8.4. Operating business segments
- 9.8.5. Product portfolio
- 9.9. Shift Technology
- 9.9.1. Company overview
- 9.9.2. Key executives
- 9.9.3. Company snapshot
- 9.9.4. Operating business segments
- 9.9.5. Product portfolio
- 9.9.6. Key strategic moves and developments
- 9.10. AlphaChat
- 9.10.1. Company overview
- 9.10.2. Key executives
- 9.10.3. Company snapshot
- 9.10.4. Operating business segments
- 9.10.5. Product portfolio
- 9.10.6. Business performance
- 9.10.7. Key strategic moves and developments
