|
|
市場調査レポート
商品コード
1344376
ビデオゲーム市場:デバイス別、年齢層別、プラットフォームタイプ別:2023年~2032年の世界機会分析と産業予測Video Game Market By Device (Smartphones, PC, Consoles), By Age Group (Generation Z, Generation Y, Generation X), By Platform Type (Offline, Online): Global Opportunity Analysis and Industry Forecast, 2023-2032 |
||||||
|
|
|||||||
|
|||||||


| ビデオゲーム市場:デバイス別、年齢層別、プラットフォームタイプ別:2023年~2032年の世界機会分析と産業予測 |
|
出版日: 2023年06月01日
発行: Allied Market Research
ページ情報: 英文 250 Pages
納期: 2~3営業日
|

- 全表示
- 概要
- 図表
- 目次
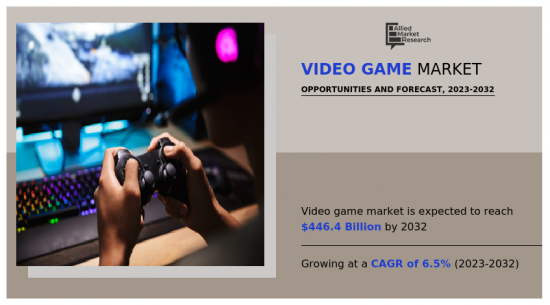
ビデオゲーム市場は2022年に2,314億米ドル、2032年には4,464億米ドルに達し、2023年から2032年までのCAGRは6.5%で成長すると推定されています。
ビデオゲームは、一般的にコントローラーやキーボードを介したユーザーインターフェイスとのインタラクションを伴う電子ゲームで、コンソール、コンピューター、モバイル機器など、さまざまなプラットフォームでプレイされます。ビデオゲームは、数十億米ドル規模の世界の産業となり、人気の娯楽形態に成長しました。アクションゲーム、アドベンチャーゲーム、ロールプレイングゲーム、シミュレーションゲーム、スポーツゲーム、ストラテジーゲームなどがビデオゲームの一例です。一人でもグループでも、ローカルでもオンラインでも楽しめる。ビデオゲームを一種の現実逃避や時間の無駄と考える人がいる一方で、真の芸術であり、教育や訓練のための素晴らしい道具だと考える人もいます。ビデオゲームはゲーマーに達成感を与え、社会的な接触をもたらし、ストレスを緩和することさえあります。それとは対照的に、過度なビデオゲームの使用は、依存症、社会的孤立、身体的健康問題につながる可能性があります。プレイヤーは安全なゲーム行動を実践し、親は子どものビデオゲーム利用を監視しなければならないです。
ゲームとesportsのビジネスはここ10年で大きく成長し、世界中の数多くのesportsリーグを後押ししています。多くの企業やビジネスが、電子ゲームに興味を持つ人々を惹きつけるために、様々なesportsリーグのチーム結成に協力するようになっています。esports競技の台頭は、電子ゲームの認知度を高め、若者がそれを職業として目指すきっかけとなっています。
過去5年間で、ゲーム人口はそれなりのペースで増加しており、年平均増加数は1,760万人、年成長率は5%です。ゲーム人口の増加は、ゲーミングキーボードやマウスといったゲーム周辺機器の販売に拍車をかけています。さまざまなゲーム周辺機器メーカーがesportsリーグと提携し、自社製品の販売促進を図るとともに、新しいゲーミングキーボードの専門性や特性について消費者の認知度を高めています。esports産業の成長がビデオゲーム市場の成長に拍車をかけています。
ゲーム中毒やさまざまなゲームを通じた暴力の促進は、世界中の政府にとって懸念の対象であり、その結果、青少年の憂鬱感や攻撃的な行動が増加しています。その結果、多くの国が参加者の感情的不快感を引き起こす可能性のあるゲームを禁止しています。さらに、多くの国が、ビデオゲームに費やすことのできる時間に制限を設けています。例えば、中国は2021年8月、18歳未満のプレイヤーが休日にオンラインゲームをプレイすることを禁止し、週末にプレイできる時間数を制限しました。この規制は、市場参入企業の成長とユーザーベースを制限します。
クラウド・ゲーミングは、ゲーム・ストリーミング・オンデマンドやゲーム・ストリーミングとも呼ばれ、高品質のゲーム・コンピューターやゲーム・コンソールを必要とせずに、ゲーマーがインターネット上でゲームを放送できるようにする技術です。クラウド・ゲーミングでは、リモート・サーバーでゲームをプレイし、プレイヤーのデバイスにリアルタイムで転送することができるため、迅速で応答性の高いゲームプレイが可能です。クラウドゲーミングは、アクセシビリティの向上、利便性、パフォーマンス、費用対効果など、プレイヤーにさまざまな利点を提供します。代表的なクラウドゲームプラットフォームには、Google Sadia、Amazon Luna、GeForceNow、Microsoft xCloudなどがあります。これらのプラットフォームは、小規模なタイトルからAAA級の超大作まで、多様なゲームのセレクションを提供し、ゲーマーがさまざまなデバイスからアクセスできるようにしています。クラウドゲーミングをより魅力的なものにするために、インターネットインフラをアップグレードし、ストリーミング技術を開発することで、これらの問題に対処しています。クラウドゲーミングは、ユーザーにとってゲームをより身近に、楽しく、費用対効果の高いものにすることで、ビデオゲーム分野を変革する可能性を秘めています。
目次
第1章 イントロダクション
第2章 エグゼクティブサマリー
第3章 市場概要
- 市場の定義と範囲
- 主な調査結果
- 影響要因
- 主な投資機会
- ポーターのファイブフォース分析
- 市場力学
- 促進要因
- 競合マルチプレイヤーゲームの動向の高まり
- 技術の進歩
- Eスポーツ産業の成長
- 抑制要因
- 健康への懸念と中毒関連の問題の増加
- プライバシーに関する懸念
- 機会
- 政府のイニシアチブの増加がゲーム業界を後押し
- クラウド・ゲーミング
- 促進要因
- COVID-19市場への影響分析
第4章 ビデオゲーム市場:デバイス別
- 概要
- スマートフォン
- パソコン
- コンソール
第5章 ビデオゲーム市場:年齢層別
- 概要
- Z世代
- Y世代
- X世代
第6章 ビデオゲーム市場:プラットフォーム別
- 概要
- オフライン
- オンライン
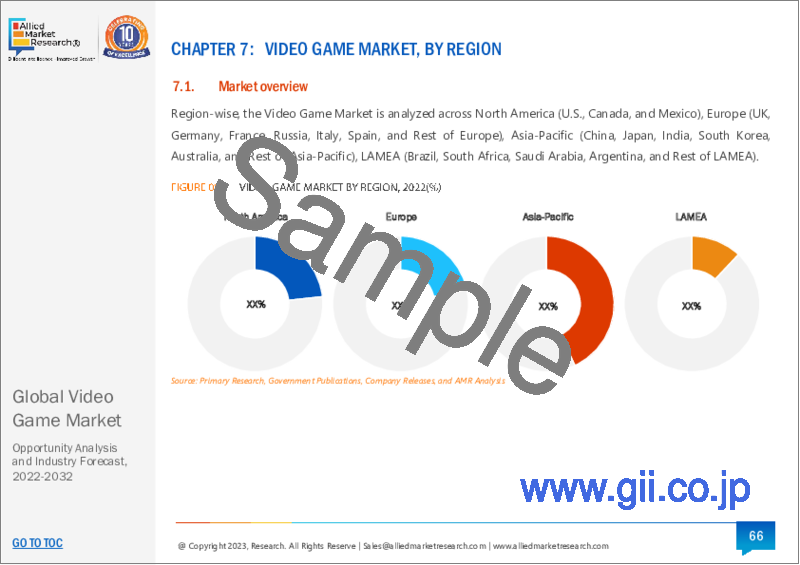
第7章 ビデオゲーム市場:地域別
- 概要
- 北米
- 米国
- カナダ
- メキシコ
- 欧州
- 英国
- ドイツ
- フランス
- ロシア
- イタリア
- スペイン
- その他欧州
- アジア太平洋
- 中国
- 日本
- インド
- 韓国
- オーストラリア
- その他アジア太平洋地域
- ラテンアメリカ・中東・アフリカ
- ブラジル
- 南アフリカ
- サウジアラビア
- アルゼンチン
- その他の地域
第8章 競合情勢
- イントロダクション
- 主要成功戦略
- 主要10社の製品マッピング
- 競合ダッシュボード
- 競合ヒートマップ
- 主要企業のポジショニング、2022年
第9章 企業プロファイル
- Sony Interactive Entertainment Inc.
- Microsoft Corporation
- Nintendo of America Inc.,
- Activision Blizzard, Inc.
- Electronic Arts Inc.
- Epic Games, Inc
- Take-Two Interactive Software, Inc.
- Ubisoft Entertainment.
- Bandai Namco Entertainment America Inc.
- Lucid Games
LIST OF TABLES
- TABLE 01. GLOBAL VIDEO GAME MARKET, BY DEVICE, 2022-2032 ($BILLION)
- TABLE 02. VIDEO GAME MARKET FOR SMARTPHONES, BY REGION, 2022-2032 ($BILLION)
- TABLE 03. VIDEO GAME MARKET FOR PC, BY REGION, 2022-2032 ($BILLION)
- TABLE 04. VIDEO GAME MARKET FOR CONSOLES, BY REGION, 2022-2032 ($BILLION)
- TABLE 05. GLOBAL VIDEO GAME MARKET, BY AGE GROUP, 2022-2032 ($BILLION)
- TABLE 06. VIDEO GAME MARKET FOR GENERATION Z, BY REGION, 2022-2032 ($BILLION)
- TABLE 07. VIDEO GAME MARKET FOR GENERATION Y, BY REGION, 2022-2032 ($BILLION)
- TABLE 08. VIDEO GAME MARKET FOR GENERATION X, BY REGION, 2022-2032 ($BILLION)
- TABLE 09. GLOBAL VIDEO GAME MARKET, BY PLATFORM TYPE, 2022-2032 ($BILLION)
- TABLE 10. VIDEO GAME MARKET FOR OFFLINE, BY REGION, 2022-2032 ($BILLION)
- TABLE 11. VIDEO GAME MARKET FOR ONLINE, BY REGION, 2022-2032 ($BILLION)
- TABLE 12. VIDEO GAME MARKET, BY REGION, 2022-2032 ($BILLION)
- TABLE 13. NORTH AMERICA VIDEO GAME MARKET, BY DEVICE, 2022-2032 ($BILLION)
- TABLE 14. NORTH AMERICA VIDEO GAME MARKET, BY AGE GROUP, 2022-2032 ($BILLION)
- TABLE 15. NORTH AMERICA VIDEO GAME MARKET, BY PLATFORM TYPE, 2022-2032 ($BILLION)
- TABLE 16. NORTH AMERICA VIDEO GAME MARKET, BY COUNTRY, 2022-2032 ($BILLION)
- TABLE 17. U.S. VIDEO GAME MARKET, BY DEVICE, 2022-2032 ($BILLION)
- TABLE 18. U.S. VIDEO GAME MARKET, BY AGE GROUP, 2022-2032 ($BILLION)
- TABLE 19. U.S. VIDEO GAME MARKET, BY PLATFORM TYPE, 2022-2032 ($BILLION)
- TABLE 20. CANADA VIDEO GAME MARKET, BY DEVICE, 2022-2032 ($BILLION)
- TABLE 21. CANADA VIDEO GAME MARKET, BY AGE GROUP, 2022-2032 ($BILLION)
- TABLE 22. CANADA VIDEO GAME MARKET, BY PLATFORM TYPE, 2022-2032 ($BILLION)
- TABLE 23. MEXICO VIDEO GAME MARKET, BY DEVICE, 2022-2032 ($BILLION)
- TABLE 24. MEXICO VIDEO GAME MARKET, BY AGE GROUP, 2022-2032 ($BILLION)
- TABLE 25. MEXICO VIDEO GAME MARKET, BY PLATFORM TYPE, 2022-2032 ($BILLION)
- TABLE 26. EUROPE VIDEO GAME MARKET, BY DEVICE, 2022-2032 ($BILLION)
- TABLE 27. EUROPE VIDEO GAME MARKET, BY AGE GROUP, 2022-2032 ($BILLION)
- TABLE 28. EUROPE VIDEO GAME MARKET, BY PLATFORM TYPE, 2022-2032 ($BILLION)
- TABLE 29. EUROPE VIDEO GAME MARKET, BY COUNTRY, 2022-2032 ($BILLION)
- TABLE 30. UK VIDEO GAME MARKET, BY DEVICE, 2022-2032 ($BILLION)
- TABLE 31. UK VIDEO GAME MARKET, BY AGE GROUP, 2022-2032 ($BILLION)
- TABLE 32. UK VIDEO GAME MARKET, BY PLATFORM TYPE, 2022-2032 ($BILLION)
- TABLE 33. GERMANY VIDEO GAME MARKET, BY DEVICE, 2022-2032 ($BILLION)
- TABLE 34. GERMANY VIDEO GAME MARKET, BY AGE GROUP, 2022-2032 ($BILLION)
- TABLE 35. GERMANY VIDEO GAME MARKET, BY PLATFORM TYPE, 2022-2032 ($BILLION)
- TABLE 36. FRANCE VIDEO GAME MARKET, BY DEVICE, 2022-2032 ($BILLION)
- TABLE 37. FRANCE VIDEO GAME MARKET, BY AGE GROUP, 2022-2032 ($BILLION)
- TABLE 38. FRANCE VIDEO GAME MARKET, BY PLATFORM TYPE, 2022-2032 ($BILLION)
- TABLE 39. RUSSIA VIDEO GAME MARKET, BY DEVICE, 2022-2032 ($BILLION)
- TABLE 40. RUSSIA VIDEO GAME MARKET, BY AGE GROUP, 2022-2032 ($BILLION)
- TABLE 41. RUSSIA VIDEO GAME MARKET, BY PLATFORM TYPE, 2022-2032 ($BILLION)
- TABLE 42. ITALY VIDEO GAME MARKET, BY DEVICE, 2022-2032 ($BILLION)
- TABLE 43. ITALY VIDEO GAME MARKET, BY AGE GROUP, 2022-2032 ($BILLION)
- TABLE 44. ITALY VIDEO GAME MARKET, BY PLATFORM TYPE, 2022-2032 ($BILLION)
- TABLE 45. SPAIN VIDEO GAME MARKET, BY DEVICE, 2022-2032 ($BILLION)
- TABLE 46. SPAIN VIDEO GAME MARKET, BY AGE GROUP, 2022-2032 ($BILLION)
- TABLE 47. SPAIN VIDEO GAME MARKET, BY PLATFORM TYPE, 2022-2032 ($BILLION)
- TABLE 48. REST OF EUROPE VIDEO GAME MARKET, BY DEVICE, 2022-2032 ($BILLION)
- TABLE 49. REST OF EUROPE VIDEO GAME MARKET, BY AGE GROUP, 2022-2032 ($BILLION)
- TABLE 50. REST OF EUROPE VIDEO GAME MARKET, BY PLATFORM TYPE, 2022-2032 ($BILLION)
- TABLE 51. ASIA-PACIFIC VIDEO GAME MARKET, BY DEVICE, 2022-2032 ($BILLION)
- TABLE 52. ASIA-PACIFIC VIDEO GAME MARKET, BY AGE GROUP, 2022-2032 ($BILLION)
- TABLE 53. ASIA-PACIFIC VIDEO GAME MARKET, BY PLATFORM TYPE, 2022-2032 ($BILLION)
- TABLE 54. ASIA-PACIFIC VIDEO GAME MARKET, BY COUNTRY, 2022-2032 ($BILLION)
- TABLE 55. CHINA VIDEO GAME MARKET, BY DEVICE, 2022-2032 ($BILLION)
- TABLE 56. CHINA VIDEO GAME MARKET, BY AGE GROUP, 2022-2032 ($BILLION)
- TABLE 57. CHINA VIDEO GAME MARKET, BY PLATFORM TYPE, 2022-2032 ($BILLION)
- TABLE 58. JAPAN VIDEO GAME MARKET, BY DEVICE, 2022-2032 ($BILLION)
- TABLE 59. JAPAN VIDEO GAME MARKET, BY AGE GROUP, 2022-2032 ($BILLION)
- TABLE 60. JAPAN VIDEO GAME MARKET, BY PLATFORM TYPE, 2022-2032 ($BILLION)
- TABLE 61. INDIA VIDEO GAME MARKET, BY DEVICE, 2022-2032 ($BILLION)
- TABLE 62. INDIA VIDEO GAME MARKET, BY AGE GROUP, 2022-2032 ($BILLION)
- TABLE 63. INDIA VIDEO GAME MARKET, BY PLATFORM TYPE, 2022-2032 ($BILLION)
- TABLE 64. SOUTH KOREA VIDEO GAME MARKET, BY DEVICE, 2022-2032 ($BILLION)
- TABLE 65. SOUTH KOREA VIDEO GAME MARKET, BY AGE GROUP, 2022-2032 ($BILLION)
- TABLE 66. SOUTH KOREA VIDEO GAME MARKET, BY PLATFORM TYPE, 2022-2032 ($BILLION)
- TABLE 67. AUSTRALIA VIDEO GAME MARKET, BY DEVICE, 2022-2032 ($BILLION)
- TABLE 68. AUSTRALIA VIDEO GAME MARKET, BY AGE GROUP, 2022-2032 ($BILLION)
- TABLE 69. AUSTRALIA VIDEO GAME MARKET, BY PLATFORM TYPE, 2022-2032 ($BILLION)
- TABLE 70. REST OF ASIA-PACIFIC VIDEO GAME MARKET, BY DEVICE, 2022-2032 ($BILLION)
- TABLE 71. REST OF ASIA-PACIFIC VIDEO GAME MARKET, BY AGE GROUP, 2022-2032 ($BILLION)
- TABLE 72. REST OF ASIA-PACIFIC VIDEO GAME MARKET, BY PLATFORM TYPE, 2022-2032 ($BILLION)
- TABLE 73. LAMEA VIDEO GAME MARKET, BY DEVICE, 2022-2032 ($BILLION)
- TABLE 74. LAMEA VIDEO GAME MARKET, BY AGE GROUP, 2022-2032 ($BILLION)
- TABLE 75. LAMEA VIDEO GAME MARKET, BY PLATFORM TYPE, 2022-2032 ($BILLION)
- TABLE 76. LAMEA VIDEO GAME MARKET, BY COUNTRY, 2022-2032 ($BILLION)
- TABLE 77. BRAZIL VIDEO GAME MARKET, BY DEVICE, 2022-2032 ($BILLION)
- TABLE 78. BRAZIL VIDEO GAME MARKET, BY AGE GROUP, 2022-2032 ($BILLION)
- TABLE 79. BRAZIL VIDEO GAME MARKET, BY PLATFORM TYPE, 2022-2032 ($BILLION)
- TABLE 80. SOUTH AFRICA VIDEO GAME MARKET, BY DEVICE, 2022-2032 ($BILLION)
- TABLE 81. SOUTH AFRICA VIDEO GAME MARKET, BY AGE GROUP, 2022-2032 ($BILLION)
- TABLE 82. SOUTH AFRICA VIDEO GAME MARKET, BY PLATFORM TYPE, 2022-2032 ($BILLION)
- TABLE 83. SAUDI ARABIA VIDEO GAME MARKET, BY DEVICE, 2022-2032 ($BILLION)
- TABLE 84. SAUDI ARABIA VIDEO GAME MARKET, BY AGE GROUP, 2022-2032 ($BILLION)
- TABLE 85. SAUDI ARABIA VIDEO GAME MARKET, BY PLATFORM TYPE, 2022-2032 ($BILLION)
- TABLE 86. ARGENTINA VIDEO GAME MARKET, BY DEVICE, 2022-2032 ($BILLION)
- TABLE 87. ARGENTINA VIDEO GAME MARKET, BY AGE GROUP, 2022-2032 ($BILLION)
- TABLE 88. ARGENTINA VIDEO GAME MARKET, BY PLATFORM TYPE, 2022-2032 ($BILLION)
- TABLE 89. REST OF LAMEA VIDEO GAME MARKET, BY DEVICE, 2022-2032 ($BILLION)
- TABLE 90. REST OF LAMEA VIDEO GAME MARKET, BY AGE GROUP, 2022-2032 ($BILLION)
- TABLE 91. REST OF LAMEA VIDEO GAME MARKET, BY PLATFORM TYPE, 2022-2032 ($BILLION)
- TABLE 92. SONY INTERACTIVE ENTERTAINMENT INC.: KEY EXECUTIVES
- TABLE 93. SONY INTERACTIVE ENTERTAINMENT INC.: COMPANY SNAPSHOT
- TABLE 94. SONY INTERACTIVE ENTERTAINMENT INC.: SERVICE SEGMENTS
- TABLE 95. SONY INTERACTIVE ENTERTAINMENT INC.: PRODUCT PORTFOLIO
- TABLE 96. MICROSOFT CORPORATION: KEY EXECUTIVES
- TABLE 97. MICROSOFT CORPORATION: COMPANY SNAPSHOT
- TABLE 98. MICROSOFT CORPORATION: SERVICE SEGMENTS
- TABLE 99. MICROSOFT CORPORATION: PRODUCT PORTFOLIO
- TABLE 100. NINTENDO OF AMERICA INC.,: KEY EXECUTIVES
- TABLE 101. NINTENDO OF AMERICA INC.,: COMPANY SNAPSHOT
- TABLE 102. NINTENDO OF AMERICA INC.,: SERVICE SEGMENTS
- TABLE 103. NINTENDO OF AMERICA INC.,: PRODUCT PORTFOLIO
- TABLE 104. NINTENDO OF AMERICA INC.,: KEY STRATERGIES
- TABLE 105. ACTIVISION BLIZZARD, INC.: KEY EXECUTIVES
- TABLE 106. ACTIVISION BLIZZARD, INC.: COMPANY SNAPSHOT
- TABLE 107. ACTIVISION BLIZZARD, INC.: SERVICE SEGMENTS
- TABLE 108. ACTIVISION BLIZZARD, INC.: PRODUCT PORTFOLIO
- TABLE 109. ACTIVISION BLIZZARD, INC.: KEY STRATERGIES
- TABLE 110. ELECTRONIC ARTS INC.: KEY EXECUTIVES
- TABLE 111. ELECTRONIC ARTS INC.: COMPANY SNAPSHOT
- TABLE 112. ELECTRONIC ARTS INC.: SERVICE SEGMENTS
- TABLE 113. ELECTRONIC ARTS INC.: PRODUCT PORTFOLIO
- TABLE 114. ELECTRONIC ARTS INC.: KEY STRATERGIES
- TABLE 115. EPIC GAMES, INC: KEY EXECUTIVES
- TABLE 116. EPIC GAMES, INC: COMPANY SNAPSHOT
- TABLE 117. EPIC GAMES, INC: SERVICE SEGMENTS
- TABLE 118. EPIC GAMES, INC: PRODUCT PORTFOLIO
- TABLE 119. TAKE-TWO INTERACTIVE SOFTWARE, INC.: KEY EXECUTIVES
- TABLE 120. TAKE-TWO INTERACTIVE SOFTWARE, INC.: COMPANY SNAPSHOT
- TABLE 121. TAKE-TWO INTERACTIVE SOFTWARE, INC.: SERVICE SEGMENTS
- TABLE 122. TAKE-TWO INTERACTIVE SOFTWARE, INC.: PRODUCT PORTFOLIO
- TABLE 123. UBISOFT ENTERTAINMENT.: KEY EXECUTIVES
- TABLE 124. UBISOFT ENTERTAINMENT.: COMPANY SNAPSHOT
- TABLE 125. UBISOFT ENTERTAINMENT.: SERVICE SEGMENTS
- TABLE 126. UBISOFT ENTERTAINMENT.: PRODUCT PORTFOLIO
- TABLE 127. BANDAI NAMCO ENTERTAINMENT AMERICA INC.: KEY EXECUTIVES
- TABLE 128. BANDAI NAMCO ENTERTAINMENT AMERICA INC.: COMPANY SNAPSHOT
- TABLE 129. BANDAI NAMCO ENTERTAINMENT AMERICA INC.: SERVICE SEGMENTS
- TABLE 130. BANDAI NAMCO ENTERTAINMENT AMERICA INC.: PRODUCT PORTFOLIO
- TABLE 131. LUCID GAMES: KEY EXECUTIVES
- TABLE 132. LUCID GAMES: COMPANY SNAPSHOT
- TABLE 133. LUCID GAMES: SERVICE SEGMENTS
- TABLE 134. LUCID GAMES: PRODUCT PORTFOLIO
LIST OF FIGURES
- FIGURE 01. VIDEO GAME MARKET, 2022-2032
- FIGURE 02. SEGMENTATION OF VIDEO GAME MARKET, 2022-2032
- FIGURE 03. VIDEO GAME MARKET,2022-2032
- FIGURE 04. TOP INVESTMENT POCKETS IN VIDEO GAME MARKET (2023-2032)
- FIGURE 05. HIGH BARGAINING POWER OF SUPPLIERS
- FIGURE 06. HIGH THREAT OF NEW ENTRANTS
- FIGURE 07. HIGH THREAT OF SUBSTITUTES
- FIGURE 08. MODERATE INTENSITY OF RIVALRY
- FIGURE 09. MODERATE BARGAINING POWER OF BUYERS
- FIGURE 10. GLOBAL VIDEO GAME MARKET:DRIVERS, RESTRAINTS AND OPPORTUNITIES
- FIGURE 11. VIDEO GAME MARKET, BY DEVICE, 2022(%)
- FIGURE 12. COMPARATIVE SHARE ANALYSIS OF VIDEO GAME MARKET FOR SMARTPHONES, BY COUNTRY 2022-2032(%)
- FIGURE 13. COMPARATIVE SHARE ANALYSIS OF VIDEO GAME MARKET FOR PC, BY COUNTRY 2022-2032(%)
- FIGURE 14. COMPARATIVE SHARE ANALYSIS OF VIDEO GAME MARKET FOR CONSOLES, BY COUNTRY 2022-2032(%)
- FIGURE 15. VIDEO GAME MARKET, BY AGE GROUP, 2022(%)
- FIGURE 16. COMPARATIVE SHARE ANALYSIS OF VIDEO GAME MARKET FOR GENERATION Z, BY COUNTRY 2022-2032(%)
- FIGURE 17. COMPARATIVE SHARE ANALYSIS OF VIDEO GAME MARKET FOR GENERATION Y, BY COUNTRY 2022-2032(%)
- FIGURE 18. COMPARATIVE SHARE ANALYSIS OF VIDEO GAME MARKET FOR GENERATION X, BY COUNTRY 2022-2032(%)
- FIGURE 19. VIDEO GAME MARKET, BY PLATFORM TYPE, 2022(%)
- FIGURE 20. COMPARATIVE SHARE ANALYSIS OF VIDEO GAME MARKET FOR OFFLINE, BY COUNTRY 2022-2032(%)
- FIGURE 21. COMPARATIVE SHARE ANALYSIS OF VIDEO GAME MARKET FOR ONLINE, BY COUNTRY 2022-2032(%)
- FIGURE 22. VIDEO GAME MARKET BY REGION, 2022
- FIGURE 23. U.S. VIDEO GAME MARKET, 2022-2032 ($BILLION)
- FIGURE 24. CANADA VIDEO GAME MARKET, 2022-2032 ($BILLION)
- FIGURE 25. MEXICO VIDEO GAME MARKET, 2022-2032 ($BILLION)
- FIGURE 26. UK VIDEO GAME MARKET, 2022-2032 ($BILLION)
- FIGURE 27. GERMANY VIDEO GAME MARKET, 2022-2032 ($BILLION)
- FIGURE 28. FRANCE VIDEO GAME MARKET, 2022-2032 ($BILLION)
- FIGURE 29. RUSSIA VIDEO GAME MARKET, 2022-2032 ($BILLION)
- FIGURE 30. ITALY VIDEO GAME MARKET, 2022-2032 ($BILLION)
- FIGURE 31. SPAIN VIDEO GAME MARKET, 2022-2032 ($BILLION)
- FIGURE 32. REST OF EUROPE VIDEO GAME MARKET, 2022-2032 ($BILLION)
- FIGURE 33. CHINA VIDEO GAME MARKET, 2022-2032 ($BILLION)
- FIGURE 34. JAPAN VIDEO GAME MARKET, 2022-2032 ($BILLION)
- FIGURE 35. INDIA VIDEO GAME MARKET, 2022-2032 ($BILLION)
- FIGURE 36. SOUTH KOREA VIDEO GAME MARKET, 2022-2032 ($BILLION)
- FIGURE 37. AUSTRALIA VIDEO GAME MARKET, 2022-2032 ($BILLION)
- FIGURE 38. REST OF ASIA-PACIFIC VIDEO GAME MARKET, 2022-2032 ($BILLION)
- FIGURE 39. BRAZIL VIDEO GAME MARKET, 2022-2032 ($BILLION)
- FIGURE 40. SOUTH AFRICA VIDEO GAME MARKET, 2022-2032 ($BILLION)
- FIGURE 41. SAUDI ARABIA VIDEO GAME MARKET, 2022-2032 ($BILLION)
- FIGURE 42. ARGENTINA VIDEO GAME MARKET, 2022-2032 ($BILLION)
- FIGURE 43. REST OF LAMEA VIDEO GAME MARKET, 2022-2032 ($BILLION)
- FIGURE 44. TOP WINNING STRATEGIES, BY YEAR
- FIGURE 45. TOP WINNING STRATEGIES, BY DEVELOPMENT
- FIGURE 46. TOP WINNING STRATEGIES, BY COMPANY
- FIGURE 47. PRODUCT MAPPING OF TOP 10 PLAYERS
- FIGURE 48. COMPETITIVE DASHBOARD
- FIGURE 49. COMPETITIVE HEATMAP: VIDEO GAME MARKET
- FIGURE 50. TOP PLAYER POSITIONING, 2022
- FIGURE 51. MICROSOFT CORPORATION: NET REVENUE, 2020-2022 ($MILLION)
- FIGURE 52. MICROSOFT CORPORATION: REVENUE SHARE BY SEGMENT, 2022 (%)
- FIGURE 53. MICROSOFT CORPORATION: REVENUE SHARE BY REGION, 2022 (%)
- FIGURE 54. ACTIVISION BLIZZARD, INC.: NET REVENUE, 2020-2022 ($MILLION)
- FIGURE 55. ACTIVISION BLIZZARD, INC.: REVENUE SHARE BY SEGMENT, 2022 (%)
- FIGURE 56. ACTIVISION BLIZZARD, INC.: REVENUE SHARE BY REGION, 2022 (%)
- FIGURE 57. ELECTRONIC ARTS INC.: RESEARCH & DEVELOPMENT EXPENDITURE, 2020-2022 ($MILLION)
- FIGURE 58. ELECTRONIC ARTS INC.: NET REVENUE, 2020-2022 ($MILLION)
- FIGURE 59. ELECTRONIC ARTS INC.: REVENUE SHARE BY REGION, 2022 (%)
- FIGURE 60. TAKE-TWO INTERACTIVE SOFTWARE, INC.: NET REVENUE, 2020-2022 ($MILLION)
- FIGURE 61. TAKE-TWO INTERACTIVE SOFTWARE, INC.: RESEARCH & DEVELOPMENT EXPENDITURE, 2020-2022 ($MILLION)
- FIGURE 62. TAKE-TWO INTERACTIVE SOFTWARE, INC.: REVENUE SHARE BY REGION, 2022 (%)
According to a new report published by Allied Market Research, titled, "Video Game Market," The video game market was valued at $231.40 billion in 2022, and is estimated to reach $446.4 billion by 2032, growing at a CAGR of 6.5% from 2023 to 2032.
Video games are electronic games that involve interaction with a user interface, typically through a controller or keyboard, and are played on a variety of platforms such as consoles, computers, and mobile devices. Video games have grown to be a popular form of entertainment with a multibillion-dollar global industry. Action, adventure, role-playing, simulation, sports, and strategy games are all examples of video games. They can be played alone or in groups, locally or online. While some consider video games to be a kind of escapism or a waste of time, others consider them to be a true art form and a fantastic instrument for education and training. Video games can give gamers a sense of accomplishment, social contact, and even stress alleviation. In contrast, excessive video game use can lead to addiction, social isolation, and physical health issues. Players must practice safe gaming behaviors, and parents must monitor their children's video game use.
The gaming and esports businesses have grown enormously in the recent decade, giving a boost to numerous esports leagues across the globe. Many corporations and businesses have stepped forward to assist in the formation of teams in various esports leagues to attract people interested in electronic gaming. The rise of esports competitions has raised awareness of electronic gaming and inspired young people to pursue it as a career.
In the last five years, the gaming population has grown at a reasonable rate, with an average annual rise of 17.6 million and an annual growth rate of 5%. The rise in the gaming population has fueled the sales of gaming peripherals such as gaming keyboards and mice. Different gaming peripheral manufacturing companies are going for tie-ups with the esports leagues to promote their product and increase awareness among consumers about the specialization and characteristics of their new gaming keyboards. The increased growth of the esports industry has fueled the growth of the video games market.
Gaming addiction and the promotion of violence through various games have been the subject of concern for governments across the globe, resulting in increased melancholy and aggressive behavior in youngsters. As a result, numerous countries have prohibited games that may cause participant's emotional discomfort. Furthermore, many countries have set time limits for how much time a person can spend playing video games. For example, in August 2021, China prohibited players under the age of 18 from playing online games on holidays and limited the number of hours that may be played on weekends. This regulation restricts the growth of market participants and their user base.
Cloud gaming, also known as game streaming on demand and game streaming, is a technology that allows gamers to broadcast games over the internet without the requirement for a high-quality gaming computer or console. Cloud gaming, which allows games to be played on remote servers with real-time transmission onto the player's device, offers quick and responsive gameplay. Cloud gaming provides various advantages to players, including increased accessibility, convenience, performance, and cost-effectiveness. Some of the most prominent cloud gaming platforms are Google Sadia, Amazon Luna, GeForceNow, and Microsoft xCloud. These platforms provide a diverse selection of games, ranging from small titles to AAA blockbusters, and allow gamers to access them via a variety of devices. These issues are being addressed by upgrading internet infrastructure and developing streaming technology to make cloud gaming more engaging. Cloud gaming has the potential to transform the video game sector by making games more accessible, fun, and cost-effective for users.
Key Benefits For Stakeholders
- This report provides a quantitative analysis of the market segments, current trends, estimations, and dynamics of the video game market analysis from 2022 to 2032 to identify the prevailing video game market opportunities.
- The market research is offered along with information related to key drivers, restraints, and opportunities.
- Porter's five forces analysis highlights the potency of buyers and suppliers to enable stakeholders make profit-oriented business decisions and strengthen their supplier-buyer network.
- In-depth analysis of the video game market segmentation assists to determine the prevailing market opportunities.
- Major countries in each region are mapped according to their revenue contribution to the global market.
- Market player positioning facilitates benchmarking and provides a clear understanding of the present position of the market players.
- The report includes the analysis of the regional as well as global video game market trends, key players, market segments, application areas, and market growth strategies.
Key Market Segments
By Platform Type
- Offline
- Online
By Device
- Smartphones
- PC
- Consoles
By Age Group
- Generation Z
- Generation Y
- Generation X
By Region
- North America
- U.S.
- Canada
- Mexico
- Europe
- UK
- Germany
- France
- Russia
- Italy
- Spain
- Rest of Europe
- Asia-Pacific
- China
- Japan
- India
- South Korea
- Australia
- Rest of Asia-Pacific
- LAMEA
- Brazil
- South Africa
- Saudi Arabia
- Argentina
- Rest of LAMEA
Key Market Players:
- Activision Blizzard, Inc.
- Bandai Namco Entertainment America Inc.
- Electronic Arts Inc.
- Epic Games, Inc
- Lucid Games
- Microsoft Corporation
- Nintendo of America Inc.,
- Sony Interactive Entertainment Inc.
- Take-Two Interactive Software, Inc.
- Ubisoft Entertainment.
TABLE OF CONTENTS
CHAPTER 1: INTRODUCTION
- 1.1. Report description
- 1.2. Key market segments
- 1.3. Key benefits to the stakeholders
- 1.4. Research Methodology
- 1.4.1. Primary research
- 1.4.2. Secondary research
- 1.4.3. Analyst tools and models
CHAPTER 2: EXECUTIVE SUMMARY
- 2.1. CXO Perspective
CHAPTER 3: MARKET OVERVIEW
- 3.1. Market definition and scope
- 3.2. Key findings
- 3.2.1. Top impacting factors
- 3.2.2. Top investment pockets
- 3.3. Porter's five forces analysis
- 3.3.1. High bargaining power of suppliers
- 3.3.2. High threat of new entrants
- 3.3.3. High threat of substitutes
- 3.3.4. Moderate intensity of rivalry
- 3.3.5. Moderate bargaining power of buyers
- 3.4. Market dynamics
- 3.4.1. Drivers
- 3.4.1.1. Rise in Trend of Competitive Multiplayer Games
- 3.4.1.2. Technological Advancements
- 3.4.1.3. Growth in the Esports industry
- 3.4.1. Drivers
- 3.4.2. Restraints
- 3.4.2.1. Growth in Health Concerns and Addiction-Related Issues
- 3.4.2.2. Privacy Concern
- 3.4.3. Opportunities
- 3.4.3.1. An increase in government initiatives boosts the gaming industry
- 3.4.3.2. Cloud gaming
- 3.5. COVID-19 Impact Analysis on the market
CHAPTER 4: VIDEO GAME MARKET, BY DEVICE
- 4.1. Overview
- 4.1.1. Market size and forecast
- 4.2. Smartphones
- 4.2.1. Key market trends, growth factors and opportunities
- 4.2.2. Market size and forecast, by region
- 4.2.3. Market share analysis by country
- 4.3. PC
- 4.3.1. Key market trends, growth factors and opportunities
- 4.3.2. Market size and forecast, by region
- 4.3.3. Market share analysis by country
- 4.4. Consoles
- 4.4.1. Key market trends, growth factors and opportunities
- 4.4.2. Market size and forecast, by region
- 4.4.3. Market share analysis by country
CHAPTER 5: VIDEO GAME MARKET, BY AGE GROUP
- 5.1. Overview
- 5.1.1. Market size and forecast
- 5.2. Generation Z
- 5.2.1. Key market trends, growth factors and opportunities
- 5.2.2. Market size and forecast, by region
- 5.2.3. Market share analysis by country
- 5.3. Generation Y
- 5.3.1. Key market trends, growth factors and opportunities
- 5.3.2. Market size and forecast, by region
- 5.3.3. Market share analysis by country
- 5.4. Generation X
- 5.4.1. Key market trends, growth factors and opportunities
- 5.4.2. Market size and forecast, by region
- 5.4.3. Market share analysis by country
CHAPTER 6: VIDEO GAME MARKET, BY PLATFORM TYPE
- 6.1. Overview
- 6.1.1. Market size and forecast
- 6.2. Offline
- 6.2.1. Key market trends, growth factors and opportunities
- 6.2.2. Market size and forecast, by region
- 6.2.3. Market share analysis by country
- 6.3. Online
- 6.3.1. Key market trends, growth factors and opportunities
- 6.3.2. Market size and forecast, by region
- 6.3.3. Market share analysis by country
CHAPTER 7: VIDEO GAME MARKET, BY REGION
- 7.1. Overview
- 7.1.1. Market size and forecast By Region
- 7.2. North America
- 7.2.1. Key trends and opportunities
- 7.2.2. Market size and forecast, by Device
- 7.2.3. Market size and forecast, by Age Group
- 7.2.4. Market size and forecast, by Platform Type
- 7.2.5. Market size and forecast, by country
- 7.2.5.1. U.S.
- 7.2.5.1.1. Key market trends, growth factors and opportunities
- 7.2.5.1.2. Market size and forecast, by Device
- 7.2.5.1.3. Market size and forecast, by Age Group
- 7.2.5.1.4. Market size and forecast, by Platform Type
- 7.2.5.2. Canada
- 7.2.5.2.1. Key market trends, growth factors and opportunities
- 7.2.5.2.2. Market size and forecast, by Device
- 7.2.5.2.3. Market size and forecast, by Age Group
- 7.2.5.2.4. Market size and forecast, by Platform Type
- 7.2.5.3. Mexico
- 7.2.5.3.1. Key market trends, growth factors and opportunities
- 7.2.5.3.2. Market size and forecast, by Device
- 7.2.5.3.3. Market size and forecast, by Age Group
- 7.2.5.3.4. Market size and forecast, by Platform Type
- 7.3. Europe
- 7.3.1. Key trends and opportunities
- 7.3.2. Market size and forecast, by Device
- 7.3.3. Market size and forecast, by Age Group
- 7.3.4. Market size and forecast, by Platform Type
- 7.3.5. Market size and forecast, by country
- 7.3.5.1. UK
- 7.3.5.1.1. Key market trends, growth factors and opportunities
- 7.3.5.1.2. Market size and forecast, by Device
- 7.3.5.1.3. Market size and forecast, by Age Group
- 7.3.5.1.4. Market size and forecast, by Platform Type
- 7.3.5.2. Germany
- 7.3.5.2.1. Key market trends, growth factors and opportunities
- 7.3.5.2.2. Market size and forecast, by Device
- 7.3.5.2.3. Market size and forecast, by Age Group
- 7.3.5.2.4. Market size and forecast, by Platform Type
- 7.3.5.3. France
- 7.3.5.3.1. Key market trends, growth factors and opportunities
- 7.3.5.3.2. Market size and forecast, by Device
- 7.3.5.3.3. Market size and forecast, by Age Group
- 7.3.5.3.4. Market size and forecast, by Platform Type
- 7.3.5.4. Russia
- 7.3.5.4.1. Key market trends, growth factors and opportunities
- 7.3.5.4.2. Market size and forecast, by Device
- 7.3.5.4.3. Market size and forecast, by Age Group
- 7.3.5.4.4. Market size and forecast, by Platform Type
- 7.3.5.5. Italy
- 7.3.5.5.1. Key market trends, growth factors and opportunities
- 7.3.5.5.2. Market size and forecast, by Device
- 7.3.5.5.3. Market size and forecast, by Age Group
- 7.3.5.5.4. Market size and forecast, by Platform Type
- 7.3.5.6. Spain
- 7.3.5.6.1. Key market trends, growth factors and opportunities
- 7.3.5.6.2. Market size and forecast, by Device
- 7.3.5.6.3. Market size and forecast, by Age Group
- 7.3.5.6.4. Market size and forecast, by Platform Type
- 7.3.5.7. Rest of Europe
- 7.3.5.7.1. Key market trends, growth factors and opportunities
- 7.3.5.7.2. Market size and forecast, by Device
- 7.3.5.7.3. Market size and forecast, by Age Group
- 7.3.5.7.4. Market size and forecast, by Platform Type
- 7.4. Asia-Pacific
- 7.4.1. Key trends and opportunities
- 7.4.2. Market size and forecast, by Device
- 7.4.3. Market size and forecast, by Age Group
- 7.4.4. Market size and forecast, by Platform Type
- 7.4.5. Market size and forecast, by country
- 7.4.5.1. China
- 7.4.5.1.1. Key market trends, growth factors and opportunities
- 7.4.5.1.2. Market size and forecast, by Device
- 7.4.5.1.3. Market size and forecast, by Age Group
- 7.4.5.1.4. Market size and forecast, by Platform Type
- 7.4.5.2. Japan
- 7.4.5.2.1. Key market trends, growth factors and opportunities
- 7.4.5.2.2. Market size and forecast, by Device
- 7.4.5.2.3. Market size and forecast, by Age Group
- 7.4.5.2.4. Market size and forecast, by Platform Type
- 7.4.5.3. India
- 7.4.5.3.1. Key market trends, growth factors and opportunities
- 7.4.5.3.2. Market size and forecast, by Device
- 7.4.5.3.3. Market size and forecast, by Age Group
- 7.4.5.3.4. Market size and forecast, by Platform Type
- 7.4.5.4. South Korea
- 7.4.5.4.1. Key market trends, growth factors and opportunities
- 7.4.5.4.2. Market size and forecast, by Device
- 7.4.5.4.3. Market size and forecast, by Age Group
- 7.4.5.4.4. Market size and forecast, by Platform Type
- 7.4.5.5. Australia
- 7.4.5.5.1. Key market trends, growth factors and opportunities
- 7.4.5.5.2. Market size and forecast, by Device
- 7.4.5.5.3. Market size and forecast, by Age Group
- 7.4.5.5.4. Market size and forecast, by Platform Type
- 7.4.5.6. Rest of Asia-Pacific
- 7.4.5.6.1. Key market trends, growth factors and opportunities
- 7.4.5.6.2. Market size and forecast, by Device
- 7.4.5.6.3. Market size and forecast, by Age Group
- 7.4.5.6.4. Market size and forecast, by Platform Type
- 7.5. LAMEA
- 7.5.1. Key trends and opportunities
- 7.5.2. Market size and forecast, by Device
- 7.5.3. Market size and forecast, by Age Group
- 7.5.4. Market size and forecast, by Platform Type
- 7.5.5. Market size and forecast, by country
- 7.5.5.1. Brazil
- 7.5.5.1.1. Key market trends, growth factors and opportunities
- 7.5.5.1.2. Market size and forecast, by Device
- 7.5.5.1.3. Market size and forecast, by Age Group
- 7.5.5.1.4. Market size and forecast, by Platform Type
- 7.5.5.2. South Africa
- 7.5.5.2.1. Key market trends, growth factors and opportunities
- 7.5.5.2.2. Market size and forecast, by Device
- 7.5.5.2.3. Market size and forecast, by Age Group
- 7.5.5.2.4. Market size and forecast, by Platform Type
- 7.5.5.3. Saudi Arabia
- 7.5.5.3.1. Key market trends, growth factors and opportunities
- 7.5.5.3.2. Market size and forecast, by Device
- 7.5.5.3.3. Market size and forecast, by Age Group
- 7.5.5.3.4. Market size and forecast, by Platform Type
- 7.5.5.4. Argentina
- 7.5.5.4.1. Key market trends, growth factors and opportunities
- 7.5.5.4.2. Market size and forecast, by Device
- 7.5.5.4.3. Market size and forecast, by Age Group
- 7.5.5.4.4. Market size and forecast, by Platform Type
- 7.5.5.5. Rest of LAMEA
- 7.5.5.5.1. Key market trends, growth factors and opportunities
- 7.5.5.5.2. Market size and forecast, by Device
- 7.5.5.5.3. Market size and forecast, by Age Group
- 7.5.5.5.4. Market size and forecast, by Platform Type
CHAPTER 8: COMPETITIVE LANDSCAPE
- 8.1. Introduction
- 8.2. Top winning strategies
- 8.3. Product Mapping of Top 10 Player
- 8.4. Competitive Dashboard
- 8.5. Competitive Heatmap
- 8.6. Top player positioning, 2022
CHAPTER 9: COMPANY PROFILES
- 9.1. Sony Interactive Entertainment Inc.
- 9.1.1. Company overview
- 9.1.2. Key Executives
- 9.1.3. Company snapshot
- 9.1.4. Operating business segments
- 9.1.5. Product portfolio
- 9.2. Microsoft Corporation
- 9.2.1. Company overview
- 9.2.2. Key Executives
- 9.2.3. Company snapshot
- 9.2.4. Operating business segments
- 9.2.5. Product portfolio
- 9.2.6. Business performance
- 9.3. Nintendo of America Inc.,
- 9.3.1. Company overview
- 9.3.2. Key Executives
- 9.3.3. Company snapshot
- 9.3.4. Operating business segments
- 9.3.5. Product portfolio
- 9.3.6. Key strategic moves and developments
- 9.4. Activision Blizzard, Inc.
- 9.4.1. Company overview
- 9.4.2. Key Executives
- 9.4.3. Company snapshot
- 9.4.4. Operating business segments
- 9.4.5. Product portfolio
- 9.4.6. Business performance
- 9.4.7. Key strategic moves and developments
- 9.5. Electronic Arts Inc.
- 9.5.1. Company overview
- 9.5.2. Key Executives
- 9.5.3. Company snapshot
- 9.5.4. Operating business segments
- 9.5.5. Product portfolio
- 9.5.6. Business performance
- 9.5.7. Key strategic moves and developments
- 9.6. Epic Games, Inc
- 9.6.1. Company overview
- 9.6.2. Key Executives
- 9.6.3. Company snapshot
- 9.6.4. Operating business segments
- 9.6.5. Product portfolio
- 9.7. Take-Two Interactive Software, Inc.
- 9.7.1. Company overview
- 9.7.2. Key Executives
- 9.7.3. Company snapshot
- 9.7.4. Operating business segments
- 9.7.5. Product portfolio
- 9.7.6. Business performance
- 9.8. Ubisoft Entertainment.
- 9.8.1. Company overview
- 9.8.2. Key Executives
- 9.8.3. Company snapshot
- 9.8.4. Operating business segments
- 9.8.5. Product portfolio
- 9.9. Bandai Namco Entertainment America Inc.
- 9.9.1. Company overview
- 9.9.2. Key Executives
- 9.9.3. Company snapshot
- 9.9.4. Operating business segments
- 9.9.5. Product portfolio
- 9.10. Lucid Games
- 9.10.1. Company overview
- 9.10.2. Key Executives
- 9.10.3. Company snapshot
- 9.10.4. Operating business segments
- 9.10.5. Product portfolio