 |
市場調査レポート
商品コード
1344318
BFSIにおける拡張アナリティクス市場:コンポーネント別、展開モデル別、企業規模別、用途別:世界の機会分析と産業予測、2023-2032年Augmented Analytics in BFSI Market By Component, By Deployment Model, By Enterprise Size, By Application : Global Opportunity Analysis and Industry Forecast, 2023-2032 |
||||||

| BFSIにおける拡張アナリティクス市場:コンポーネント別、展開モデル別、企業規模別、用途別:世界の機会分析と産業予測、2023-2032年 |
|
出版日: 2023年06月01日
発行: Allied Market Research
ページ情報: 英文 465 Pages
納期: 2~3営業日
|
- 全表示
- 概要
- 図表
- 目次
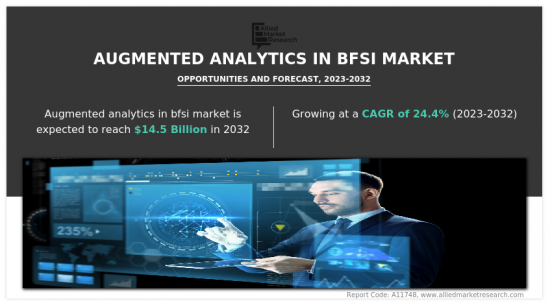
BFSIにおける拡張アナリティクス市場は2022年に17億米ドルと評価され、2032年には145億米ドルに達し、2023年から2032年までのCAGRは24.4%で成長すると予測されています。
BFSI部門では、取引データ、顧客データ、市場データなど、膨大な量のデータが日々生成されるため、これらのデータは非常に貴重なものとなります。このため、拡張知能アナリティクスでは、機械学習、自然言語処理、人工知能などの先進技術を使用してデータ分析プロセスを自動化し、ビジネスユーザーに実用的な洞察を提供します。このため、市場の成長が促進されます。さらに、BFSI部門は規制が厳しく、金融機関はさまざまな規制やガイドラインを遵守する必要があるため、この拡張アナリティクス技術は、これらの機関が規制要件を遵守しながらデータを管理し、より多くの情報に基づいた意思決定を行うのに役立ちます。しかし、BFSI組織は、拡張アナリティクス・ソリューションを採用する際に、顧客データのプライバシーとセキュリティを保護するための適切な対策を確実に講じる必要があります。そのため、これを怠ると、BFSI業界における拡張アナリティクス市場の採用と成長が妨げられる可能性があります。また、組織がこれらの技術を十分に活用するには、技術を理解し効果的に活用できる熟練した専門家が必要であるが、この分野の熟練した専門家が不足しているため、BFSI市場における拡張アナリティクスの採用が妨げられる可能性があります。逆に、機械学習アルゴリズムと拡張アナリティクス技術を統合することで、金融機関はデータのパターン、異常、動向を特定し、リスク評価、不正検出、コンプライアンス監視の改善につなげることができます。したがって、これらの機能は、プロアクティブな意思決定、リスクの軽減、潜在的な損失の防止を可能にします。そのため、エラーの削減や業務ワークフローの改善につながり、最終的には顧客満足度の向上、業務生産性の向上、BFSIセクターの収益性向上につながります。
目次
第1章 イントロダクション
第2章 エグゼクティブサマリー
第3章 市場概要
- 市場の定義と範囲
- 主な調査結果
- 影響要因
- 主な投資機会
- ポーターのファイブフォース分析
- 供給企業の交渉力
- 買い手の交渉力
- 代替品の脅威
- 新規参入業者の脅威
- 競合の激しさ
- 市場力学
- 促進要因
- BFSI業界におけるデータ量の増加
- オンラインバンキングの普及
- コンプライアンス報告の自動化により、アナリティクスの強化がコンプライアンスの確保に貢献
- 抑制要因
- データのプライバシーとセキュリティに関する懸念
- 熟練した専門家の不足
- 機会
- BFSIにおける拡張アナリティクスの利用による業務効率化とコスト削減
- 促進要因
- COVID-19市場への影響分析
第4章 BFSIにおける拡張アナリティクス市場:コンポーネント別
- 概要
- ソリューション
- サービス
第5章 BFSIにおける拡張アナリティクス市場:展開モデル別
- 概要
- オンプレミス
- クラウド
第6章 BFSIにおける拡張アナリティクス市場:企業規模別
- 概要
- 大企業
- 中小企業
第7章 BFSIにおける拡張アナリティクス市場:用途別
- 概要
- リスク・コンプライアンス管理
- 顧客分析
- 不正検知
- ポートフォリオ管理
- その他
第8章 BFSIにおける拡張アナリティクス市場:地域別
- 概要
- 北米
- 米国
- カナダ
- 欧州
- 英国
- ドイツ
- フランス
- イタリア
- スペイン
- その他欧州
- アジア太平洋
- 中国
- 日本
- インド
- オーストラリア
- 韓国
- その他アジア太平洋地域
- ラテンアメリカ
- ラテンアメリカ
- 中東
- アフリカ
第9章 競合情勢
- イントロダクション
- 主要成功戦略
- 主要10社の製品マッピング
- 競合ダッシュボード
- 競合ヒートマップ
- 主要企業のポジショニング、2022年
第10章 企業プロファイル
- Microsoft Corporation
- IBM CORPORATION
- SAP SE
- Salesforce.com, Inc.
- Tableau Software Inc
- QlikTech International AB
- SAS Institute Inc.
- Information builders
- Alteryx, Inc.
LIST OF TABLES
- TABLE 01. GLOBAL AUGMENTED ANALYTICS IN BFSI MARKET, BY COMPONENT, 2022-2032 ($MILLION)
- TABLE 02. AUGMENTED ANALYTICS IN BFSI MARKET FOR SOLUTION, BY REGION, 2022-2032 ($MILLION)
- TABLE 03. AUGMENTED ANALYTICS IN BFSI MARKET FOR SERVICE, BY REGION, 2022-2032 ($MILLION)
- TABLE 04. GLOBAL AUGMENTED ANALYTICS IN BFSI MARKET, BY DEPLOYMENT MODEL, 2022-2032 ($MILLION)
- TABLE 05. AUGMENTED ANALYTICS IN BFSI MARKET FOR ON-PREMISE, BY REGION, 2022-2032 ($MILLION)
- TABLE 06. AUGMENTED ANALYTICS IN BFSI MARKET FOR CLOUD, BY REGION, 2022-2032 ($MILLION)
- TABLE 07. GLOBAL AUGMENTED ANALYTICS IN BFSI MARKET, BY ENTERPRISE SIZE, 2022-2032 ($MILLION)
- TABLE 08. AUGMENTED ANALYTICS IN BFSI MARKET FOR LARGE ENTERPRISES, BY REGION, 2022-2032 ($MILLION)
- TABLE 09. AUGMENTED ANALYTICS IN BFSI MARKET FOR SMALL AND MEDIUM-SIZED ENTERPRISES, BY REGION, 2022-2032 ($MILLION)
- TABLE 10. GLOBAL AUGMENTED ANALYTICS IN BFSI MARKET, BY APPLICATION, 2022-2032 ($MILLION)
- TABLE 11. AUGMENTED ANALYTICS IN BFSI MARKET FOR RISK AND COMPLIANCE MANAGEMENT, BY REGION, 2022-2032 ($MILLION)
- TABLE 12. AUGMENTED ANALYTICS IN BFSI MARKET FOR CUSTOMER ANALYTICS, BY REGION, 2022-2032 ($MILLION)
- TABLE 13. AUGMENTED ANALYTICS IN BFSI MARKET FOR FRAUD DETECTION, BY REGION, 2022-2032 ($MILLION)
- TABLE 14. AUGMENTED ANALYTICS IN BFSI MARKET FOR PORTFOLIO MANAGEMENT, BY REGION, 2022-2032 ($MILLION)
- TABLE 15. AUGMENTED ANALYTICS IN BFSI MARKET FOR OTHERS, BY REGION, 2022-2032 ($MILLION)
- TABLE 16. AUGMENTED ANALYTICS IN BFSI MARKET, BY REGION, 2022-2032 ($MILLION)
- TABLE 17. NORTH AMERICA AUGMENTED ANALYTICS IN BFSI MARKET, BY COMPONENT, 2022-2032 ($MILLION)
- TABLE 18. NORTH AMERICA AUGMENTED ANALYTICS IN BFSI MARKET, BY DEPLOYMENT MODEL, 2022-2032 ($MILLION)
- TABLE 19. NORTH AMERICA AUGMENTED ANALYTICS IN BFSI MARKET, BY ENTERPRISE SIZE, 2022-2032 ($MILLION)
- TABLE 20. NORTH AMERICA AUGMENTED ANALYTICS IN BFSI MARKET, BY APPLICATION, 2022-2032 ($MILLION)
- TABLE 21. NORTH AMERICA AUGMENTED ANALYTICS IN BFSI MARKET, BY COUNTRY, 2022-2032 ($MILLION)
- TABLE 22. U.S. AUGMENTED ANALYTICS IN BFSI MARKET, BY COMPONENT, 2022-2032 ($MILLION)
- TABLE 23. U.S. AUGMENTED ANALYTICS IN BFSI MARKET, BY DEPLOYMENT MODEL, 2022-2032 ($MILLION)
- TABLE 24. U.S. AUGMENTED ANALYTICS IN BFSI MARKET, BY ENTERPRISE SIZE, 2022-2032 ($MILLION)
- TABLE 25. U.S. AUGMENTED ANALYTICS IN BFSI MARKET, BY APPLICATION, 2022-2032 ($MILLION)
- TABLE 26. CANADA AUGMENTED ANALYTICS IN BFSI MARKET, BY COMPONENT, 2022-2032 ($MILLION)
- TABLE 27. CANADA AUGMENTED ANALYTICS IN BFSI MARKET, BY DEPLOYMENT MODEL, 2022-2032 ($MILLION)
- TABLE 28. CANADA AUGMENTED ANALYTICS IN BFSI MARKET, BY ENTERPRISE SIZE, 2022-2032 ($MILLION)
- TABLE 29. CANADA AUGMENTED ANALYTICS IN BFSI MARKET, BY APPLICATION, 2022-2032 ($MILLION)
- TABLE 30. EUROPE AUGMENTED ANALYTICS IN BFSI MARKET, BY COMPONENT, 2022-2032 ($MILLION)
- TABLE 31. EUROPE AUGMENTED ANALYTICS IN BFSI MARKET, BY DEPLOYMENT MODEL, 2022-2032 ($MILLION)
- TABLE 32. EUROPE AUGMENTED ANALYTICS IN BFSI MARKET, BY ENTERPRISE SIZE, 2022-2032 ($MILLION)
- TABLE 33. EUROPE AUGMENTED ANALYTICS IN BFSI MARKET, BY APPLICATION, 2022-2032 ($MILLION)
- TABLE 34. EUROPE AUGMENTED ANALYTICS IN BFSI MARKET, BY COUNTRY, 2022-2032 ($MILLION)
- TABLE 35. UK AUGMENTED ANALYTICS IN BFSI MARKET, BY COMPONENT, 2022-2032 ($MILLION)
- TABLE 36. UK AUGMENTED ANALYTICS IN BFSI MARKET, BY DEPLOYMENT MODEL, 2022-2032 ($MILLION)
- TABLE 37. UK AUGMENTED ANALYTICS IN BFSI MARKET, BY ENTERPRISE SIZE, 2022-2032 ($MILLION)
- TABLE 38. UK AUGMENTED ANALYTICS IN BFSI MARKET, BY APPLICATION, 2022-2032 ($MILLION)
- TABLE 39. GERMANY AUGMENTED ANALYTICS IN BFSI MARKET, BY COMPONENT, 2022-2032 ($MILLION)
- TABLE 40. GERMANY AUGMENTED ANALYTICS IN BFSI MARKET, BY DEPLOYMENT MODEL, 2022-2032 ($MILLION)
- TABLE 41. GERMANY AUGMENTED ANALYTICS IN BFSI MARKET, BY ENTERPRISE SIZE, 2022-2032 ($MILLION)
- TABLE 42. GERMANY AUGMENTED ANALYTICS IN BFSI MARKET, BY APPLICATION, 2022-2032 ($MILLION)
- TABLE 43. FRANCE AUGMENTED ANALYTICS IN BFSI MARKET, BY COMPONENT, 2022-2032 ($MILLION)
- TABLE 44. FRANCE AUGMENTED ANALYTICS IN BFSI MARKET, BY DEPLOYMENT MODEL, 2022-2032 ($MILLION)
- TABLE 45. FRANCE AUGMENTED ANALYTICS IN BFSI MARKET, BY ENTERPRISE SIZE, 2022-2032 ($MILLION)
- TABLE 46. FRANCE AUGMENTED ANALYTICS IN BFSI MARKET, BY APPLICATION, 2022-2032 ($MILLION)
- TABLE 47. ITALY AUGMENTED ANALYTICS IN BFSI MARKET, BY COMPONENT, 2022-2032 ($MILLION)
- TABLE 48. ITALY AUGMENTED ANALYTICS IN BFSI MARKET, BY DEPLOYMENT MODEL, 2022-2032 ($MILLION)
- TABLE 49. ITALY AUGMENTED ANALYTICS IN BFSI MARKET, BY ENTERPRISE SIZE, 2022-2032 ($MILLION)
- TABLE 50. ITALY AUGMENTED ANALYTICS IN BFSI MARKET, BY APPLICATION, 2022-2032 ($MILLION)
- TABLE 51. SPAIN AUGMENTED ANALYTICS IN BFSI MARKET, BY COMPONENT, 2022-2032 ($MILLION)
- TABLE 52. SPAIN AUGMENTED ANALYTICS IN BFSI MARKET, BY DEPLOYMENT MODEL, 2022-2032 ($MILLION)
- TABLE 53. SPAIN AUGMENTED ANALYTICS IN BFSI MARKET, BY ENTERPRISE SIZE, 2022-2032 ($MILLION)
- TABLE 54. SPAIN AUGMENTED ANALYTICS IN BFSI MARKET, BY APPLICATION, 2022-2032 ($MILLION)
- TABLE 55. REST OF EUROPE AUGMENTED ANALYTICS IN BFSI MARKET, BY COMPONENT, 2022-2032 ($MILLION)
- TABLE 56. REST OF EUROPE AUGMENTED ANALYTICS IN BFSI MARKET, BY DEPLOYMENT MODEL, 2022-2032 ($MILLION)
- TABLE 57. REST OF EUROPE AUGMENTED ANALYTICS IN BFSI MARKET, BY ENTERPRISE SIZE, 2022-2032 ($MILLION)
- TABLE 58. REST OF EUROPE AUGMENTED ANALYTICS IN BFSI MARKET, BY APPLICATION, 2022-2032 ($MILLION)
- TABLE 59. ASIA-PACIFIC AUGMENTED ANALYTICS IN BFSI MARKET, BY COMPONENT, 2022-2032 ($MILLION)
- TABLE 60. ASIA-PACIFIC AUGMENTED ANALYTICS IN BFSI MARKET, BY DEPLOYMENT MODEL, 2022-2032 ($MILLION)
- TABLE 61. ASIA-PACIFIC AUGMENTED ANALYTICS IN BFSI MARKET, BY ENTERPRISE SIZE, 2022-2032 ($MILLION)
- TABLE 62. ASIA-PACIFIC AUGMENTED ANALYTICS IN BFSI MARKET, BY APPLICATION, 2022-2032 ($MILLION)
- TABLE 63. ASIA-PACIFIC AUGMENTED ANALYTICS IN BFSI MARKET, BY COUNTRY, 2022-2032 ($MILLION)
- TABLE 64. CHINA AUGMENTED ANALYTICS IN BFSI MARKET, BY COMPONENT, 2022-2032 ($MILLION)
- TABLE 65. CHINA AUGMENTED ANALYTICS IN BFSI MARKET, BY DEPLOYMENT MODEL, 2022-2032 ($MILLION)
- TABLE 66. CHINA AUGMENTED ANALYTICS IN BFSI MARKET, BY ENTERPRISE SIZE, 2022-2032 ($MILLION)
- TABLE 67. CHINA AUGMENTED ANALYTICS IN BFSI MARKET, BY APPLICATION, 2022-2032 ($MILLION)
- TABLE 68. JAPAN AUGMENTED ANALYTICS IN BFSI MARKET, BY COMPONENT, 2022-2032 ($MILLION)
- TABLE 69. JAPAN AUGMENTED ANALYTICS IN BFSI MARKET, BY DEPLOYMENT MODEL, 2022-2032 ($MILLION)
- TABLE 70. JAPAN AUGMENTED ANALYTICS IN BFSI MARKET, BY ENTERPRISE SIZE, 2022-2032 ($MILLION)
- TABLE 71. JAPAN AUGMENTED ANALYTICS IN BFSI MARKET, BY APPLICATION, 2022-2032 ($MILLION)
- TABLE 72. INDIA AUGMENTED ANALYTICS IN BFSI MARKET, BY COMPONENT, 2022-2032 ($MILLION)
- TABLE 73. INDIA AUGMENTED ANALYTICS IN BFSI MARKET, BY DEPLOYMENT MODEL, 2022-2032 ($MILLION)
- TABLE 74. INDIA AUGMENTED ANALYTICS IN BFSI MARKET, BY ENTERPRISE SIZE, 2022-2032 ($MILLION)
- TABLE 75. INDIA AUGMENTED ANALYTICS IN BFSI MARKET, BY APPLICATION, 2022-2032 ($MILLION)
- TABLE 76. AUSTRALIA AUGMENTED ANALYTICS IN BFSI MARKET, BY COMPONENT, 2022-2032 ($MILLION)
- TABLE 77. AUSTRALIA AUGMENTED ANALYTICS IN BFSI MARKET, BY DEPLOYMENT MODEL, 2022-2032 ($MILLION)
- TABLE 78. AUSTRALIA AUGMENTED ANALYTICS IN BFSI MARKET, BY ENTERPRISE SIZE, 2022-2032 ($MILLION)
- TABLE 79. AUSTRALIA AUGMENTED ANALYTICS IN BFSI MARKET, BY APPLICATION, 2022-2032 ($MILLION)
- TABLE 80. SOUTH KOREA AUGMENTED ANALYTICS IN BFSI MARKET, BY COMPONENT, 2022-2032 ($MILLION)
- TABLE 81. SOUTH KOREA AUGMENTED ANALYTICS IN BFSI MARKET, BY DEPLOYMENT MODEL, 2022-2032 ($MILLION)
- TABLE 82. SOUTH KOREA AUGMENTED ANALYTICS IN BFSI MARKET, BY ENTERPRISE SIZE, 2022-2032 ($MILLION)
- TABLE 83. SOUTH KOREA AUGMENTED ANALYTICS IN BFSI MARKET, BY APPLICATION, 2022-2032 ($MILLION)
- TABLE 84. REST OF ASIA-PACIFIC AUGMENTED ANALYTICS IN BFSI MARKET, BY COMPONENT, 2022-2032 ($MILLION)
- TABLE 85. REST OF ASIA-PACIFIC AUGMENTED ANALYTICS IN BFSI MARKET, BY DEPLOYMENT MODEL, 2022-2032 ($MILLION)
- TABLE 86. REST OF ASIA-PACIFIC AUGMENTED ANALYTICS IN BFSI MARKET, BY ENTERPRISE SIZE, 2022-2032 ($MILLION)
- TABLE 87. REST OF ASIA-PACIFIC AUGMENTED ANALYTICS IN BFSI MARKET, BY APPLICATION, 2022-2032 ($MILLION)
- TABLE 88. LAMEA AUGMENTED ANALYTICS IN BFSI MARKET, BY COMPONENT, 2022-2032 ($MILLION)
- TABLE 89. LAMEA AUGMENTED ANALYTICS IN BFSI MARKET, BY DEPLOYMENT MODEL, 2022-2032 ($MILLION)
- TABLE 90. LAMEA AUGMENTED ANALYTICS IN BFSI MARKET, BY ENTERPRISE SIZE, 2022-2032 ($MILLION)
- TABLE 91. LAMEA AUGMENTED ANALYTICS IN BFSI MARKET, BY APPLICATION, 2022-2032 ($MILLION)
- TABLE 92. LAMEA AUGMENTED ANALYTICS IN BFSI MARKET, BY COUNTRY, 2022-2032 ($MILLION)
- TABLE 93. LATIN AMERICA AUGMENTED ANALYTICS IN BFSI MARKET, BY COMPONENT, 2022-2032 ($MILLION)
- TABLE 94. LATIN AMERICA AUGMENTED ANALYTICS IN BFSI MARKET, BY DEPLOYMENT MODEL, 2022-2032 ($MILLION)
- TABLE 95. LATIN AMERICA AUGMENTED ANALYTICS IN BFSI MARKET, BY ENTERPRISE SIZE, 2022-2032 ($MILLION)
- TABLE 96. LATIN AMERICA AUGMENTED ANALYTICS IN BFSI MARKET, BY APPLICATION, 2022-2032 ($MILLION)
- TABLE 97. MIDDLE EAST AUGMENTED ANALYTICS IN BFSI MARKET, BY COMPONENT, 2022-2032 ($MILLION)
- TABLE 98. MIDDLE EAST AUGMENTED ANALYTICS IN BFSI MARKET, BY DEPLOYMENT MODEL, 2022-2032 ($MILLION)
- TABLE 99. MIDDLE EAST AUGMENTED ANALYTICS IN BFSI MARKET, BY ENTERPRISE SIZE, 2022-2032 ($MILLION)
- TABLE 100. MIDDLE EAST AUGMENTED ANALYTICS IN BFSI MARKET, BY APPLICATION, 2022-2032 ($MILLION)
- TABLE 101. AFRICA AUGMENTED ANALYTICS IN BFSI MARKET, BY COMPONENT, 2022-2032 ($MILLION)
- TABLE 102. AFRICA AUGMENTED ANALYTICS IN BFSI MARKET, BY DEPLOYMENT MODEL, 2022-2032 ($MILLION)
- TABLE 103. AFRICA AUGMENTED ANALYTICS IN BFSI MARKET, BY ENTERPRISE SIZE, 2022-2032 ($MILLION)
- TABLE 104. AFRICA AUGMENTED ANALYTICS IN BFSI MARKET, BY APPLICATION, 2022-2032 ($MILLION)
- TABLE 105. MICROSOFT CORPORATION: KEY EXECUTIVES
- TABLE 106. MICROSOFT CORPORATION: COMPANY SNAPSHOT
- TABLE 107. MICROSOFT CORPORATION: SERVICE SEGMENTS
- TABLE 108. MICROSOFT CORPORATION: PRODUCT PORTFOLIO
- TABLE 109. MICROSOFT CORPORATION: KEY STRATERGIES
- TABLE 110. IBM CORPORATION: KEY EXECUTIVES
- TABLE 111. IBM CORPORATION: COMPANY SNAPSHOT
- TABLE 112. IBM CORPORATION: SERVICE SEGMENTS
- TABLE 113. IBM CORPORATION: PRODUCT PORTFOLIO
- TABLE 114. IBM CORPORATION: KEY STRATERGIES
- TABLE 115. SAP SE: KEY EXECUTIVES
- TABLE 116. SAP SE: COMPANY SNAPSHOT
- TABLE 117. SAP SE: SERVICE SEGMENTS
- TABLE 118. SAP SE: PRODUCT PORTFOLIO
- TABLE 119. SAP SE: KEY STRATERGIES
- TABLE 120. SALESFORCE.COM, INC.: KEY EXECUTIVES
- TABLE 121. SALESFORCE.COM, INC.: COMPANY SNAPSHOT
- TABLE 122. SALESFORCE.COM, INC.: SERVICE SEGMENTS
- TABLE 123. SALESFORCE.COM, INC.: PRODUCT PORTFOLIO
- TABLE 124. TABLEAU SOFTWARE INC: KEY EXECUTIVES
- TABLE 125. TABLEAU SOFTWARE INC: COMPANY SNAPSHOT
- TABLE 126. TABLEAU SOFTWARE INC: SERVICE SEGMENTS
- TABLE 127. TABLEAU SOFTWARE INC: PRODUCT PORTFOLIO
- TABLE 128. TABLEAU SOFTWARE INC: KEY STRATERGIES
- TABLE 129. QLIKTECH INTERNATIONAL AB: KEY EXECUTIVES
- TABLE 130. QLIKTECH INTERNATIONAL AB: COMPANY SNAPSHOT
- TABLE 131. QLIKTECH INTERNATIONAL AB: SERVICE SEGMENTS
- TABLE 132. QLIKTECH INTERNATIONAL AB: PRODUCT PORTFOLIO
- TABLE 133. QLIKTECH INTERNATIONAL AB: KEY STRATERGIES
- TABLE 134. SAS INSTITUTE INC.: KEY EXECUTIVES
- TABLE 135. SAS INSTITUTE INC.: COMPANY SNAPSHOT
- TABLE 136. SAS INSTITUTE INC.: SERVICE SEGMENTS
- TABLE 137. SAS INSTITUTE INC.: PRODUCT PORTFOLIO
- TABLE 138. INFORMATION BUILDERS: KEY EXECUTIVES
- TABLE 139. INFORMATION BUILDERS: COMPANY SNAPSHOT
- TABLE 140. INFORMATION BUILDERS: SERVICE SEGMENTS
- TABLE 141. INFORMATION BUILDERS: PRODUCT PORTFOLIO
- TABLE 142. ALTERYX, INC.: KEY EXECUTIVES
- TABLE 143. ALTERYX, INC.: COMPANY SNAPSHOT
- TABLE 144. ALTERYX, INC.: SERVICE SEGMENTS
- TABLE 145. ALTERYX, INC.: PRODUCT PORTFOLIO
- TABLE 146. ALTERYX, INC.: KEY STRATERGIES
LIST OF FIGURES
- FIGURE 01. AUGMENTED ANALYTICS IN BFSI MARKET, 2022-2032
- FIGURE 02. SEGMENTATION OF AUGMENTED ANALYTICS IN BFSI MARKET, 2022-2032
- FIGURE 03. TOP INVESTMENT POCKETS IN AUGMENTED ANALYTICS IN BFSI MARKET (2023-2032)
- FIGURE 04. HIGH TO MODERATE BARGAINING POWER OF SUPPLIERS
- FIGURE 05. HIGH BARGAINING POWER OF BUYERS
- FIGURE 06. MODERATE TO HIGH THREAT OF SUBSTITUTES
- FIGURE 07. HIGH THREAT OF NEW ENTRANTS
- FIGURE 08. HIGH TO MODERATE INTENSITY OF RIVALRY
- FIGURE 09. DRIVERS, RESTRAINTS AND OPPORTUNITIES: GLOBALAUGMENTED ANALYTICS IN BFSI MARKET
- FIGURE 10. AUGMENTED ANALYTICS IN BFSI MARKET, BY COMPONENT, 2022(%)
- FIGURE 11. COMPARATIVE SHARE ANALYSIS OF AUGMENTED ANALYTICS IN BFSI MARKET FOR SOLUTION, BY COUNTRY 2022 AND 2032(%)
- FIGURE 12. COMPARATIVE SHARE ANALYSIS OF AUGMENTED ANALYTICS IN BFSI MARKET FOR SERVICE, BY COUNTRY 2022 AND 2032(%)
- FIGURE 13. AUGMENTED ANALYTICS IN BFSI MARKET, BY DEPLOYMENT MODEL, 2022(%)
- FIGURE 14. COMPARATIVE SHARE ANALYSIS OF AUGMENTED ANALYTICS IN BFSI MARKET FOR ON-PREMISE, BY COUNTRY 2022 AND 2032(%)
- FIGURE 15. COMPARATIVE SHARE ANALYSIS OF AUGMENTED ANALYTICS IN BFSI MARKET FOR CLOUD, BY COUNTRY 2022 AND 2032(%)
- FIGURE 16. AUGMENTED ANALYTICS IN BFSI MARKET, BY ENTERPRISE SIZE, 2022(%)
- FIGURE 17. COMPARATIVE SHARE ANALYSIS OF AUGMENTED ANALYTICS IN BFSI MARKET FOR LARGE ENTERPRISES, BY COUNTRY 2022 AND 2032(%)
- FIGURE 18. COMPARATIVE SHARE ANALYSIS OF AUGMENTED ANALYTICS IN BFSI MARKET FOR SMALL AND MEDIUM-SIZED ENTERPRISES, BY COUNTRY 2022 AND 2032(%)
- FIGURE 19. AUGMENTED ANALYTICS IN BFSI MARKET, BY APPLICATION, 2022(%)
- FIGURE 20. COMPARATIVE SHARE ANALYSIS OF AUGMENTED ANALYTICS IN BFSI MARKET FOR RISK AND COMPLIANCE MANAGEMENT, BY COUNTRY 2022 AND 2032(%)
- FIGURE 21. COMPARATIVE SHARE ANALYSIS OF AUGMENTED ANALYTICS IN BFSI MARKET FOR CUSTOMER ANALYTICS, BY COUNTRY 2022 AND 2032(%)
- FIGURE 22. COMPARATIVE SHARE ANALYSIS OF AUGMENTED ANALYTICS IN BFSI MARKET FOR FRAUD DETECTION, BY COUNTRY 2022 AND 2032(%)
- FIGURE 23. COMPARATIVE SHARE ANALYSIS OF AUGMENTED ANALYTICS IN BFSI MARKET FOR PORTFOLIO MANAGEMENT, BY COUNTRY 2022 AND 2032(%)
- FIGURE 24. COMPARATIVE SHARE ANALYSIS OF AUGMENTED ANALYTICS IN BFSI MARKET FOR OTHERS, BY COUNTRY 2022 AND 2032(%)
- FIGURE 25. AUGMENTED ANALYTICS IN BFSI MARKET BY REGION, 2022
- FIGURE 26. U.S. AUGMENTED ANALYTICS IN BFSI MARKET, 2022-2032 ($MILLION)
- FIGURE 27. CANADA AUGMENTED ANALYTICS IN BFSI MARKET, 2022-2032 ($MILLION)
- FIGURE 28. UK AUGMENTED ANALYTICS IN BFSI MARKET, 2022-2032 ($MILLION)
- FIGURE 29. GERMANY AUGMENTED ANALYTICS IN BFSI MARKET, 2022-2032 ($MILLION)
- FIGURE 30. FRANCE AUGMENTED ANALYTICS IN BFSI MARKET, 2022-2032 ($MILLION)
- FIGURE 31. ITALY AUGMENTED ANALYTICS IN BFSI MARKET, 2022-2032 ($MILLION)
- FIGURE 32. SPAIN AUGMENTED ANALYTICS IN BFSI MARKET, 2022-2032 ($MILLION)
- FIGURE 33. REST OF EUROPE AUGMENTED ANALYTICS IN BFSI MARKET, 2022-2032 ($MILLION)
- FIGURE 34. CHINA AUGMENTED ANALYTICS IN BFSI MARKET, 2022-2032 ($MILLION)
- FIGURE 35. JAPAN AUGMENTED ANALYTICS IN BFSI MARKET, 2022-2032 ($MILLION)
- FIGURE 36. INDIA AUGMENTED ANALYTICS IN BFSI MARKET, 2022-2032 ($MILLION)
- FIGURE 37. AUSTRALIA AUGMENTED ANALYTICS IN BFSI MARKET, 2022-2032 ($MILLION)
- FIGURE 38. SOUTH KOREA AUGMENTED ANALYTICS IN BFSI MARKET, 2022-2032 ($MILLION)
- FIGURE 39. REST OF ASIA-PACIFIC AUGMENTED ANALYTICS IN BFSI MARKET, 2022-2032 ($MILLION)
- FIGURE 40. LATIN AMERICA AUGMENTED ANALYTICS IN BFSI MARKET, 2022-2032 ($MILLION)
- FIGURE 41. MIDDLE EAST AUGMENTED ANALYTICS IN BFSI MARKET, 2022-2032 ($MILLION)
- FIGURE 42. AFRICA AUGMENTED ANALYTICS IN BFSI MARKET, 2022-2032 ($MILLION)
- FIGURE 43. TOP WINNING STRATEGIES, BY YEAR
- FIGURE 44. TOP WINNING STRATEGIES, BY DEVELOPMENT
- FIGURE 45. TOP WINNING STRATEGIES, BY COMPANY
- FIGURE 46. PRODUCT MAPPING OF TOP 10 PLAYERS
- FIGURE 47. COMPETITIVE DASHBOARD
- FIGURE 48. COMPETITIVE HEATMAP: AUGMENTED ANALYTICS IN BFSI MARKET
- FIGURE 49. TOP PLAYER POSITIONING, 2022
- FIGURE 50. MICROSOFT CORPORATION.: NET REVENUE, 2019-2021 ($MILLION)
- FIGURE 51. MICROSOFT CORPORATION.: RESEARCH & DEVELOPMENT EXPENDITURE, 2019-2021 ($MILLION)
- FIGURE 52. MICROSOFT CORPORATION.: REVENUE SHARE BY SEGMENT, 2021 (%)
- FIGURE 53. MICROSOFT CORPORATION.: REVENUE SHARE BY REGION, 2021 (%)
- FIGURE 54. IBM CORPORATION: NET REVENUE, 2020-2022 ($MILLION)
- FIGURE 55. IBM CORPORATION: RESEARCH & DEVELOPMENT EXPENDITURE, 2020-2022 ($MILLION)
- FIGURE 56. IBM CORPORATION: REVENUE SHARE BY SEGMENT, 2022 (%)
- FIGURE 57. IBM CORPORATION: REVENUE SHARE BY REGION, 2022 (%)
- FIGURE 58. SAP SE: NET REVENUE, 2020-2022 ($MILLION)
- FIGURE 59. SAP SE: RESEARCH & DEVELOPMENT EXPENDITURE, 2020-2022 ($MILLION)
- FIGURE 60. SAP SE: REVENUE SHARE BY SEGMENT, 2022 (%)
- FIGURE 61. SAP SE: REVENUE SHARE BY REGION, 2022 (%)
- FIGURE 62. SALESFORCE.COM, INC.: NET REVENUE, 2020-2022 ($MILLION)
- FIGURE 63. SALESFORCE.COM, INC.: RESEARCH & DEVELOPMENT EXPENDITURE, 2020-2022 ($MILLION)
- FIGURE 64. SALESFORCE.COM, INC.: REVENUE SHARE BY SEGMENT, 2022 (%)
- FIGURE 65. SALESFORCE.COM, INC.: REVENUE SHARE BY REGION, 2022 (%)
- FIGURE 66. TABLEAU SOFTWARE INC: NET REVENUE, 2020-2022 ($MILLION)
- FIGURE 67. TABLEAU SOFTWARE INC: RESEARCH & DEVELOPMENT EXPENDITURE, 2020-2022 ($MILLION)
- FIGURE 68. TABLEAU SOFTWARE INC: REVENUE SHARE BY SEGMENT, 2022 (%)
- FIGURE 69. TABLEAU SOFTWARE INC: REVENUE SHARE BY REGION, 2022 (%)
- FIGURE 70. ALTERYX, INC.: NET REVENUE, 2020-2022 ($MILLION)
- FIGURE 71. ALTERYX, INC.: RESEARCH & DEVELOPMENT EXPENDITURE, 2020-2022 ($MILLION)
- FIGURE 72. ALTERYX, INC.: REVENUE SHARE BY REGION, 2022 (%)
According to a new report published by Allied Market Research, titled, "Augmented Analytics in BFSI Market," The augmented analytics in BFSI market was valued at $1.7 billion in 2022, and is estimated to reach $14.5 billion by 2032, growing at a CAGR of 24.4% from 2023 to 2032.
The BFSI sector generates vast amounts of data on a daily basis, including transactional data, customer data, market data, and more thus, this data can be extremely valuable. Therefore, in this case augmented analytics uses advanced technologies such as machine learning, natural language processing, and artificial intelligence to automate the data analysis process and provide actionable insights to business users. Thus, this drives the growth of the market. Furthermore, BFSI sector is highly regulated, and financial institutions are required to comply with various regulations and guidelines thus this augmented analytics technology help these institutions to manage their data and make more informed decisions while adhering to regulatory requirements. However, BFSI organizations need to ensure that they have appropriate measures in place to safeguard the privacy and security of their customers' data while adopting augmented analytics solutions. Hence, failure to do so may hinder the adoption and growth of the augmented analytics market in the BFSI industry. In addition, to fully leverage these technologies, organizations need skilled professionals who are capable of understanding and utilizing them effectively but is a shortage of skilled professionals in this area, which may hinder the adoption of augmented analytics in BFSI market. On the contrary, by integrating machine learning algorithms, augmented analytics technology, financial institutions can identify patterns, anomalies, and trends in their data, leading to improved risk assessment, fraud detection, and compliance monitoring. Hence, these capabilities enable proactive decision-making, mitigating risks, and preventing potential losses. Therefore, this helps to reduce errors and improve operational workflows, and can ultimately enhance customer satisfaction, increase operational productivity, and will drive profitability in BFSI sector.
The augmented analytics In BFSI market is segmented on the basis of component, deployment mode, enterprise size, application, and region. By component, it is segmented into solution and service. By deployment mode, it is segmented into on-premise and cloud. By enterprise size, it is segmented into large enterprises and small and medium-sized enterprises. By application, it is segmented into risk and compliance management, customer analytics, fraud detection, portfolio management, and others. By region, it is analyzed across North America, Europe, Asia-Pacific, and LAMEA.
The report analyzes the profiles of key players operating in augmented analytics in BFSI market such as Alteryx, Inc., IBM Corporation, Information Builders, Microsoft Corporation, QlikTech International AB, SAP SE, Salesforce.com, Inc., SAS Institute Inc., and Tableau Software Inc. These players have adopted various strategies to increase their market penetration and strengthen their position in the augmented analytics in BFSI industry.
Key Benefits For Stakeholders
- This report provides a quantitative analysis of the market segments, current trends, estimations, and dynamics of the augmented analytics in BFSI market analysis from 2022 to 2032 to identify the prevailing augmented analytics in bfsi market opportunities.
- The market research is offered along with information related to key drivers, restraints, and opportunities.
- Porter's five forces analysis highlights the potency of buyers and suppliers to enable stakeholders make profit-oriented business decisions and strengthen their supplier-buyer network.
- In-depth analysis of the augmented analytics in bfsi market segmentation assists to determine the prevailing market opportunities.
- Major countries in each region are mapped according to their revenue contribution to the global market.
- Market player positioning facilitates benchmarking and provides a clear understanding of the present position of the market players.
- The report includes the analysis of the regional as well as global augmented analytics in bfsi market trends, key players, market segments, application areas, and market growth strategies.
Key Market Segments
By Component
- Solution
- Service
By Deployment Model
- On-premise
- Cloud
By Enterprise Size
- Large Enterprises
- Small and Medium-sized Enterprises
By Application
- Risk and Compliance Management
- Customer Analytics
- Fraud Detection
- Portfolio Management
- Others
By Region
- North America
- U.S.
- Canada
- Europe
- UK
- Germany
- France
- Italy
- Spain
- Rest of Europe
- Asia-Pacific
- China
- Japan
- India
- Australia
- South Korea
- Rest of Asia-Pacific
- LAMEA
- Latin America
- Middle East
- Africa
Key Market Players:
- QlikTech International AB
- Information builders
- Microsoft Corporation
- Tableau Software Inc
- IBM CORPORATION
- Salesforce.com, Inc.
- SAP SE
- Alteryx, Inc.
- SAS Institute Inc.
TABLE OF CONTENTS
CHAPTER 1: INTRODUCTION
- 1.1. Report description
- 1.2. Key market segments
- 1.3. Key benefits to the stakeholders
- 1.4. Research Methodology
- 1.4.1. Primary research
- 1.4.2. Secondary research
- 1.4.3. Analyst tools and models
CHAPTER 2: EXECUTIVE SUMMARY
- 2.1. CXO Perspective
CHAPTER 3: MARKET OVERVIEW
- 3.1. Market definition and scope
- 3.2. Key findings
- 3.2.1. Top impacting factors
- 3.2.2. Top investment pockets
- 3.3. Porter's five forces analysis
- 3.3.1. Bargaining power of suppliers
- 3.3.2. Bargaining power of buyers
- 3.3.3. Threat of substitutes
- 3.3.4. Threat of new entrants
- 3.3.5. Intensity of rivalry
- 3.4. Market dynamics
- 3.4.1. Drivers
- 3.4.1.1. Growing data volumes in BFSI industry
- 3.4.1.2. Growing popularity of online banking
- 3.4.1.3. Augmented analytics help to ensure compliance by automating compliance reporting
- 3.4.1. Drivers
- 3.4.2. Restraints
- 3.4.2.1. Data privacy and security concerns
- 3.4.2.2. Lack of skilled professionals
- 3.4.3. Opportunities
- 3.4.3.1. Operational efficiency and cost reduction due to use of augmented analytics in BFSI
- 3.5. COVID-19 Impact Analysis on the market
CHAPTER 4: AUGMENTED ANALYTICS IN BFSI MARKET, BY COMPONENT
- 4.1. Overview
- 4.1.1. Market size and forecast
- 4.2. Solution
- 4.2.1. Key market trends, growth factors and opportunities
- 4.2.2. Market size and forecast, by region
- 4.2.3. Market share analysis by country
- 4.3. Service
- 4.3.1. Key market trends, growth factors and opportunities
- 4.3.2. Market size and forecast, by region
- 4.3.3. Market share analysis by country
CHAPTER 5: AUGMENTED ANALYTICS IN BFSI MARKET, BY DEPLOYMENT MODEL
- 5.1. Overview
- 5.1.1. Market size and forecast
- 5.2. On-premise
- 5.2.1. Key market trends, growth factors and opportunities
- 5.2.2. Market size and forecast, by region
- 5.2.3. Market share analysis by country
- 5.3. Cloud
- 5.3.1. Key market trends, growth factors and opportunities
- 5.3.2. Market size and forecast, by region
- 5.3.3. Market share analysis by country
CHAPTER 6: AUGMENTED ANALYTICS IN BFSI MARKET, BY ENTERPRISE SIZE
- 6.1. Overview
- 6.1.1. Market size and forecast
- 6.2. Large Enterprises
- 6.2.1. Key market trends, growth factors and opportunities
- 6.2.2. Market size and forecast, by region
- 6.2.3. Market share analysis by country
- 6.3. Small and Medium-sized Enterprises
- 6.3.1. Key market trends, growth factors and opportunities
- 6.3.2. Market size and forecast, by region
- 6.3.3. Market share analysis by country
CHAPTER 7: AUGMENTED ANALYTICS IN BFSI MARKET, BY APPLICATION
- 7.1. Overview
- 7.1.1. Market size and forecast
- 7.2. Risk and Compliance Management
- 7.2.1. Key market trends, growth factors and opportunities
- 7.2.2. Market size and forecast, by region
- 7.2.3. Market share analysis by country
- 7.3. Customer Analytics
- 7.3.1. Key market trends, growth factors and opportunities
- 7.3.2. Market size and forecast, by region
- 7.3.3. Market share analysis by country
- 7.4. Fraud Detection
- 7.4.1. Key market trends, growth factors and opportunities
- 7.4.2. Market size and forecast, by region
- 7.4.3. Market share analysis by country
- 7.5. Portfolio Management
- 7.5.1. Key market trends, growth factors and opportunities
- 7.5.2. Market size and forecast, by region
- 7.5.3. Market share analysis by country
- 7.6. Others
- 7.6.1. Key market trends, growth factors and opportunities
- 7.6.2. Market size and forecast, by region
- 7.6.3. Market share analysis by country
CHAPTER 8: AUGMENTED ANALYTICS IN BFSI MARKET, BY REGION
- 8.1. Overview
- 8.1.1. Market size and forecast By Region
- 8.2. North America
- 8.2.1. Key trends and opportunities
- 8.2.2. Market size and forecast, by Component
- 8.2.3. Market size and forecast, by Deployment Model
- 8.2.4. Market size and forecast, by Enterprise Size
- 8.2.5. Market size and forecast, by Application
- 8.2.6. Market size and forecast, by country
- 8.2.6.1. U.S.
- 8.2.6.1.1. Key market trends, growth factors and opportunities
- 8.2.6.1.2. Market size and forecast, by Component
- 8.2.6.1.3. Market size and forecast, by Deployment Model
- 8.2.6.1.4. Market size and forecast, by Enterprise Size
- 8.2.6.1.5. Market size and forecast, by Application
- 8.2.6.2. Canada
- 8.2.6.2.1. Key market trends, growth factors and opportunities
- 8.2.6.2.2. Market size and forecast, by Component
- 8.2.6.2.3. Market size and forecast, by Deployment Model
- 8.2.6.2.4. Market size and forecast, by Enterprise Size
- 8.2.6.2.5. Market size and forecast, by Application
- 8.3. Europe
- 8.3.1. Key trends and opportunities
- 8.3.2. Market size and forecast, by Component
- 8.3.3. Market size and forecast, by Deployment Model
- 8.3.4. Market size and forecast, by Enterprise Size
- 8.3.5. Market size and forecast, by Application
- 8.3.6. Market size and forecast, by country
- 8.3.6.1. UK
- 8.3.6.1.1. Key market trends, growth factors and opportunities
- 8.3.6.1.2. Market size and forecast, by Component
- 8.3.6.1.3. Market size and forecast, by Deployment Model
- 8.3.6.1.4. Market size and forecast, by Enterprise Size
- 8.3.6.1.5. Market size and forecast, by Application
- 8.3.6.2. Germany
- 8.3.6.2.1. Key market trends, growth factors and opportunities
- 8.3.6.2.2. Market size and forecast, by Component
- 8.3.6.2.3. Market size and forecast, by Deployment Model
- 8.3.6.2.4. Market size and forecast, by Enterprise Size
- 8.3.6.2.5. Market size and forecast, by Application
- 8.3.6.3. France
- 8.3.6.3.1. Key market trends, growth factors and opportunities
- 8.3.6.3.2. Market size and forecast, by Component
- 8.3.6.3.3. Market size and forecast, by Deployment Model
- 8.3.6.3.4. Market size and forecast, by Enterprise Size
- 8.3.6.3.5. Market size and forecast, by Application
- 8.3.6.4. Italy
- 8.3.6.4.1. Key market trends, growth factors and opportunities
- 8.3.6.4.2. Market size and forecast, by Component
- 8.3.6.4.3. Market size and forecast, by Deployment Model
- 8.3.6.4.4. Market size and forecast, by Enterprise Size
- 8.3.6.4.5. Market size and forecast, by Application
- 8.3.6.5. Spain
- 8.3.6.5.1. Key market trends, growth factors and opportunities
- 8.3.6.5.2. Market size and forecast, by Component
- 8.3.6.5.3. Market size and forecast, by Deployment Model
- 8.3.6.5.4. Market size and forecast, by Enterprise Size
- 8.3.6.5.5. Market size and forecast, by Application
- 8.3.6.6. Rest of Europe
- 8.3.6.6.1. Key market trends, growth factors and opportunities
- 8.3.6.6.2. Market size and forecast, by Component
- 8.3.6.6.3. Market size and forecast, by Deployment Model
- 8.3.6.6.4. Market size and forecast, by Enterprise Size
- 8.3.6.6.5. Market size and forecast, by Application
- 8.4. Asia-Pacific
- 8.4.1. Key trends and opportunities
- 8.4.2. Market size and forecast, by Component
- 8.4.3. Market size and forecast, by Deployment Model
- 8.4.4. Market size and forecast, by Enterprise Size
- 8.4.5. Market size and forecast, by Application
- 8.4.6. Market size and forecast, by country
- 8.4.6.1. China
- 8.4.6.1.1. Key market trends, growth factors and opportunities
- 8.4.6.1.2. Market size and forecast, by Component
- 8.4.6.1.3. Market size and forecast, by Deployment Model
- 8.4.6.1.4. Market size and forecast, by Enterprise Size
- 8.4.6.1.5. Market size and forecast, by Application
- 8.4.6.2. Japan
- 8.4.6.2.1. Key market trends, growth factors and opportunities
- 8.4.6.2.2. Market size and forecast, by Component
- 8.4.6.2.3. Market size and forecast, by Deployment Model
- 8.4.6.2.4. Market size and forecast, by Enterprise Size
- 8.4.6.2.5. Market size and forecast, by Application
- 8.4.6.3. India
- 8.4.6.3.1. Key market trends, growth factors and opportunities
- 8.4.6.3.2. Market size and forecast, by Component
- 8.4.6.3.3. Market size and forecast, by Deployment Model
- 8.4.6.3.4. Market size and forecast, by Enterprise Size
- 8.4.6.3.5. Market size and forecast, by Application
- 8.4.6.4. Australia
- 8.4.6.4.1. Key market trends, growth factors and opportunities
- 8.4.6.4.2. Market size and forecast, by Component
- 8.4.6.4.3. Market size and forecast, by Deployment Model
- 8.4.6.4.4. Market size and forecast, by Enterprise Size
- 8.4.6.4.5. Market size and forecast, by Application
- 8.4.6.5. South Korea
- 8.4.6.5.1. Key market trends, growth factors and opportunities
- 8.4.6.5.2. Market size and forecast, by Component
- 8.4.6.5.3. Market size and forecast, by Deployment Model
- 8.4.6.5.4. Market size and forecast, by Enterprise Size
- 8.4.6.5.5. Market size and forecast, by Application
- 8.4.6.6. Rest of Asia-Pacific
- 8.4.6.6.1. Key market trends, growth factors and opportunities
- 8.4.6.6.2. Market size and forecast, by Component
- 8.4.6.6.3. Market size and forecast, by Deployment Model
- 8.4.6.6.4. Market size and forecast, by Enterprise Size
- 8.4.6.6.5. Market size and forecast, by Application
- 8.5. LAMEA
- 8.5.1. Key trends and opportunities
- 8.5.2. Market size and forecast, by Component
- 8.5.3. Market size and forecast, by Deployment Model
- 8.5.4. Market size and forecast, by Enterprise Size
- 8.5.5. Market size and forecast, by Application
- 8.5.6. Market size and forecast, by country
- 8.5.6.1. Latin America
- 8.5.6.1.1. Key market trends, growth factors and opportunities
- 8.5.6.1.2. Market size and forecast, by Component
- 8.5.6.1.3. Market size and forecast, by Deployment Model
- 8.5.6.1.4. Market size and forecast, by Enterprise Size
- 8.5.6.1.5. Market size and forecast, by Application
- 8.5.6.2. Middle East
- 8.5.6.2.1. Key market trends, growth factors and opportunities
- 8.5.6.2.2. Market size and forecast, by Component
- 8.5.6.2.3. Market size and forecast, by Deployment Model
- 8.5.6.2.4. Market size and forecast, by Enterprise Size
- 8.5.6.2.5. Market size and forecast, by Application
- 8.5.6.3. Africa
- 8.5.6.3.1. Key market trends, growth factors and opportunities
- 8.5.6.3.2. Market size and forecast, by Component
- 8.5.6.3.3. Market size and forecast, by Deployment Model
- 8.5.6.3.4. Market size and forecast, by Enterprise Size
- 8.5.6.3.5. Market size and forecast, by Application
CHAPTER 9: COMPETITIVE LANDSCAPE
- 9.1. Introduction
- 9.2. Top winning strategies
- 9.3. Product Mapping of Top 10 Player
- 9.4. Competitive Dashboard
- 9.5. Competitive Heatmap
- 9.6. Top player positioning, 2022
CHAPTER 10: COMPANY PROFILES
- 10.1. Microsoft Corporation
- 10.1.1. Company overview
- 10.1.2. Key Executives
- 10.1.3. Company snapshot
- 10.1.4. Operating business segments
- 10.1.5. Product portfolio
- 10.1.6. Business performance
- 10.1.7. Key strategic moves and developments
- 10.2. IBM CORPORATION
- 10.2.1. Company overview
- 10.2.2. Key Executives
- 10.2.3. Company snapshot
- 10.2.4. Operating business segments
- 10.2.5. Product portfolio
- 10.2.6. Business performance
- 10.2.7. Key strategic moves and developments
- 10.3. SAP SE
- 10.3.1. Company overview
- 10.3.2. Key Executives
- 10.3.3. Company snapshot
- 10.3.4. Operating business segments
- 10.3.5. Product portfolio
- 10.3.6. Business performance
- 10.3.7. Key strategic moves and developments
- 10.4. Salesforce.com, Inc.
- 10.4.1. Company overview
- 10.4.2. Key Executives
- 10.4.3. Company snapshot
- 10.4.4. Operating business segments
- 10.4.5. Product portfolio
- 10.4.6. Business performance
- 10.5. Tableau Software Inc
- 10.5.1. Company overview
- 10.5.2. Key Executives
- 10.5.3. Company snapshot
- 10.5.4. Operating business segments
- 10.5.5. Product portfolio
- 10.5.6. Business performance
- 10.5.7. Key strategic moves and developments
- 10.6. QlikTech International AB
- 10.6.1. Company overview
- 10.6.2. Key Executives
- 10.6.3. Company snapshot
- 10.6.4. Operating business segments
- 10.6.5. Product portfolio
- 10.6.6. Key strategic moves and developments
- 10.7. SAS Institute Inc.
- 10.7.1. Company overview
- 10.7.2. Key Executives
- 10.7.3. Company snapshot
- 10.7.4. Operating business segments
- 10.7.5. Product portfolio
- 10.8. Information builders
- 10.8.1. Company overview
- 10.8.2. Key Executives
- 10.8.3. Company snapshot
- 10.8.4. Operating business segments
- 10.8.5. Product portfolio
- 10.9. Alteryx, Inc.
- 10.9.1. Company overview
- 10.9.2. Key Executives
- 10.9.3. Company snapshot
- 10.9.4. Operating business segments
- 10.9.5. Product portfolio
- 10.9.6. Business performance
- 10.9.7. Key strategic moves and developments