|
|
市場調査レポート
商品コード
1650829
世界の決済市場:デジタル取引の動向、採用、未来(2025年)Global Payments Market Report 2025: Trends, Adoption & the Future of Digital Transactions |
||||||
|
|||||||
|
|||||||

| 世界の決済市場:デジタル取引の動向、採用、未来(2025年) |
|
出版日: 2025年02月06日
発行: yStats.com
ページ情報: 英文 105 Pages
納期: 即日から翌営業日
|

全表示
- 概要
- 目次
クレジットカード/デビットカードの利用率は世界全体で40%を超え、オンライン決済の選好をリードしています。
デジタル決済の成長が加速し、2028年までに3兆米ドルを超える
2028年までに、世界の決済収益は3兆米ドルを突破し、アジア太平洋が50%近くを占めると予測されます。非現金取引は2028年までに約3兆ドルに達すると予測され、CAGRで10%を超える成長が見込まれます。
インスタント決済とデジタルウォレットが世界の取引を再形成する
インスタント決済は2023年の15%超から、2028年までに世界取引の20%超になると予測されます。デジタルウォレットは力強い成長を続け、2023年第3四半期には前年同期比で60%を超える伸びを示しました。クレジットカードは依然として支配的で、2024年に75%を超える企業に受け入れられています。
暗号通貨決済の利用者が2024年に5億6,000万人を超え、勢いを増す
暗号通貨は急速に普及しており、世界の暗号通貨所有者は前年同期比で30%以上増加し、2024年に5億6,000万ユーザーを突破しています。ブロックチェーンとDeFiが金融イノベーションを促進し、回答者の60%超が決済にデジタル通貨を使用することに関心を持っています。
AI不正防止が決済セキュリティを強化し、数十億米ドルを節約している
AIを活用した不正検知は普及しつつあり、Visaのモデルは年間約300億米ドルの不正を防止しています。MastercardのAIソリューションは、不正検知の精度を最大300%向上させています。AIはまた、決済効率を高め、Adyenのようなプラットフォームの取引成功率を向上させています。
当レポートでは、世界の決済市場について調査分析し、各地域のデジタル決済の採用状況や、非現金取引総額、決済収益などのデータを提供しています。
目次
第1章 マネジメントサマリー
第2章 世界、デジタル決済の採用と動向
- 重要事項
- デジタル決済の採用と消費者の選好
- 世界、デジタル決済の採用、イノベーション、消費者の選好(2025年1月)(パート1/2)
- 世界、デジタル決済の採用、イノベーション、消費者の選好(2025年1月)(パート2/2)
- 世界、オンラインショッパーに好まれる決済方法、回答者の割合(2024年)
- 世界、オンラインショッピングカートの放棄理由、回答者の割合(2024年)
- 世界、オンラインショッピングのアカウント作成に関する選好、回答者の割合(2024年)
- 世界、オンラインショッピングの意思決定における配送業者の重要性:国別、回答者の割合(2024年)(1/2)
- 世界、オンラインショッピングの意思決定における配送業者の重要性:国別、回答者の割合(2024年)(2/2)
- 地域、デジタル決済の採用
- 米国、デジタル決済の採用:カテゴリ別、オンライン、回答者の割合(2019年・2021年・2023年~2024年)
- 米国、デジタル決済の採用:カテゴリ別、アプリ内、回答者の割合(2019年・2021年・2023年~2024年)
- 米国、デジタル決済の採用:カテゴリ別、店舗内、回答者の割合(2019年・2021年・2023年~2024年)
- 米国、デジタル決済の採用:カテゴリ別、回答者の割合(2024年)
- 米国、デジタルウォレットの採用:カテゴリ別、店舗内、回答者の割合(2024年)
- 米国、デジタルウォレットの採用:カテゴリ別、オンライン、回答者の割合(2024年)
- 米国、デジタルウォレットの採用:カテゴリ別、アプリ内、回答者の割合(2024年)
- 欧州、デジタル決済の採用:カテゴリ別、回答者の割合(2024年)
- 欧州、デジタルウォレットの採用:カテゴリ別、店舗内、デジタル決済ユーザーの割合(2024年)
- 欧州、デジタルウォレットの採用:カテゴリ別、オンライン、デジタル決済ユーザーの割合(2024年)
- 欧州、デジタルウォレットの採用:カテゴリ別、アプリ内、デジタル決済ユーザーの割合(2024年)
第3章 非現金取引の増加
- 重要事項
- 世界/地域の非現金取引の動向
- 世界、非現金取引総額(2018年・2021年~2024年・2028年)
- アジア太平洋、非現金取引総額(2018年・2021年~2024年・2028年)
- 北米、非現金取引総額(2018年・2021年~2024年・2028年)
- 欧州、非現金取引総額(2018年・2021年~2024年・2028年)
- ラテンアメリカ、非現金取引総額(2018年・2021年~2024年・2028年)
- 中東・アフリカ、非現金取引総額(2018年・2021年~2024年・2028年)
- 世界/地域のB2B非現金取引の動向
- 世界、非現金取引総額(2018年・2021年~2024年・2028年)
- アジア太平洋、非現金取引総額(2018年・2021年~2024年・2028年)
- 北米、非現金取引総額(2018年・2021年~2024年・2028年)
- 欧州、非現金取引総額(2018年・2021年~2024年・2028年)
- ラテンアメリカ、非現金取引総額(2018年・2021年~2024年・2028年)
- 中東・アフリカ、非現金取引総額(2018年・2021年~2024年・2028年)
第4章 世界、決済収益と市場金額
- 重要事項
- 決済収益
- 世界、決済収益(2013年・2018年・2020年~2023年・2028年)
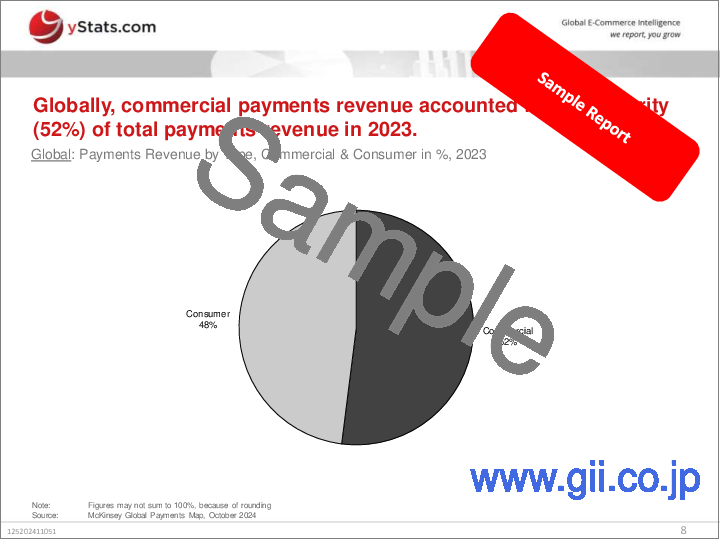
- 世界、決済収益:タイプ別、商業と消費者の割合(2023年)
- 世界、決済収益:タイプ別、商業と消費者の割合、地域別(2023年)
- 世界、決済収益:タイプ別の地域別商業と消費者の割合、決済タイプ別(2023年)
- アジア太平洋、決済収益(2013年・2018年・2020年~2023年)
- アジア太平洋、決済収益:タイプ別、商業と消費者の割合(2018年・2023年)
- 北米、決済収益(2013年・2018年・2020年~2023年)
- 北米、決済収益:タイプ別、商業と消費者の割合(2018年・2023年)
- 欧州・中東・アフリカ、決済収益(2013年・2018年・2020年~2023年)
- 欧州・中東・アフリカ、決済収益:タイプ別、商業と消費者の割合(2018年・2023年)
- ラテンアメリカ、決済収益(2013年・2018年・2020年~2023年)
- ラテンアメリカ、決済収益:タイプ別、商業と消費者の割合(2018年・2023年)
- 米国、POS支出の動向
- 米国のC2B1 POS支出総額(2018年~2023年)
- 米国のC2B1 POS支出総額:セグメント別(2018年~2023年)
- 将来の決済収益の予測
- 世界、決済収益(2027年)
- アジア太平洋、決済収益のシェア(2027年)
- 北米、決済収益のシェア(2027年)
- 欧州・中東・アフリカ、決済収益のシェア(2027年)
- ラテンアメリカ、決済収益のシェア(2027年)
第5章 世界/地域の決済構成:従来の決済と新しい決済
- 重要事項
- 世界/地域の決済構成の動向
- 世界、決済構成、新しい決済と従来の決済、取引高の割合(2023年・2028年)
- 世界、決済方法を受け入れる組織:タイプ別(2022年・2024年)
- 世界、決済タイプ取引:四半期別、前年比増減率(2022年第4四半期~2023年第3四半期)
- アジア太平洋、決済構成、新しい決済と従来の決済、取引高の割合(2023年)
- 北米、決済構成、新しい決済と従来の決済、取引高の割合(2023年)
- 欧州、決済構成、新しい決済と従来の決済、取引高の割合(2023年)
- ラテンアメリカ、決済構成、新しい決済と従来の決済、取引高の割合(2023年)
- 欧州、決済構成、新しい決済と従来の決済、取引高の割合(2023年)
- 中東・アフリカ、決済構成、新しい決済と従来の決済、取引高の割合(2023年)
第6章 決済における暗号通貨
- 重要事項
- 暗号通貨の採用と動向
- 世界、デジタル通貨で決済ができるようにしたいと回答した人の割合(2023年)
- 世界、暗号通貨で購入することに関心がある購入のタイプ、回答者の割合(2023年)
- 世界、暗号通貨・ブロックチェーン市場の概要(2025年1月)
- 暗号通貨所有:地域別
- 世界、暗号通貨所有者数(2023年・2024年)
- アジア、暗号通貨所有者数(2023年・2024年)
- 北米、暗号通貨所有者数(2023年・2024年)
- 欧州、暗号通貨所有者数(2023年・2024年)
- オセアニア、暗号通貨所有者数(2023年・2024年)
- 南米、暗号通貨所有者数(2023年・2024年)
- アフリカ、暗号通貨所有者数(2023年・2024年)
- 消費者行動と暗号通貨
- 世界、デジタル通貨を所有し使用する人口の割合(2024年)
- 世界、暗号通貨を受け入れられたら好きなオンラインストアでより頻繁に買い物をすると回答した人の割合(2023年)
- 世界、暗号通貨を受け入れられたらオンラインでの支出を増やすと回答した人の割合(2023年)
第7章 決済におけるAI
- 重要事項
- 決済におけるAIの概要
- 世界、決済におけるAIの価値
- 世界、金融サービス企業のAIとMLの利用に関する主な戦略の内訳(2023年第1四半期)
- 生成AIと不正防止
- 世界、銀行による生成AIへの支出
- 世界、不正行為対策に生成AIの利用を検討している金融機関の割合(2024年)
- 世界、金融サービスにおけるAIを活用した不正防止とリスク管理(2025年1月)
- 顧客体験と将来のイノベーション
- 世界、AIに最適化された決済、リスク管理、顧客体験(2025年1月)
- 世界、決済におけるAI提携と将来のイノベーション(2025年1月)
Credit/debit cards globally lead online payment preferences with over 40% usage while digital wallets comes in second with over 20% in 2024, according to the latest yStats.com report.
Digital Payments Growth Accelerates, Set to Exceed USD 3 Trillion by 2028
By 2028, global payments revenue is expected to surpass USD 3 trillion, with Asia-Pacific leading, contributing nearly 50%. Non-cash transactions are projected to grow at over +10% CAGR, reaching almost 3 trillion by 2028.
Instant Payments and Digital Wallets Reshape Global Transactions
Instant payments are forecast to rise from over 15% in 2023 to over 20% of global transactions by 2028. Digital wallets continue strong growth, with more than +60% YoY increase in Q3 2023. Credit cards remain dominant, accepted by over 75% of businesses in 2024.
Crypto Payments Gain Traction as Users Exceed 560 Million in 2024
Cryptocurrency adoption has surged, with global crypto ownership up +30% YoY, surpassing 560 million users in 2024. Blockchain and DeFi are driving financial innovation, with more than 60% of respondents interested in using digital currencies for payments.
AI Fraud Prevention Strengthens Payment Security, Saving Billions
AI-driven fraud detection is gaining traction, with Visa's model preventing nearly USD 30 billion in fraud annually. Mastercard's AI solutions boost fraud detection accuracy by up to 300%. AI also enhances payment efficiency, improving transaction success rates for platforms like Adyen.
Table of Contents
1. Management Summary
2. Global Digital Payments Adoption and Trends
- 2.1. Key Takeaways
- 2.2. Digital Payments Adoption & Consumer Preferences
- Global: Digital Payments Adoption, Innovations and Consumer Preferences, January 2025 (Part 1 of 2)
- Global: Digital Payments Adoption, Innovations and Consumer Preferences, January 2025 (Part 2 of 2)
- Global: Online Payment Methods Preferred by Shoppers, in % of Respondents, 2024
- Global: Reasons for Online Shopping Cart Abandonment, in % of Respondents, 2024
- Global: Online Shopper Preferences for Account Creation, in % of Respondents, 2024
- Global: Importance of Delivery Providers in Online Shopping Decisions, by Country, in % of Respondents, 2024 (1 of 2)
- Global: Importance of Delivery Providers in Online Shopping Decisions, by Country, in % of Respondents, 2024 (2 of 2)
- 2.3. Regional Digital Payments Adoption
- USA: Digital Payments Adoption by Category: Online, in % of respondents, 2019, 2021, 2023-2024
- USA: Digital Payments Adoption by Category: In-App, in % of respondents, 2019, 2021, 2023-2024
- USA: Digital Payments Adoption by Category: In-Store, in % of respondents, 2019, 2021, 2023-2024
- USA: Digital Payments Adoption by Category, in % of respondents, 2024
- USA: Digital Wallets Adoption by Category: In-Store, in % of respondents, 2024
- USA: Digital Wallets Adoption by Category: Online, in % of respondents, 2024
- USA: Digital Wallets Adoption by Category: In-App, in % of respondents, 2024
- Europe: Digital Payments Adoption by Category, in % of respondents, 2024
- Europe: Digital Wallets Adoption by Category: In-Store, in % of Digital Payment Users, 2024
- Europe: Digital Wallets Adoption by Category: Online, in % of Digital Payment Users, 2024
- Europe: Digital Wallets Adoption by Category: In-App, in % of Digital Payment Users, 2024
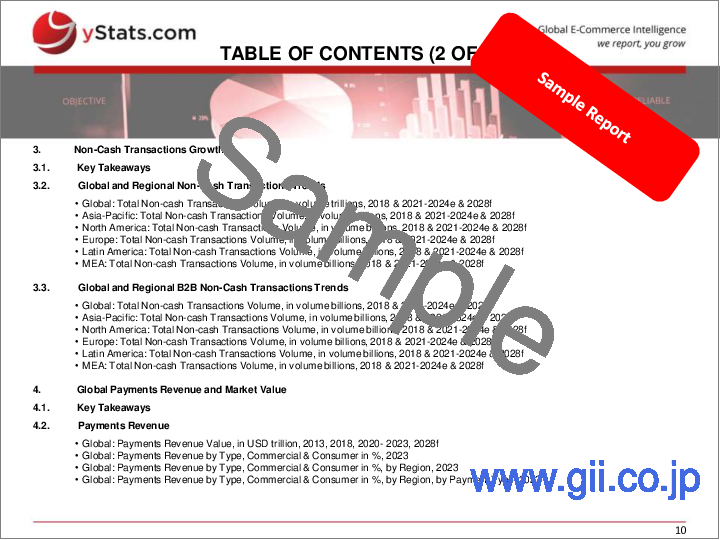
3. Non-Cash Transactions Growth
- 3.1. Key Takeaways
- 3.2. Global and Regional Non-Cash Transactions Trends
- Global: Total Non-cash Transactions Volume, in volume trillions, 2018 & 2021-2024e & 2028f
- Asia-Pacific: Total Non-cash Transactions Volume, in volume billions, 2018 & 2021-2024e & 2028f
- North America: Total Non-cash Transactions Volume, in volume billions, 2018 & 2021-2024e & 2028f
- Europe: Total Non-cash Transactions Volume, in volume billions, 2018 & 2021-2024e & 2028f
- Latin America: Total Non-cash Transactions Volume, in volume billions, 2018 & 2021-2024e & 2028f
- MEA: Total Non-cash Transactions Volume, in volume billions, 2018 & 2021-2024e & 2028f
- 3.3. Global and Regional B2B Non-Cash Transactions Trends
- Global: Total Non-cash Transactions Volume, in volume billions, 2018 & 2021-2024e & 2028f
- Asia-Pacific: Total Non-cash Transactions Volume, in volume billions, 2018 & 2021-2024e & 2028f
- North America: Total Non-cash Transactions Volume, in volume billions, 2018 & 2021-2024e & 2028f
- Europe: Total Non-cash Transactions Volume, in volume billions, 2018 & 2021-2024e & 2028f
- Latin America: Total Non-cash Transactions Volume, in volume billions, 2018 & 2021-2024e & 2028f
- MEA: Total Non-cash Transactions Volume, in volume billions, 2018 & 2021-2024e & 2028f
4. Global Payments Revenue and Market Value
- 4.1. Key Takeaways
- 4.2. Payments Revenue
- Global: Payments Revenue Value, in USD trillion, 2013, 2018, 2020- 2023, 2028f
- Global: Payments Revenue by Type, Commercial & Consumer in %, 2023
- Global: Payments Revenue by Type, Commercial & Consumer in %, by Region, 2023
- Global: Payments Revenue by Type, Commercial & Consumer in %, by Region, by Payment Type, 2023
- Asia-Pacific: Payments Revenue Value, in USD trillion, 2013, 2018, 2020- 2023
- Asia-Pacific: Payments Revenue by Type, Commercial & Consumer in %, 2018 & 2023
- North America: Payments Revenue Value, in USD trillion, 2013, 2018, 2020- 2023
- North America: Payments Revenue by Type, Commercial & Consumer in %, 2018 & 2023
- Europe, Middle East, and Africa: Payments Revenue Value, in USD trillion, 2013, 2018, 2020- 2023
- Europe, Middle East, and Africa: Payments Revenue by Type, Commercial & Consumer in %, 2018 & 2023
- Latin America: Payments Revenue Value, in USD trillion, 2013, 2018, 2020- 2023
- Latin America: Payments Revenue by Type, Commercial & Consumer in %, 2018 & 2023
- 4.3. U.S. Point-of-Sale Spend Trends
- USA: Total C2B1 point-of-sale spend, in USD trillion, 2018-2023
- USA: Total C2B1 point-of-sale spend by segment, in %, 2018-2023
- 4.4. Future Payment Revenue Projections
- Global: Payment Revenue Value, in USD trillion, 2027f
- Asia-Pacific: Share of Payment Revenue Value, in %, 2027f
- North America: Share of Payment Revenue Value, in %, 2027f
- EMEA: Share of Payment Revenue Value, in %, 2027f
- Latin America: Share of Payment Revenue Value, in %, 2027f
5. Global & Regional Payment Mix: Traditional vs. New Payments
- 5.1. Key Takeaways
- 5.2. Global and Regional Payment Mix Trends
- Global: Payment Mix: New Payments vs Traditional Payments, In % of transaction volume, 2023 & 2028f
- Global: Organizations Accepting Payment Methods, by Type, in %, 2022 & 2024
- Global: Payment Type Transactions, by Quarter, in % Year-Over-Year Change, Q4 2022 - Q3 2023
- APAC: Payment Mix: New Payments vs Traditional Payments, In %of transaction volume, 2023
- North America: Payment Mix: New Payments vs Traditional Payments, In % of transaction volume, 2023
- Europe: Payment Mix: New Payments vs Traditional Payments, In %of transaction volume, 2023
- Latin America: Payment Mix: New Payments vs Traditional Payments, In %of transaction volume, 2023
- Europe: Payment Mix: New Payments vs Traditional Payments, In %of transaction volume, 2023
- MEA: Payment Mix: New Payments vs Traditional Payments, In %of transaction volume, 2023
6. Cryptocurrency in Payments
- 6.1. Key Takeaways
- 6.2. Cryptocurrency Adoption and Trends
- Global: Share of Respondents Who Would Like to Be Able to Make Payments in Digital Currencies, in %, 2023
- Global: Type of Purchases Respondents Are Interested in Making With Crypto, in % of Respondents, 2023
- Global: Overview of the Cryptocurrency And Blockchain Market, January 2025
- 6.3. Cryptocurrency Ownership by Region
- Global: Number of Cryptocurrency Owners, in millions, 2023 & 2024e
- Asia: Number of Cryptocurrency Owners, in millions, 2023 & 2024e
- North America: Number of Cryptocurrency Owners, in millions, 2023 & 2024e
- Europe: Number of Cryptocurrency Owners, in millions, 2023 & 2024e
- Oceania: Number of Cryptocurrency Owners, in millions, 2023 & 2024e
- South America: Number of Cryptocurrency Owners, in millions, 2023 & 2024e
- Africa: Number of Cryptocurrency Owners, in millions, 2023 & 2024e
- 6.4. Consumer Behavior & Cryptocurrency
- Global: Share of Population That Owns And Uses Digital Currency, in %, 2024e
- Global: Share of Respondents Who Would Shop More Frequently at Their Preferred Online Stores If They Accepted Cryptocur., in %, 2023
- Global: Share of Respondents Who Would Spend More Online If Cryptocurrencies Were Accepted, in %, 2023
7. AI in Payments
- 7.1. Key Takeaways
- 7.2. Overview AI in Payments
- Global: Value of AI in Payments, in USD billion, 2023 & 2031f
- Global: Breakdown of Financial Service Companies' Primary Strategy for Use of AI and ML, in %, Q1 2023
- 7.3. Generative AI and Fraud Prevention
- Global: Spend by Banks on Generative AI, in USD billion, 2024e & 2030f
- Global: Share of Financial Institutions Eyeing Generative AI Use For Fighting Fraud, in %, 2024e
- Global: AI-Driven Fraud Prevention and Risk Management in Financial Services, January 2025
- 7.4. Customer Experience and Future Innovations
- Global: AI-Optimized Payments, Risk Management, and Customer Experience, January 2025
- Global: AI Collaboration and Future Innovations in Payments, January 2025

