|
|
市場調査レポート
商品コード
1542542
プロセス分光法の世界市場調査レポート:産業分析、規模、シェア、成長、動向、2024年から2032年までの予測Global Process Spectroscopy Market Research Report - Industry Analysis, Size, Share, Growth, Trends and Forecast 2024 to 2032 |
||||||
|
|||||||
カスタマイズ可能
|
|||||||

| プロセス分光法の世界市場調査レポート:産業分析、規模、シェア、成長、動向、2024年から2032年までの予測 |
|
出版日: 2024年07月01日
発行: Value Market Research
ページ情報: 英文 170 Pages
納期: 即日から翌営業日
|

全表示
- 概要
- 図表
- 目次
プロセス分光市場の世界需要は、2023年の215億5,000万米ドルから2032年には602億4,000万米ドル近くの市場規模に達すると推定され、調査期間2024年~2032年のCAGRは12.1%です。
プロセス分光法は、化学組成、分子構造、物質の物理的特性を工業製造プロセス中にリアルタイムで分析・監視するために使用される技術です。赤外(IR)、近赤外(NIR)、ラマン、紫外可視(UV-Vis)分光法などの分光法を用いて、サンプル中の分子による光の吸収、放出、散乱を測定します。これらのシステムは、医薬品、化学薬品、飲食品、石油化学など様々な産業において、化学組成、濃度、純度、反応速度などのパラメータをモニターするために、生産ラインやプロセス装置に組み込まれています。製造作業中の原料、中間体、最終製品の迅速で非破壊的な分析を提供することで、プロセスの最適化、品質管理、規制遵守を可能にします。
市場力学
プロセス分光市場は、製造、プロセス制御、品質保証の状況を形成するいくつかの重要な要因によって牽引されています。第一に、リアルタイムのプロセスモニタリング、品質管理、製品最適化に対する需要の高まりが、これらのソリューションの市場成長を後押ししています。非破壊で材料や製品の化学組成、分子構造、物理特性をインラインで分析できるからです。さらに、NIR、ラマン、FTIR、UV-Vis分光法などの分光技術の進歩により、医薬品、飲食品、化学薬品、素材製造などの多様な産業において、原材料、中間製品、最終製品の迅速、正確かつコスト効率の高い分析が可能になります。
さらに、規制遵守、製品の安全性、品質基準が重視されるようになったことで、トレーサビリティ、データの完全性、規制要件へのコンプライアンスを提供し、製造プロセスにおける製品の品質、一貫性、安全性を確保する分光ソリューションへの投資が活発化しています。さらに、自動プロセス制御システム、SCADAシステム、MESプラットフォームにプロセス分光法を組み込むことで、リアルタイムのデータ取得、分析、意思決定が可能になり、製造オペレーションの効率、生産性、コスト削減の強化につながります。さらに、医薬品製造、バイオテクノロジー、化学処理、食品加工などのエンドユーザー産業の成長により、業界固有の要件やコンプライアンス基準に合わせたプロセス分光用途の市場成長と技術革新の機会が生まれています。しかし、プロセス分光ソリューションの導入における初期投資コストの高さと技術的な複雑さが、今後数年間の市場成長の妨げになる可能性があります。
本レポートでは、ポーターのファイブフォースモデル、市場の魅力分析、バリューチェーン分析を取り上げています。これらのツールは、業界の構造を明確に把握し、世界レベルでの競合の魅力を評価するのに役立ちます。さらに、これらのツールは、プロセス分光法の世界市場における各セグメントを包括的に評価することもできます。プロセス分光学産業の成長と動向は、この研究に全体的なアプローチを提供します。
市場セグメンテーション
プロセス分光法市場レポートのこのセクションでは、国別および地域別にセグメントを分析することで、セグメントに関する詳細なデータを提供し、それによって戦略家が、今後のビジネスチャンスとともに、それぞれの製品やサービスのターゲット層を特定するのに役立ちます。
技術別
- 分子分光法
- 質量分析
- 原子分光法
用途別
- ポリマー
- 石油・ガス
- 製薬
- 食品・農業
- 化学
- 上下水道
- パルプ・製紙
- 金属・鉱業
- その他
コンポーネント別
- ハードウェア
- ソフトウェア
地域分析
このセクションでは、北米、欧州、アジア太平洋、ラテンアメリカ、中東&アフリカにおけるプロセス分光法市場の現在と将来の需要を強調する地域展望をカバーしています。さらに、すべての主要地域における個々の用途セグメントの需要・推定・予測にも焦点を当てています。
カスタム要件がある場合は、お問い合わせください。当社の調査チームは、お客様のニーズに応じてカスタマイズしたレポートを提供することができます。
目次
第1章 序文
第2章 エグゼクティブサマリー
- 市場のハイライト
- 世界市場スナップショット
第3章 プロセス分光分析- 産業分析
- イントロダクション:市場力学
- 市場促進要因
- 市場抑制要因
- 市場機会
- 業界動向
- ポーターのファイブフォース分析
- 市場の魅力分析
第4章 バリューチェーン分析
- バリューチェーン分析
- 原材料分析
- 原材料リスト
- 原材料メーカーリスト
- 主要原材料の価格動向
- 潜在的バイヤーのリスト
- マーケティングチャネル
- ダイレクトマーケティング
- インダイレクトマーケティング
- マーケティングチャネル発展動向
第5章 プロセス分光の世界市場分析:技術別
- 技術別概要
- 実績データと予測データ
- 技術別分析
- 分子分光法
- 質量分光法
- 原子分光法
第6章 プロセス分光法の世界市場分析:用途別
- 概要:用途別
- 実績データと予測データ
- 分析:用途別
- ポリマー
- 石油・ガス
- 製薬
- 食品・農業
- 化学
- 上下水道
- パルプ・製紙
- 金属・鉱業
- その他
第7章 プロセス分光法の世界市場分析:コンポーネント別
- コンポーネント別概要
- 実績データと予測データ
- コンポーネント別分析
- ハードウェア
- ソフトウェア
第8章 プロセス分光の世界市場分析:地域別
- 地域別展望
- イントロダクション
- 北米売上分析
- 概要、実績と予測
- 北米:セグメント別
- 北米国別
- 米国
- カナダ
- メキシコ
- 欧州売上分析
- 概要、実績と予測
- 欧州セグメント別
- 欧州:国別
- 英国
- フランス
- ドイツ
- イタリア
- ロシア
- その他欧州
- アジア太平洋売上分析
- 概要、実績と予測
- アジア太平洋:セグメント別
- アジア太平洋:国別
- 中国
- インド
- 日本
- 韓国
- オーストラリア
- 東南アジア
- その他アジア太平洋
- ラテンアメリカ売上分析
- 概要、実績と予測
- ラテンアメリカ:セグメント別
- ラテンアメリカ:国別
- ブラジル
- アルゼンチン
- ペルー
- チリ
- その他ラテンアメリカ
- 中東・アフリカ売上分析
- 概要、実績と予測
- 中東・アフリカ:セグメント別
- 中東・アフリカ:国別
- サウジアラビア
- アラブ首長国連邦
- イスラエル
- 南アフリカ
- その他中東とアフリカ
第9章 プロセス分光分析企業の競合情勢
- プロセス分光市場競合
- 提携・協力・合意
- 合併・買収
- 新製品発表
- その他の開発
第10章 企業プロファイル
- 企業シェア分析
- 市場集中度
- ABB Group
- Agilent Technologies Inc.
- Bruker
- Danaher Corporation
- Foss
- HORIBA Ltd.
- Kaiser Optical Systems Inc.
- Kett Electric Laboratory
- Sartorius AG
- Shimadzu Corporation
- Thermo Fisher Scientific Inc.
- Yokogawa Electric Corporation
LIST OF TABLES
- Market Snapshot
- Drivers : Impact Analysis
- Restraints : Impact Analysis
- List of Raw Material
- List of Raw Material Manufactures
- List of Potential Buyers
- Analysis by Technology (USD MN)
- Molecular Spectroscopy Market Sales by Geography (USD MN)
- Mass Spectroscopy Market Sales by Geography (USD MN)
- Atomic Spectroscopy Market Sales by Geography (USD MN)
- Analysis Market by Application (USD MN)
- Polymer Market Sales by Geography (USD MN)
- Oil & Gas Market Sales by Geography (USD MN)
- Pharmaceutical Market Sales by Geography (USD MN)
- Food & Agriculture Market Sales by Geography (USD MN)
- Chemical Market Sales by Geography (USD MN)
- Water & Wastewater Market Sales by Geography (USD MN)
- Pulp & Paper Market Sales by Geography (USD MN)
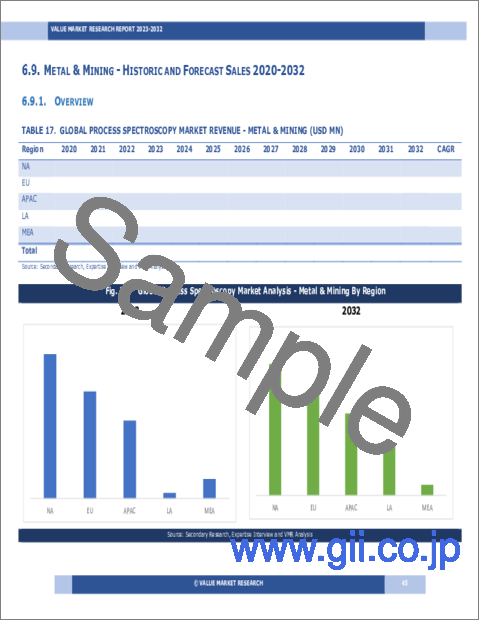
- Metal & Mining Market Sales by Geography (USD MN)
- Others Market Sales by Geography (USD MN)
- Analysis by Component (USD MN)
- Hardware Market Sales by Geography (USD MN)
- Software Market Sales by Geography (USD MN)
- Global Process Spectroscopy Market Sales by Geography (USD MN)
- North America Market Analysis (USD MN)
- United State Market Analysis (USD MN)
- Canada Market Analysis (USD MN)
- Mexico Market Analysis (USD MN)
- Europe Market Analysis (USD MN)
- Europe Market Estimate by Country (USD MN)
- United Kingdom Market Analysis (USD MN)
- France Market Analysis (USD MN)
- Germany Market Analysis (USD MN)
- Italy Market Analysis (USD MN)
- Russia Market Analysis (USD MN)
- Spain Market Analysis (USD MN)
- Rest of Europe Market Analysis (USD MN)
- Asia Pacific Market Analysis (USD MN)
- China Market Analysis (USD MN)
- Japan Market Analysis (USD MN)
- India Market Analysis (USD MN)
- South Korea Market Analysis (USD MN)
- Australia Market Analysis (USD MN)
- South East Asia Market Analysis (USD MN)
- Rest of Asia Pacific Market Analysis (USD MN)
- Latin America Market Analysis (USD MN)
- Brazil Market Analysis (USD MN)
- Argentina Market Analysis (USD MN)
- Peru Market Analysis (USD MN)
- Chile Market Analysis (USD MN)
- Rest of Latin America Market Analysis (USD MN)
- Middle East & Africa Market Analysis (USD MN)
- Saudi Arabia Market Analysis (USD MN)
- UAE Market Analysis (USD MN)
- Israel Market Analysis (USD MN)
- South Africa Market Analysis (USD MN)
- Rest of Middle East and Africa Market Analysis (USD MN)
- Partnership/Collaboration/Agreement
- Mergers And Acquisition
LIST OF FIGURES
- Research Scope of Process Spectroscopy Report
- Market Research Process
- Market Research Methodology
- Global Process Spectroscopy Market Size, by Region (USD MN)
- Porters Five Forces Analysis
- Market Attractiveness Analysis by Technology
- Market Attractiveness Analysis by Application
- Market Attractiveness Analysis by Component
- Market Attractiveness Analysis by Region
- Value Chain Analysis
- Global Market Analysis by Technology (USD MN)
- Molecular Spectroscopy Market Sales by Geography (USD MN)
- Mass Spectroscopy Market Sales by Geography (USD MN)
- Atomic Spectroscopy Market Sales by Geography (USD MN)
- Global Market Analysis by Application (USD MN)
- Polymer Market Sales by Geography (USD MN)
- Oil & Gas Market Sales by Geography (USD MN)
- Pharmaceutical Market Sales by Geography (USD MN)
- Food & Agriculture Market Sales by Geography (USD MN)
- Chemical Market Sales by Geography (USD MN)
- Water & Wastewater Market Sales by Geography (USD MN)
- Pulp & Paper Market Sales by Geography (USD MN)
- Metal & Mining Market Sales by Geography (USD MN)
- Others Market Sales by Geography (USD MN)
- Global Market Analysis by Component (USD MN)
- Hardware Market Sales by Geography (USD MN)
- Software Market Sales by Geography (USD MN)
- Global Market Sales (USD MN)
- North America Market Sales (USD MN)
- Europe Market Sales (USD MN)
- Asia Pacific Market Sales (USD MN)
- Latin America Market Sales (USD MN)
- Middle East & Africa Market Sales (USD MN)
- Recent Development in Industry
- Top Company Market Share Analysis
Kindly note that the above listed are the basic tables and figures of the report and are not limited to the TOC.
The global demand for Process Spectroscopy Market is presumed to reach the market size of nearly USD 60.24 Billion by 2032 from USD 21.55 Billion in 2023 with a CAGR of 12.1% under the study period 2024 - 2032.
Process spectroscopy is a technique used to analyze and monitor chemical compositions, molecular structures, and physical properties of substances in real time during industrial manufacturing processes. It involves the use of spectroscopic methods such as infrared (IR), near-infrared (NIR), Raman, and ultraviolet-visible (UV-Vis) spectroscopy to measure the absorption, emission, or scattering of light by molecules in a sample. These systems are integrated into production lines and process equipment to monitor parameters such as chemical composition, concentration, purity, and reaction kinetics in various industries, including pharmaceuticals, chemicals, food and beverages, and petrochemicals. It enables process optimization, quality control, and regulatory compliance by providing rapid, non-destructive analysis of raw materials, intermediates, and finished products during manufacturing operations.
MARKET DYNAMICS
The Process Spectroscopy market is driven by several key factors shaping the landscape of manufacturing, process control, and quality assurance. Firstly, the increasing demand for real-time process monitoring, quality control, and product optimization drives market growth for these solutions, as they enable non-destructive, in-line analysis of chemical composition, molecular structure, and physical properties of materials and products. Additionally, advancements in spectroscopy technologies, such as NIR, Raman, FTIR, and UV-Vis spectroscopy, enable rapid, accurate, and cost-effective analysis of raw materials, intermediate products, and finished goods in diverse industries such as pharmaceuticals, food and beverage, chemicals, and materials manufacturing.
Moreover, the growing emphasis on regulatory compliance, product safety, and quality standards drives investments in spectroscopy solutions that offer traceability, data integrity, and compliance with regulatory requirements, ensuring product quality, consistency, and safety in manufacturing processes. Moreover, incorporating process spectroscopy into automated process control systems, SCADA systems, and MES platforms allows for real-time data acquisition, analysis, and decision-making, leading to enhanced efficiency, productivity, and cost savings in manufacturing operations. Additionally, the growth of end-user industries, such as pharmaceutical manufacturing, biotechnology, chemical processing, and food processing, creates opportunities for market growth and innovation in process spectroscopy applications tailored to industry-specific requirements and compliance standards. However, high initial investment costs and technical complexities in implementing process spectroscopy solutions may hinder the growth of the market in the next few years.
The report covers Porter's Five Forces Model, Market Attractiveness Analysis, and Value Chain analysis. These tools help to get a clear picture of the industry's structure and evaluate the competition attractiveness at a global level. Additionally, these tools also give an inclusive assessment of each segment in the global market of process spectroscopy. The growth and trends of Process Spectroscopy Industry provide a holistic approach to this study.
MARKET SEGMENTATION
This section of the process spectroscopy market report provides detailed data on the segments by analyzing them at country and regional level, thereby assisting the strategist in identifying the target demographics for the respective product or services with the upcoming opportunities.
By Technology
- Molecular Spectroscopy
- Mass Spectroscopy
- Atomic Spectroscopy
By Application
- Polymer
- Oil & Gas
- Pharmaceutical
- Food & Agriculture
- Chemical
- Water & Wastewater
- Pulp & Paper
- Metal & Mining
- Others
By Component
- Hardware
- Software
REGIONAL ANALYSIS
This section covers the regional outlook, which accentuates current and future demand for the Process Spectroscopy market across North America, Europe, Asia-Pacific, Latin America, and Middle East & Africa. Further, the report focuses on demand, estimation, and forecast for individual application segments across all the prominent regions.
The research report also covers the comprehensive profiles of the key players in the market and an in-depth view of the competitive landscape worldwide. The major players in the process spectroscopy market include ABB Group, Agilent Technologies Inc., Bruker, Danaher Corporation, Foss, Horiba Ltd., Kaiser Optical Systems Inc., Kett Electric Laboratory, Sartorius AG, Shimadzu Corporation, Thermo Fisher Scientific Inc., Yokogawa Electric Corporation. This section consists of a holistic view of the competitive landscape that includes various strategic developments such as key mergers & acquisitions, future capacities, partnerships, financial overviews, collaborations, new product developments, new product launches, and other developments.
In case you have any custom requirements, do write to us. Our research team can offer a customized report as per your need.
TABLE OF CONTENTS
1 . PREFACE
- 1.1. Report Description
- 1.1.1. Objective
- 1.1.2. Target Audience
- 1.1.3. Unique Selling Proposition (USP) & offerings
- 1.2. Research Scope
- 1.3. Research Methodology
- 1.3.1. Market Research Process
- 1.3.2. Market Research Methodology
2 . EXECUTIVE SUMMARY
- 2.1. Highlights of Market
- 2.2. Global Market Snapshot
3 . PROCESS SPECTROSCOPY - INDUSTRY ANALYSIS
- 3.1. Introduction - Market Dynamics
- 3.2. Market Drivers
- 3.3. Market Restraints
- 3.4. Opportunities
- 3.5. Industry Trends
- 3.6. Porter's Five Force Analysis
- 3.7. Market Attractiveness Analysis
- 3.7.1 Market Attractiveness Analysis By Technology
- 3.7.2 Market Attractiveness Analysis By Application
- 3.7.3 Market Attractiveness Analysis By Component
- 3.7.4 Market Attractiveness Analysis By Region
4 . VALUE CHAIN ANALYSIS
- 4.1. Value Chain Analysis
- 4.2. Raw Material Analysis
- 4.2.1. List of Raw Materials
- 4.2.2. Raw Material Manufactures List
- 4.2.3. Price Trend of Key Raw Materials
- 4.3. List of Potential Buyers
- 4.4. Marketing Channel
- 4.4.1. Direct Marketing
- 4.4.2. Indirect Marketing
- 4.4.3. Marketing Channel Development Trend
5 . GLOBAL PROCESS SPECTROSCOPY MARKET ANALYSIS BY TECHNOLOGY
- 5.1 Overview by Technology
- 5.2 Historical and Forecast Data
- 5.3 Analysis by Technology
- 5.4 Molecular Spectroscopy Historic and Forecast Sales by Regions
- 5.5 Mass Spectroscopy Historic and Forecast Sales by Regions
- 5.6 Atomic Spectroscopy Historic and Forecast Sales by Regions
6 . GLOBAL PROCESS SPECTROSCOPY MARKET ANALYSIS BY APPLICATION
- 6.1 Overview by Application
- 6.2 Historical and Forecast Data
- 6.3 Analysis by Application
- 6.4 Polymer Historic and Forecast Sales by Regions
- 6.5 Oil & Gas Historic and Forecast Sales by Regions
- 6.6 Pharmaceutical Historic and Forecast Sales by Regions
- 6.7 Food & Agriculture Historic and Forecast Sales by Regions
- 6.8 Chemical Historic and Forecast Sales by Regions
- 6.9 Water & Wastewater Historic and Forecast Sales by Regions
- 6.10. Pulp & Paper Historic and Forecast Sales by Regions
- 6.11 Metal & Mining Historic and Forecast Sales by Regions
- 6.12 Others Historic and Forecast Sales by Regions
7 . GLOBAL PROCESS SPECTROSCOPY MARKET ANALYSIS BY COMPONENT
- 7.1 Overview by Component
- 7.2 Historical and Forecast Data
- 7.3 Analysis by Component
- 7.4 Hardware Historic and Forecast Sales by Regions
- 7.5 Software Historic and Forecast Sales by Regions
8 . GLOBAL PROCESS SPECTROSCOPY MARKET ANALYSIS BY GEOGRAPHY
- 8.1. Regional Outlook
- 8.2. Introduction
- 8.3. North America Sales Analysis
- 8.3.1. Overview, Historic and Forecast Data Sales Analysis
- 8.3.2. North America By Segment Sales Analysis
- 8.3.3. North America By Country Sales Analysis
- 8.3.4. United State Sales Analysis
- 8.3.5. Canada Sales Analysis
- 8.3.6. Mexico Sales Analysis
- 8.4. Europe Sales Analysis
- 8.4.1. Overview, Historic and Forecast Data Sales Analysis
- 8.4.2. Europe by Segment Sales Analysis
- 8.4.3. Europe by Country Sales Analysis
- 8.4.4. United Kingdom Sales Analysis
- 8.4.5. France Sales Analysis
- 8.4.6. Germany Sales Analysis
- 8.4.7. Italy Sales Analysis
- 8.4.8. Russia Sales Analysis
- 8.4.9. Rest Of Europe Sales Analysis
- 8.5. Asia Pacific Sales Analysis
- 8.5.1. Overview, Historic and Forecast Data Sales Analysis
- 8.5.2. Asia Pacific by Segment Sales Analysis
- 8.5.3. Asia Pacific by Country Sales Analysis
- 8.5.4. China Sales Analysis
- 8.5.5. India Sales Analysis
- 8.5.6. Japan Sales Analysis
- 8.5.7. South Korea Sales Analysis
- 8.5.8. Australia Sales Analysis
- 8.5.9. South East Asia Sales Analysis
- 8.5.10. Rest Of Asia Pacific Sales Analysis
- 8.6. Latin America Sales Analysis
- 8.6.1. Overview, Historic and Forecast Data Sales Analysis
- 8.6.2. Latin America by Segment Sales Analysis
- 8.6.3. Latin America by Country Sales Analysis
- 8.6.4. Brazil Sales Analysis
- 8.6.5. Argentina Sales Analysis
- 8.6.6. Peru Sales Analysis
- 8.6.7. Chile Sales Analysis
- 8.6.8. Rest of Latin America Sales Analysis
- 8.7. Middle East & Africa Sales Analysis
- 8.7.1. Overview, Historic and Forecast Data Sales Analysis
- 8.7.2. Middle East & Africa by Segment Sales Analysis
- 8.7.3. Middle East & Africa by Country Sales Analysis
- 8.7.4. Saudi Arabia Sales Analysis
- 8.7.5. UAE Sales Analysis
- 8.7.6. Israel Sales Analysis
- 8.7.7. South Africa Sales Analysis
- 8.7.8. Rest Of Middle East And Africa Sales Analysis
9 . COMPETITIVE LANDSCAPE OF THE PROCESS SPECTROSCOPY COMPANIES
- 9.1. Process Spectroscopy Market Competition
- 9.2. Partnership/Collaboration/Agreement
- 9.3. Merger And Acquisitions
- 9.4. New Product Launch
- 9.5. Other Developments
10 . COMPANY PROFILES OF PROCESS SPECTROSCOPY INDUSTRY
- 10.1. Company Share Analysis
- 10.2. Market Concentration Rate
- 10.3. ABB Group
- 10.3.1. Company Overview
- 10.3.2. Company Revenue
- 10.3.3. Products
- 10.3.4. Recent Developments
- 10.4. Agilent Technologies Inc.
- 10.4.1. Company Overview
- 10.4.2. Company Revenue
- 10.4.3. Products
- 10.4.4. Recent Developments
- 10.5. Bruker
- 10.5.1. Company Overview
- 10.5.2. Company Revenue
- 10.5.3. Products
- 10.5.4. Recent Developments
- 10.6. Danaher Corporation
- 10.6.1. Company Overview
- 10.6.2. Company Revenue
- 10.6.3. Products
- 10.6.4. Recent Developments
- 10.7. Foss
- 10.7.1. Company Overview
- 10.7.2. Company Revenue
- 10.7.3. Products
- 10.7.4. Recent Developments
- 10.8. HORIBA Ltd.
- 10.8.1. Company Overview
- 10.8.2. Company Revenue
- 10.8.3. Products
- 10.8.4. Recent Developments
- 10.9. Kaiser Optical Systems Inc.
- 10.9.1. Company Overview
- 10.9.2. Company Revenue
- 10.9.3. Products
- 10.9.4. Recent Developments
- 10.10. Kett Electric Laboratory
- 10.10.1. Company Overview
- 10.10.2. Company Revenue
- 10.10.3. Products
- 10.10.4. Recent Developments
- 10.11. Sartorius AG
- 10.11.1. Company Overview
- 10.11.2. Company Revenue
- 10.11.3. Products
- 10.11.4. Recent Developments
- 10.12. Shimadzu Corporation
- 10.12.1. Company Overview
- 10.12.2. Company Revenue
- 10.12.3. Products
- 10.12.4. Recent Developments
- 10.13. Thermo Fisher Scientific Inc.
- 10.13.1. Company Overview
- 10.13.2. Company Revenue
- 10.13.3. Products
- 10.13.4. Recent Developments
- 10.14. Yokogawa Electric Corporation
- 10.14.1. Company Overview
- 10.14.2. Company Revenue
- 10.14.3. Products
- 10.14.4. Recent Developments

