|
|
市場調査レポート
商品コード
1764902
アジア太平洋の3Dスタッキング市場の予測 (2031年まで) - 地域別分析 (相互接続技術別、デバイスの種類別、エンドユーザー別)Asia Pacific 3D Stacking Market Forecast to 2031 - Regional Analysis by Interconnecting Technology, Device Type, and End User |
||||||
|
|||||||
|
|||||||


| アジア太平洋の3Dスタッキング市場の予測 (2031年まで) - 地域別分析 (相互接続技術別、デバイスの種類別、エンドユーザー別) |
|
出版日: 2025年04月14日
発行: The Insight Partners
ページ情報: 英文 179 Pages
納期: 即納可能
|

全表示
- 概要
- 図表
- 目次
アジア太平洋の3Dスタッキング市場は、2023年に6億9,932万米ドルと評価され、2031年には23億5,245万米ドルに達すると予測され、2023年から2031年までのCAGRは16.4%を記録すると予測されています。
高帯域幅メモリ需要の急増が、アジア太平洋の3Dスタッキング市場を後押し
多数のDRAMを垂直方向に積層することで極めて高密度になる高帯域幅メモリ(HBM)は、高速データ処理と低消費電力が特徴です。膨大な量のデータを高速に処理する必要があるジェネレーティブAIなどのハイパフォーマンス・コンピューティング(HPC)には欠かせないです。サムスン電子の12層積層HBMは、次世代の3Dスタッキングパッケージング技術を採用し、性能と歩留まりを高めています。処理速度6.4Gbps、帯域幅819GB/秒のHBM3は、消費電力を10%削減しながら、前世代のDRAMより1.8倍高速です。ハイパフォーマンス・コンピューティング・アプリケーションにおけるHBMの需要は、市場プレイヤーの増産を促しています。例えば、SK HYNIX INCは2024年3月、超高性能の最新AIメモリ製品であるHBM3E1の量産を開始しました。HBM3Eは、膨大なデータを高速処理するAIシステム向けに設計されています。この広帯域メモリは、通信、自動車、医療、製造業など様々な業界で高速データ処理に使用されています。
HBMは3Dスタッキング技術を利用しており、シリコン貫通ビア(TSV)と呼ばれる垂直チャネルを使用してチップを多層に積層することができます。これにより、より小さなスペースに多くのメモリチップを詰め込むことができ、メモリとプロセッサ間のデータの移動距離を最小限に抑えることができます。HBMは、ユーザーに持続可能な利点を提供することで、バッテリー寿命を延ばし、エネルギー消費を削減するのに役立ちます。これは、メモリとプロセッサ間のデータ伝送に必要な電力量を削減することで、ユーザーをサポートします。したがって、高速データ処理と低消費電力メモリに対する需要の急増は、予測期間中、3Dスタッキング市場の成長に有利な機会を生み出すと予想されます。
アジア太平洋の3Dスタッキング市場概要
アジア太平洋では、中国が最大の民生用電子機器メーカーです。日本経済新聞社によると、中国政府は2023年まで3,270億米ドルを投資して国内電子市場を拡大した。インド政府も国内の電子機器市場の拡大を目指しています。さらに、アジア太平洋のエレクトロニクス部門は、アジア太平洋の総輸出額の20~50%を占めています。スマート・スピーカー、ホーム・アシスタント、スマート・カメラは、3Dスタッキングメモリとプロセッサを利用して、設置面積を小さく抑えながら性能と機能を強化しています。アジア太平洋は最大の電子機器メーカーであるため、予測期間中に3Dスタッキングの需要が高まると予想されます。
アジア太平洋の3Dスタッキング市場の収益と2031年までの予測(金額)
アジア太平洋の3Dスタッキング市場のセグメンテーション
アジア太平洋の3Dスタッキング市場は、相互接続技術、デバイスの種類、エンドユーザー、国別に分類されます。
相互接続技術に基づき、アジア太平洋の3Dスタッキング市場はスルーシリコン・ビア、モノリシック3Dインテグレーション、3Dハイブリッドボンディングに区分されます。スルーシリコン・ビアセグメントが2023年に最大の市場シェアを占めています。
デバイスの種類別では、アジア太平洋の3Dスタッキング市場はメモリデバイス、メモリ/センサー、LED、イメージング&オプトエレクトロニクス、その他に区分されます。2023年の市場シェアはメモリデバイスが最大です。
エンドユーザー別では、アジア太平洋3Dスタッキング市場は、民生用電子機器、通信、自動車、製造、医療、その他に区分されます。2023年には民生用電子機器セグメントが最大の市場シェアを占めています。
国別では、アジア太平洋3Dスタッキング市場は、インド、中国、日本、韓国、台湾、オーストラリア、その他アジア太平洋に区分されます。2023年のアジア太平洋3Dスタッキング市場シェアは台湾が独占しました。
Taiwan Semiconductor Manufacturing Co Ltd、Samsung Electronics Co Ltd、Intel Corp、MediaTek Inc、Texas Instruments Inc、Amkor Technology Inc、ASE Technology Holding Co Ltd、Advanced Micro Devices Inc、3M Co.、Globalfoundries Incは、アジア太平洋3Dスタッキング市場で事業を展開する主要企業です。
目次
第1章 イントロダクション
第2章 エグゼクティブサマリー
- 主要洞察
- 市場の魅力
第3章 分析手法
- 二次調査
- 一次調査
- 仮説の策定
- マクロ経済要因分析
- 基礎数値の開発
- データの三角測量
- 国レベルのデータ
第4章 アジア太平洋の3Dスタッキング市場の情勢
- PEST分析
- エコシステム分析
- バリューチェーンのベンダー一覧
第5章 アジア太平洋の3Dスタッキング市場:主な市場力学
- 3Dスタッキング市場:主な市場力学
- 市場促進要因
- 民生用電子機器の需要増加
- ヘテロジニアスインテグレーションとコンポーネント最適化の増加
- 市場抑制要因
- 3Dスタッキング技術の複雑さ
- 市場機会
- 広帯域メモリ需要の急増
- 今後の動向
- ゲーム用高速プロセッサ
- 促進要因と抑制要因の影響
第6章 3Dスタッキング市場:アジア太平洋市場の分析
- アジア太平洋の3Dスタッキング市場の概要
- アジア太平洋の3Dスタッキング市場の収益 (2021~2031年)
- アジア太平洋の3Dスタッキング市場の予測・分析
第7章 アジア太平洋の3Dスタッキング市場の分析:相互接続技術別
- スルーシリコン・ビア
- モノリシック3Dインテグレーション
- 3Dハイブリッドボンディング
第8章 アジア太平洋の3Dスタッキング市場の分析:デバイスの種類別
- メモリデバイス
- MEMS/センサー
- LED
- イメージング・オプトエレクトロニクス
- その他
第9章 アジア太平洋の3Dスタッキング市場の分析:エンドユーザー別
- 民生用電子機器
- 通信
- 自動車
- 製造業
- 医療
- その他
第10章 アジア太平洋の3Dスタッキング市場の分析:国別分析
- アジア太平洋
- インド
- 中国
- 日本
- 韓国
- 台湾
- オーストラリア
- その他アジア太平洋
第11章 競合情勢
- ヒートマップ分析:主要企業別
- 企業のポジショニングと集中度
第12章 業界情勢
- 市場イニシアティブ
- 製品開発
第13章 企業プロファイル
- Taiwan Semiconductor Manufacturing Co Ltd
- Samsung Electronics Co Ltd
- Intel Corp
- MediaTek Inc
- Texas Instruments Inc
- Amkor Technology Inc
- ASE Technology Holding Co Ltd
- Advanced Micro Devices Inc
- 3M Co
- Globalfoundries Inc
第14章 付録
List Of Tables
- Table 1. 3D Stacking Market Segmentation
- Table 2. List of Vendors
- Table 3. Asia Pacific 3D Stacking Market - Revenue and Forecast to 2031 (US$ Million)
- Table 4. 3D Stacking Market - Revenue and Forecast to 2031 (US$ Million) - by Interconnecting Technology
- Table 5. 3D Stacking Market - Revenue and Forecast to 2031 (US$ Million) - by Device Type
- Table 6. 3D Stacking Market - Revenue and Forecast to 2031 (US$ Million) - by End User
- Table 7. Asia Pacific: 3D Stacking Market - Revenue and Forecast to 2031 (US$ Million) - by Country
- Table 8. India: 3D Stacking Market - Revenue and Forecast to 2031 (US$ Million) - by Interconnecting Technology
- Table 9. India: 3D Stacking Market - Revenue and Forecast to 2031 (US$ Million) - by Device Type
- Table 10. India: 3D Stacking Market - Revenue and Forecast to 2031 (US$ Million) - by End User
- Table 11. China: 3D Stacking Market - Revenue and Forecast to 2031 (US$ Million) - by Interconnecting Technology
- Table 12. China: 3D Stacking Market - Revenue and Forecast to 2031 (US$ Million) - by Device Type
- Table 13. China: 3D Stacking Market - Revenue and Forecast to 2031 (US$ Million) - by End User
- Table 14. Japan: 3D Stacking Market - Revenue and Forecast to 2031 (US$ Million) - by Interconnecting Technology
- Table 15. Japan: 3D Stacking Market - Revenue and Forecast to 2031 (US$ Million) - by Device Type
- Table 16. Japan: 3D Stacking Market - Revenue and Forecast to 2031 (US$ Million) - by End User
- Table 17. South Korea: 3D Stacking Market - Revenue and Forecast to 2031 (US$ Million) - by Interconnecting Technology
- Table 18. South Korea: 3D Stacking Market - Revenue and Forecast to 2031 (US$ Million) - by Device Type
- Table 19. South Korea: 3D Stacking Market - Revenue and Forecast to 2031 (US$ Million) - by End User
- Table 20. Taiwan: 3D Stacking Market - Revenue and Forecast to 2031 (US$ Million) - by Interconnecting Technology
- Table 21. Taiwan: 3D Stacking Market - Revenue and Forecast to 2031 (US$ Million) - by Device Type
- Table 22. Taiwan: 3D Stacking Market - Revenue and Forecast to 2031 (US$ Million) - by End User
- Table 23. Australia: 3D Stacking Market - Revenue and Forecast to 2031 (US$ Million) - by Interconnecting Technology
- Table 24. Australia: 3D Stacking Market - Revenue and Forecast to 2031 (US$ Million) - by Device Type
- Table 25. Australia: 3D Stacking Market - Revenue and Forecast to 2031 (US$ Million) - by End User
- Table 26. Rest of Asia Pacific: 3D Stacking Market - Revenue and Forecast to 2031 (US$ Million) - by Interconnecting Technology
- Table 27. Rest of Asia Pacific: 3D Stacking Market - Revenue and Forecast to 2031 (US$ Million) - by Device Type
- Table 28. Rest of Asia Pacific: 3D Stacking Market - Revenue and Forecast to 2031 (US$ Million) - by End User
- Table 29. List of Abbreviation
List Of Figures
- Figure 1. 3D Stacking Market Segmentation, by Country
- Figure 2. PEST Analysis
- Figure 3. Impact Analysis of Drivers and Restraints
- Figure 4. Asia Pacific 3D Stacking Market Revenue (US$ Million), 2021-2031
- Figure 5. 3D Stacking Market Share (%) - by Interconnecting Technology (2023 and 2031)
- Figure 6. Through-Silicon Via: 3D Stacking Market - Revenue and Forecast to 2031 (US$ Million)
- Figure 7. Monolithic 3D Integration: 3D Stacking Market - Revenue and Forecast to 2031 (US$ Million)
- Figure 8. 3D Hybrid Bonding: 3D Stacking Market - Revenue and Forecast to 2031 (US$ Million)
- Figure 9. 3D Stacking Market Share (%) - by Device Type (2023 and 2031)
- Figure 10. Memory Devices: 3D Stacking Market - Revenue and Forecast to 2031 (US$ Million)
- Figure 11. MEMS/Sensors: 3D Stacking Market - Revenue and Forecast to 2031 (US$ Million)
- Figure 12. LEDs: 3D Stacking Market - Revenue and Forecast to 2031 (US$ Million)
- Figure 13. Imaging and Optoelectronics: 3D Stacking Market - Revenue and Forecast to 2031 (US$ Million)
- Figure 14. Others: 3D Stacking Market - Revenue and Forecast to 2031 (US$ Million)
- Figure 15. 3D Stacking Market Share (%) - by End User (2023 and 2031)
- Figure 16. Consumer Electronics: 3D Stacking Market - Revenue and Forecast to 2031 (US$ Million)
- Figure 17. Telecommunication: 3D Stacking Market - Revenue and Forecast to 2031 (US$ Million)
- Figure 18. Automotive: 3D Stacking Market - Revenue and Forecast to 2031 (US$ Million)
- Figure 19. Manufacturing: 3D Stacking Market - Revenue and Forecast to 2031 (US$ Million)
- Figure 20. Healthcare: 3D Stacking Market - Revenue and Forecast to 2031 (US$ Million)
- Figure 21. Others: 3D Stacking Market - Revenue and Forecast to 2031 (US$ Million)
- Figure 22. Asia Pacific 3D Stacking Market, by Key Countries - Revenue (2023) (US$ Million)
- Figure 23. Asia Pacific 3D Stacking Market Breakdown, by Key Countries, 2023 and 2031 (%)
- Figure 24. India: 3D Stacking Market - Revenue and Forecast to 2031 (US$ Million)
- Figure 25. China: 3D Stacking Market - Revenue and Forecast to 2031 (US$ Million)
- Figure 26. Japan: 3D Stacking Market - Revenue and Forecast to 2031 (US$ Million)
- Figure 27. South Korea: 3D Stacking Market - Revenue and Forecast to 2031 (US$ Million)
- Figure 28. Taiwan: 3D Stacking Market - Revenue and Forecast to 2031 (US$ Million)
- Figure 29. Australia: 3D Stacking Market - Revenue and Forecast to 2031 (US$ Million)
- Figure 30. Rest of Asia Pacific: 3D Stacking Market - Revenue and Forecast to 2031 (US$ Million)
- Figure 31. Heat Map Analysis by Key Players
- Figure 32. Company Positioning & Concentration
The Asia Pacific 3D stacking market was valued at US$ 699.32 million in 2023 and is expected to reach US$ 2,352.45 million by 2031; it is expected to record a CAGR of 16.4% from 2023 to 2031.
Surge in Demand for High-Bandwidth Memory Fuels Asia Pacific 3D Stacking Market
High-bandwidth memory (HBM), which reaches extremely high density by stacking numerous dynamic random-access memory (DRAMs) vertically, is distinguished by rapid data processing and low power consumption. It is essential in high-performance computing (HPC), such as generative AI, which requires processing enormous amounts of data at significantly fast speeds. Samsung Electronics 12-layer stacked HBM uses next-generation 3D stacking packaging technique to boost performance and yield. With a processing speed of 6.4Gbps and a bandwidth of 819 GB/s, HBM3 is 1.8 times faster than the previous-generation DRAM while using 10% less power. The demand for HBM in high-performance computing applications encourages market players to increase their production. For instance, in March 2024, SK HYNIX INC started volume production of HBM3E1, the newest AI memory product with ultra-high performance. HBM3E is designed for an AI system that processes a huge amount of data quickly. The high-bandwidth memory is used by various industries, including telecommunication, automotive, healthcare, and manufacturing, for high-speed data processing.
HBM utilizes 3D stacking technology, allowing the stacking of multiple layers of chips using vertical channels known as through-silicon vias (TSVs). This enables a greater number of memory chips to be packed into a smaller space, minimizing the distance data must travel between the memory and processor. HBM can help lengthen battery life and reduce energy consumption by offering sustainable benefits to users. This supports users in decreasing the amount of power required to transmit data between memory and processor. Therefore, the surge in demand for high-speed data processing and low-power consumption memories is expected to create lucrative opportunities for the 3D stacking market growth during the forecast period.
Asia Pacific 3D Stacking Market Overview
In Asia Pacific, China is the largest manufacturer of consumer electronic devices. According to Nikkei Inc., the Government of China expanded the country's domestic electronic market by investing US$ 327 billion till 2023. The Government of India also aims to expand the electronics market in the country. Furthermore, the electronics sector in Asia Pacific accounts for 20-50% of Asia Pacific's total value of exports. Smart speakers, home assistants, and smart cameras utilize 3D stacked memory and processors to enhance performance and features while maintaining a small footprint. As Asia Pacific is the largest electronic manufacturer, the demand for 3D stacking is expected to rise during the forecast period.
Asia Pacific 3D Stacking Market Revenue and Forecast to 2031 (US$ Million)
Asia Pacific 3D Stacking Market Segmentation
The Asia Pacific 3D stacking market is categorized into interconnecting technology, device type, end user, and country.
Based on interconnecting technology, the Asia Pacific 3D stacking market is segmented into through-silicon via, monolithic 3d integration, and 3d hybrid bonding. The through-silicon via segment held the largest market share in 2023.
By device type, the Asia Pacific 3D stacking market is segmented into memory devices, mems/sensors, LEDs, imaging & optoelectronics, and others. The memory devices segment held the largest market share in 2023.
In the terms of end user, the Asia Pacific 3D stacking market is segmented into consumer electronics, telecommunication, automotive, manufacturing, healthcare, and others. The consumer electronics segment held the largest market share in 2023.
By country, the Asia Pacific 3D stacking market is segmented into India, China, Japan, South Korea, Taiwan, Australia, and the Rest of Asia Pacific. Taiwan dominated the Asia Pacific 3D stacking market share in 2023.
Taiwan Semiconductor Manufacturing Co Ltd; Samsung Electronics Co Ltd; Intel Corp; MediaTek Inc.; Texas Instruments Inc; Amkor Technology Inc; ASE Technology Holding Co Ltd; Advanced Micro Devices Inc.; 3M Co.; and Globalfoundries Inc are some of the leading companies operating in the Asia Pacific 3D stacking market.
Table Of Contents
1. Introduction
- 1.1 The Insight Partners Research Report Guidance
- 1.2 Market Segmentation
2. Executive Summary
- 2.1 Key Insights
- 2.2 Market Attractiveness
3. Research Methodology
- 3.1 Secondary Research
- 3.2 Primary Research
- 3.2.1 Hypothesis formulation:
- 3.2.2 Macro-economic factor analysis:
- 3.2.3 Developing base number:
- 3.2.4 Data Triangulation:
- 3.2.5 Country level data:
4. Asia Pacific 3D Stacking Market Landscape
- 4.1 Overview
- 4.2 PEST Analysis
- 4.3 Ecosystem Analysis
- 4.3.1 List of Vendors in the Value Chain
5. Asia Pacific 3D Stacking Market - Key Market Dynamics
- 5.1 3D Stacking Market - Key Market Dynamics
- 5.2 Market Drivers
- 5.2.1 Rising Demand for Consumer Electronics
- 5.2.2 Increasing Use of Heterogeneous Integration and Component Optimization
- 5.3 Market Restraints
- 5.3.1 Complexity Associated with 3D Stacking Technology
- 5.4 Market Opportunities
- 5.4.1 Surge in Demand for High-Bandwidth Memory
- 5.5 Future Trends
- 5.5.1 Fast Processors for Gaming Purposes
- 5.6 Impact of Drivers and Restraints:
6. 3D Stacking Market - Asia Pacific Market Analysis
- 6.1 Asia Pacific 3D Stacking Market Overview-
- 6.2 Asia Pacific 3D Stacking Market Revenue (US$ Million), 2021-2031
- 6.3 Asia Pacific 3D Stacking Market Forecast Analysis
7. Asia Pacific 3D Stacking Market Analysis - by Interconnecting Technology
- 7.1 Through-Silicon Via
- 7.1.1 Overview
- 7.1.2 Through-Silicon Via: 3D Stacking Market - Revenue and Forecast to 2031 (US$ Million)
- 7.2 Monolithic 3D Integration
- 7.2.1 Overview
- 7.2.2 Monolithic 3D Integration: 3D Stacking Market - Revenue and Forecast to 2031 (US$ Million)
- 7.3 3D Hybrid Bonding
- 7.3.1 Overview
- 7.3.2 3D Hybrid Bonding: 3D Stacking Market - Revenue and Forecast to 2031 (US$ Million)
8. Asia Pacific 3D Stacking Market Analysis - by Device Type
- 8.1 Memory Devices
- 8.1.1 Overview
- 8.1.2 Memory Devices: 3D Stacking Market - Revenue and Forecast to 2031 (US$ Million)
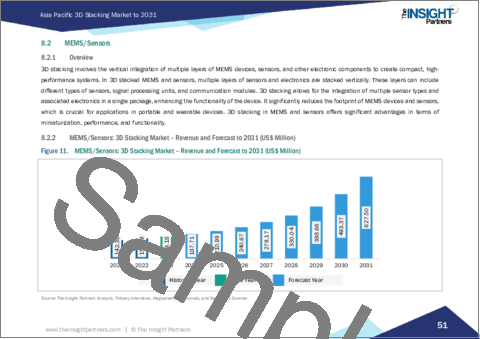
- 8.2 MEMS/Sensors
- 8.2.1 Overview
- 8.2.2 MEMS/Sensors: 3D Stacking Market - Revenue and Forecast to 2031 (US$ Million)
- 8.3 LEDs
- 8.3.1 Overview
- 8.3.2 LEDs: 3D Stacking Market - Revenue and Forecast to 2031 (US$ Million)
- 8.4 Imaging and Optoelectronics
- 8.4.1 Overview
- 8.4.2 Imaging and Optoelectronics: 3D Stacking Market - Revenue and Forecast to 2031 (US$ Million)
- 8.5 Others
- 8.5.1 Overview
- 8.5.2 Others: 3D Stacking Market - Revenue and Forecast to 2031 (US$ Million)
9. Asia Pacific 3D Stacking Market Analysis - by End User
- 9.1 Consumer Electronics
- 9.1.1 Overview
- 9.1.2 Consumer Electronics: 3D Stacking Market - Revenue and Forecast to 2031 (US$ Million)
- 9.2 Telecommunication
- 9.2.1 Overview
- 9.2.2 Telecommunication: 3D Stacking Market - Revenue and Forecast to 2031 (US$ Million)
- 9.3 Automotive
- 9.3.1 Overview
- 9.3.2 Automotive: 3D Stacking Market - Revenue and Forecast to 2031 (US$ Million)
- 9.4 Manufacturing
- 9.4.1 Overview
- 9.4.2 Manufacturing: 3D Stacking Market - Revenue and Forecast to 2031 (US$ Million)
- 9.5 Healthcare
- 9.5.1 Overview
- 9.5.2 Healthcare: 3D Stacking Market - Revenue and Forecast to 2031 (US$ Million)
- 9.6 Others
- 9.6.1 Overview
- 9.6.2 Others: 3D Stacking Market - Revenue and Forecast to 2031 (US$ Million)
10. Asia Pacific 3D Stacking Market -Country Analysis
- 10.1 Asia Pacific
- 10.1.1 Asia Pacific 3D Stacking Market, by Key Countries - Revenue (2023) (US$ Million)
- 10.1.2 Asia Pacific 3D Stacking Market - Revenue and Forecast Analysis - by Country
- 10.1.2.1 Asia Pacific: 3D Stacking Market - Revenue and Forecast Analysis - by Country
- 10.1.2.2 India: 3D Stacking Market - Revenue and Forecast to 2031 (US$ Million)
- 10.1.2.2.1 India: 3D Stacking Market Breakdown, by Interconnecting Technology
- 10.1.2.2.2 India: 3D Stacking Market Breakdown, by Device Type
- 10.1.2.2.3 India: 3D Stacking Market Breakdown, by End User
- 10.1.2.3 China: 3D Stacking Market - Revenue and Forecast to 2031 (US$ Million)
- 10.1.2.3.1 China: 3D Stacking Market Breakdown, by Interconnecting Technology
- 10.1.2.3.2 China: 3D Stacking Market Breakdown, by Device Type
- 10.1.2.3.3 China: 3D Stacking Market Breakdown, by End User
- 10.1.2.4 Japan: 3D Stacking Market - Revenue and Forecast to 2031 (US$ Million)
- 10.1.2.4.1 Japan: 3D Stacking Market Breakdown, by Interconnecting Technology
- 10.1.2.4.2 Japan: 3D Stacking Market Breakdown, by Device Type
- 10.1.2.4.3 Japan: 3D Stacking Market Breakdown, by End User
- 10.1.2.5 South Korea: 3D Stacking Market - Revenue and Forecast to 2031 (US$ Million)
- 10.1.2.5.1 South Korea: 3D Stacking Market Breakdown, by Interconnecting Technology
- 10.1.2.5.2 South Korea: 3D Stacking Market Breakdown, by Device Type
- 10.1.2.5.3 South Korea: 3D Stacking Market Breakdown, by End User
- 10.1.2.6 Taiwan: 3D Stacking Market - Revenue and Forecast to 2031 (US$ Million)
- 10.1.2.6.1 Taiwan: 3D Stacking Market Breakdown, by Interconnecting Technology
- 10.1.2.6.2 Taiwan: 3D Stacking Market Breakdown, by Device Type
- 10.1.2.6.3 Taiwan: 3D Stacking Market Breakdown, by End User
- 10.1.2.7 Australia: 3D Stacking Market - Revenue and Forecast to 2031 (US$ Million)
- 10.1.2.7.1 Australia: 3D Stacking Market Breakdown, by Interconnecting Technology
- 10.1.2.7.2 Australia: 3D Stacking Market Breakdown, by Device Type
- 10.1.2.7.3 Australia: 3D Stacking Market Breakdown, by End User
- 10.1.2.8 Rest of Asia Pacific: 3D Stacking Market - Revenue and Forecast to 2031 (US$ Million)
- 10.1.2.8.1 Rest of Asia Pacific: 3D Stacking Market Breakdown, by Interconnecting Technology
- 10.1.2.8.2 Rest of Asia Pacific: 3D Stacking Market Breakdown, by Device Type
- 10.1.2.8.3 Rest of Asia Pacific: 3D Stacking Market Breakdown, by End User
11. Competitive Landscape
- 11.1 Heat Map Analysis by Key Players
- 11.2 Company Positioning & Concentration
12. Industry Landscape
- 12.1 Overview
- 12.2 Market Initiative
- 12.3 Product Development
13. Company Profiles
- 13.1 Taiwan Semiconductor Manufacturing Co Ltd
- 13.1.1 Key Facts
- 13.1.2 Business Description
- 13.1.3 Products and Services
- 13.1.4 Financial Overview
- 13.1.5 SWOT Analysis
- 13.1.6 Key Developments
- 13.2 Samsung Electronics Co Ltd
- 13.2.1 Key Facts
- 13.2.2 Business Description
- 13.2.3 Products and Services
- 13.2.4 Financial Overview
- 13.2.5 SWOT Analysis
- 13.2.6 Key Developments
- 13.3 Intel Corp
- 13.3.1 Key Facts
- 13.3.2 Business Description
- 13.3.3 Products and Services
- 13.3.4 Financial Overview
- 13.3.5 SWOT Analysis
- 13.3.6 Key Developments
- 13.4 MediaTek Inc
- 13.4.1 Key Facts
- 13.4.2 Business Description
- 13.4.3 Products and Services
- 13.4.4 Financial Overview
- 13.4.5 SWOT Analysis
- 13.4.6 Key Developments
- 13.5 Texas Instruments Inc
- 13.5.1 Key Facts
- 13.5.2 Business Description
- 13.5.3 Products and Services
- 13.5.4 Financial Overview
- 13.5.5 SWOT Analysis
- 13.5.6 Key Developments
- 13.6 Amkor Technology Inc
- 13.6.1 Key Facts
- 13.6.2 Business Description
- 13.6.3 Products and Services
- 13.6.4 Financial Overview
- 13.6.5 SWOT Analysis
- 13.6.6 Key Developments
- 13.7 ASE Technology Holding Co Ltd
- 13.7.1 Key Facts
- 13.7.2 Business Description
- 13.7.3 Products and Services
- 13.7.4 Financial Overview
- 13.7.5 SWOT Analysis
- 13.7.6 Key Developments
- 13.8 Advanced Micro Devices Inc
- 13.8.1 Key Facts
- 13.8.2 Business Description
- 13.8.3 Products and Services
- 13.8.4 Financial Overview
- 13.8.5 SWOT Analysis
- 13.8.6 Key Developments
- 13.9 3M Co
- 13.9.1 Key Facts
- 13.9.2 Business Description
- 13.9.3 Products and Services
- 13.9.4 Financial Overview
- 13.9.5 SWOT Analysis
- 13.9.6 Key Developments
- 13.10 Globalfoundries Inc
- 13.10.1 Key Facts
- 13.10.2 Business Description
- 13.10.3 Products and Services
- 13.10.4 Financial Overview
- 13.10.5 SWOT Analysis
- 13.10.6 Key Developments
14. Appendix
- 14.1 About The Insight Partners
- 14.2 Word Index
