|
|
市場調査レポート
商品コード
1764901
北米の3Dスタッキング市場の2031年までの予測- 相互接続技術、デバイスタイプ、エンドユーザー別の地域分析North America 3D Stacking Market Forecast to 2031 - Regional Analysis by Interconnecting Technology, Device Type, and End User |
||||||
|
|||||||
|
|||||||

| 北米の3Dスタッキング市場の2031年までの予測- 相互接続技術、デバイスタイプ、エンドユーザー別の地域分析 |
|
出版日: 2025年04月14日
発行: The Insight Partners
ページ情報: 英文 110 Pages
納期: 即納可能
|

全表示
- 概要
- 図表
- 目次
北米の3Dスタッキング市場は、2023年に5億3,848万米ドルと評価され、2031年には19億441万米ドルに達すると予測され、2023~2031年のCAGRは17.1%に達すると予測されています。
民生用電子機器需要の高まりが北米の3Dスタッキング市場を後押し
スマートフォン、タブレット、スマートウォッチ、ポータブルデバイスなど、洗練された機能豊富で電力効率の高いガジェットに対する需要の高まりにより、コンパクトで高性能なソリューションを提供することがメーカーに大きなプレッシャーとなっています。例えば、推定によると、2023年第4四半期のスマートフォンの出荷台数(速報値)は3億2,800万台でした。これは4Q22比で8.6%の増加であり、4Q23は2Q21以来初めて大きな伸びを示した四半期となりました。世界中の消費者が、ショッピング、コミュニケーション、エンターテインメント、その他の目的でスマートフォンを大いに活用しています。これらのデバイスには3Dスタッキングダイ包装が採用されており、その設計と機能性に革命的な変化をもたらしています。3Dスタッキングダイ包装は、性能を損なうことなく、フォームファクタを大幅に縮小することができます。集積回路を垂直方向に複数層積み重ねることで、この技術はコンパクトなスペース内に多様なコンポーネントをスムーズに統合することを可能にします。この統合により、設計と組立プロセスが合理化されるだけでなく、メーカーは消費者の嗜好の進化に沿った、薄型で審美的に魅力的なデバイスを作ることができます。
3Dスタッキングダイ包装によって達成される性能の向上は、現代のコンシューマーエレクトロニクスの高まる性能要求に応える上で大きな役割を果たします。スマートフォンの先進的画像処理からスマートウォッチのリアルタイムデータ分析に至るまで、効率的で強力な半導体ソリューションの必要性は最も重要です。3Dスタッキング技術を活用することで、メーカーはメモリ、ロジック、センサコンポーネントを垂直方向に相互接続しながら集積することができ、コンパクトなフォームファクタを維持しながら処理能力を高めることができます。このように、3Dスタッキング技術を利用した民生用電子機器製品に対する需要の高まりが、北米の3Dスタッキング市場規模の拡大に寄与しています。
北米の3Dスタッキング市場概要
民生用電子機器産業の成長は北米の3Dスタッキング市場の重要な促進要因です。消費者がより小型で持ち運び可能な電子機器を求める中、メモリなどの小型で効率的な電源のニーズが大幅に高まっています。さらに、IoTやスマートデバイスの普及も北米の3Dスタッキング市場を推進する重要な要因です。ウェアラブル、センサ、コネクテッドデバイスなどのIoTデバイスは、小型で信頼性の高い電源に依存しています。スマートウォッチ、フィットネストラッカー、その他のウェアラブルは、センサ、プロセッサ、メモリーなど複数の機能をコンパクトなフォームファクタに統合することで、3Dスタッキングの恩恵を受けています。3Dスタッキングコンポーネントによる消費電力の削減は、ウェアラブルデバイスのバッテリー寿命を延ばします。
ヘルスケアや自動車など、さまざまな産業でIoTデバイスの採用が増加しているため、3Dスタッキングプロバイダには大きなビジネス機会が生まれています。さらに、北米のにおけるMEMSとセンサの需要増加も、ダイ、ウエハー、フリップチップボンダーの製造に携わる市場リーダーに機会をもたらしており、3Dスタッキングへの要求を後押ししています。自動車や電子機器の利用が増加していることから、MEMSセンサの需要が高まっており、北米の3Dスタッキング市場は予測期間中に活性化するとみられます。
北米の3Dスタッキング市場の収益と2031年までの予測(金額)
北米の3Dスタッキング市場のセグメンテーション
北米の3Dスタッキング市場は、相互接続技術、デバイスタイプ、エンドユーザー、国に分類されます。
相互接続技術に基づき、北米の3Dスタッキング市場はスルーシリコン・ビア、モノリシック3Dインテグレーション、3Dハイブリッドボンディングに区分されます。スルーシリコン・ビアセグメントが2023年に最大の市場シェアを占めています。
デバイスタイプ別では、北米の3Dスタッキング市場はメモリデバイス、MEMS/センサ、LED、イメージング&オプトエレクトロニクス、その他に区分されます。2023年の市場シェアはメモリデバイスセグメントが最大となっています。
エンドユーザー別では、北米の3Dスタッキング市場は民生用エレクトロニクス、通信、自動車、製造、ヘルスケア、その他に区分されます。2023年には民生用電子機器セグメントが最大の市場シェアを占めています。
国別では、北米の3Dスタッキング市場は米国、カナダ、メキシコに区分されます。2023年の北米の3Dスタッキング市場シェアは米国が独占しています。
Taiwan Semiconductor Manufacturing Co Ltd、Samsung Electronics Co Ltd、Intel Corp、MediaTek Inc、Texas Instruments Inc、Amkor Technology Inc、ASE Technology Holding Co Ltd、Advanced Micro Devices Inc、3M Co.、Globalfoundries Incは北米の3Dスタッキング市場で事業を展開する主要企業です。
目次
第1章 イントロダクション
第2章 エグゼクティブサマリー
- 主要な洞察
- 市場の魅力
第3章 調査手法
- 二次調査
- 一次調査
- 仮説の策定
- マクロ経済要因分析
- ファンデーション数値の開発
- データの三角測量
- 国レベルのデータ
第4章 北米の3Dスタッキング市場情勢
- イントロダクション
- PEST分析
- エコシステム分析
- バリューチェーンのベンダー一覧
第5章 北米の3Dスタッキング市場:主要市場力学
- 3Dスタッキング市場-主要市場力学
- 市場促進要因
- コンシューマーエレクトロニクス需要の増加
- 異種集積化とコンポーネント最適化の増加
- 市場抑制要因
- 3Dスタッキング技術の複雑さ
- 市場機会
- 広帯域メモリ需要の急増
- 今後の動向
- ゲーム用高速プロセッサ
- 促進要因と抑制要因の影響
第6章 3Dスタッキング市場:北米市場分析
- 北米の3Dスタッキング市場概要
- 北米の3Dスタッキング市場収益(2021~2031年)
- 北米の3Dスタッキング市場予測分析
第7章 北米の3Dスタッキング市場分析-相互接続技術別
- スルーシリコンビア
- モノリシック3Dインテグレーション
- 3Dハイブリッドボンディング
第8章 北米の3Dスタッキング市場分析-デバイスタイプ別
- メモリデバイス
- MEMS/センサ
- LED
- イメージング&オプトエレクトロニクス
- その他
第9章 北米の3Dスタッキング市場分析-エンドユーザー別
- コンシューマーエレクトロニクス
- 通信
- 自動車
- 製造業
- ヘルスケア
- その他
第10章 北米の3Dスタッキング市場:国別分析
- 北米
- 米国
- カナダ
- メキシコ
第11章 競合情勢
- 主要参入企業によるヒートマップ分析
- 企業のポジショニングと集中度
第12章 産業情勢
- イントロダクション
- 市場イニシアティブ
- 製品開発
第13章 企業プロファイル
- Taiwan Semiconductor Manufacturing Co Ltd
- Samsung Electronics Co Ltd
- Intel Corp
- MediaTek Inc
- Texas Instruments Inc
- Amkor Technology Inc
- ASE Technology Holding Co Ltd
- Advanced Micro Devices Inc
- 3M Co
- Globalfoundries Inc
第14章 付録
List Of Tables
- Table 1. 3D Stacking Market Segmentation
- Table 2. List of Vendors
- Table 3. 3D Stacking Market - Revenue and Forecast to 2031 (US$ Million)
- Table 4. 3D Stacking Market - Revenue and Forecast to 2031 (US$ Million) - by Interconnecting Technology
- Table 5. 3D Stacking Market - Revenue and Forecast to 2031 (US$ Million) - by Device Type
- Table 6. 3D Stacking Market - Revenue and Forecast to 2031 (US$ Million) - by End User
- Table 7. North America 3D Stacking Market - Revenue and Forecast to 2031 (US$ Million) - by Country
- Table 8. United States: 3D Stacking Market - Revenue and Forecast to 2031 (US$ Million) - by Interconnecting Technology
- Table 9. United States: 3D Stacking Market - Revenue and Forecast to 2031 (US$ Million) - by Device Type
- Table 10. United States: 3D Stacking Market - Revenue and Forecast to 2031 (US$ Million) - by End User
- Table 11. Canada: 3D Stacking Market - Revenue and Forecast to 2031 (US$ Million) - by Interconnecting Technology
- Table 12. Canada: 3D Stacking Market - Revenue and Forecast to 2031 (US$ Million) - by Device Type
- Table 13. Canada: 3D Stacking Market - Revenue and Forecast to 2031 (US$ Million) - by End User
- Table 14. Mexico: 3D Stacking Market - Revenue and Forecast to 2031 (US$ Million) - by Interconnecting Technology
- Table 15. Mexico: 3D Stacking Market - Revenue and Forecast to 2031 (US$ Million) - by Device Type
- Table 16. Mexico: 3D Stacking Market - Revenue and Forecast to 2031 (US$ Million) - by End User
- Table 17. List of Abbreviation
List Of Figures
- Figure 1. 3D Stacking Market Segmentation, by Country
- Figure 2. PEST Analysis
- Figure 3. Impact Analysis of Drivers and Restraints
- Figure 4. 3D Stacking Market Revenue (US$ Million), 2021-2031
- Figure 5. 3D Stacking Market Share (%) - by Interconnecting Technology (2023 and 2031)
- Figure 6. Through-Silicon Via: 3D Stacking Market - Revenue and Forecast to 2031 (US$ Million)
- Figure 7. Monolithic 3D Integration: 3D Stacking Market - Revenue and Forecast to 2031 (US$ Million)
- Figure 8. 3D Hybrid Bonding: 3D Stacking Market - Revenue and Forecast to 2031 (US$ Million)
- Figure 9. 3D Stacking Market Share (%) - by Device Type (2023 and 2031)
- Figure 10. Memory Devices: 3D Stacking Market - Revenue and Forecast to 2031 (US$ Million)
- Figure 11. MEMS/Sensors: 3D Stacking Market - Revenue and Forecast to 2031 (US$ Million)
- Figure 12. LEDs: 3D Stacking Market - Revenue and Forecast to 2031 (US$ Million)
- Figure 13. Imaging and Optoelectronics: 3D Stacking Market - Revenue and Forecast to 2031 (US$ Million)
- Figure 14. Others: 3D Stacking Market - Revenue and Forecast to 2031 (US$ Million)
- Figure 15. 3D Stacking Market Share (%) - by End User (2023 and 2031)
- Figure 16. Consumer Electronics: 3D Stacking Market - Revenue and Forecast to 2031 (US$ Million)
- Figure 17. Telecommunication: 3D Stacking Market - Revenue and Forecast to 2031 (US$ Million)
- Figure 18. Automotive: 3D Stacking Market - Revenue and Forecast to 2031 (US$ Million)
- Figure 19. Manufacturing: 3D Stacking Market - Revenue and Forecast to 2031 (US$ Million)
- Figure 20. Healthcare: 3D Stacking Market - Revenue and Forecast to 2031 (US$ Million)
- Figure 21. Others: 3D Stacking Market - Revenue and Forecast to 2031 (US$ Million)
- Figure 22. North America: 3D Stacking Market - Revenue and Forecast to 2031 (US$ Million)
- Figure 23. North America: 3D Stacking Market Breakdown, by Key Countries, 2023 and 2031 (%)
- Figure 24. United States: 3D Stacking Market - Revenue and Forecast to 2031 (US$ Million)
- Figure 25. Canada: 3D Stacking Market - Revenue and Forecast to 2031 (US$ Million)
- Figure 26. Mexico: 3D Stacking Market - Revenue and Forecast to 2031 (US$ Million)
- Figure 27. Heat Map Analysis by Key Players
- Figure 28. Company Positioning & Concentration
The North America 3D stacking market was valued at US$ 538.48 million in 2023 and is expected to reach US$ 1,904.41 million by 2031; it is anticipated to reach a CAGR of 17.1% from 2023 to 2031.
Rising Demand for Consumer Electronics Fuels North America 3D Stacking Market
The proliferating demand for sleek, feature-rich, and power-efficient gadgets such as smartphones, tablets, smartwatches, and portable devices has led to immense pressure on manufacturers to deliver compact, high-performance solutions. For instance, according to estimates, the preliminary shipment of smartphones was 328 million units in the fourth quarter of 2023. This represents 8.6% gain over 4Q22, establishing 4Q23 as the first quarter to show major growth since 2Q21. Consumers across the globe are highly adopting smartphones for shopping, communication, entertainment, and other purposes. These devices use 3D stacked die packaging, which is revolutionizing their designs and functionality. 3D stacked die packaging is capable of significantly reducing form factors without compromising performance. By vertically stacking multiple layers of integrated circuits, this technology allows for the smooth integration of diverse components within a compact space. This consolidation not only streamlines the design and assembly processes but also enables manufacturers to create thin, more aesthetically appealing devices that align with the evolving preferences of consumers.
The enhanced performance achieved through 3D stacked die packaging plays a major role in meeting the escalating performance demands of modern consumer electronics. From advanced image processing in smartphones to real-time data analysis in smartwatches, the need for efficient and powerful semiconductor solutions is paramount. By leveraging 3D stacking technology, manufacturers can integrate memory, logic, and sensor components in a vertically interconnected manner, thereby enhancing processing capabilities while maintaining a compact form factor. Thus, the rising demand for consumer electronics that utilize 3D stacking technology is contributing to the growing North America 3D stacking market size.
North America 3D Stacking Market Overview
The rising consumer electronics industry is a significant driver for the 3D stacking market in North America. As consumers seek smaller and more portable electronic devices, the need for compact and efficient power sources, such as memories, has significantly grown. Furthermore, the proliferation of IoT and smart devices is another crucial factor propelling the 3D stacking market in North America. IoT devices, including wearables, sensors, and connected devices, rely on small and reliable power sources. Smartwatches, fitness trackers, and other wearables benefit from 3D stacking by integrating multiple functionalities in a compact form factor, including sensors, processors, and memory. The reduced power consumption from 3D stacked components extends the battery life of wearable devices.
The increasing adoption of IoT devices across various industries, such as healthcare and automotive, creates immense opportunities for 3D stacking providers. Moreover, the rise in demand for MEMS and sensors in North America has also created opportunities for market leaders engaged in the manufacturing of die, wafer, and flip-chip bonders, which boosts the requirement for 3D stacking. The rising utilization of vehicles and electronic devices fuels the demand for MEMS sensors, which is expected to fuel the 3D stacking market in North America during the forecast period.
North America 3D Stacking Market Revenue and Forecast to 2031 (US$ Million)
North America 3D Stacking Market Segmentation
The North America 3D stacking market is categorized into interconnecting technology, device type, end user, and country.
Based on interconnecting technology, the North America 3D stacking market is segmented into through-silicon via, monolithic 3D integration, and 3D hybrid bonding. The through-silicon via segment held the largest market share in 2023.
By device type, the North America 3D stacking market is segmented into memory devices, mems/sensors, LEDs, imaging & optoelectronics, and others. The memory devices segment held the largest market share in 2023.
In the terms of end user, the North America 3D stacking market is segmented into consumer electronics, telecommunication, automotive, manufacturing, healthcare, and others. The consumer electronics segment held the largest market share in 2023.
By country, the North America 3D stacking market is segmented into the US, Canada, and Mexico. The US dominated the North America 3D stacking market share in 2023.
Taiwan Semiconductor Manufacturing Co Ltd; Samsung Electronics Co Ltd; Intel Corp; MediaTek Inc.; Texas Instruments Inc; Amkor Technology Inc; ASE Technology Holding Co Ltd; Advanced Micro Devices Inc.; 3M Co.; and Globalfoundries Inc are some of the leading companies operating in the North America 3D stacking market.
Table Of Contents
1. Introduction
- 1.1 The Insight Partners Research Report Guidance
- 1.2 Market Segmentation
2. Executive Summary
- 2.1 Key Insights
- 2.2 Market Attractiveness
3. Research Methodology
- 3.1 Secondary Research
- 3.2 Primary Research
- 3.2.1 Hypothesis formulation:
- 3.2.2 Macro-economic factor analysis:
- 3.2.3 Developing base number:
- 3.2.4 Data Triangulation:
- 3.2.5 Country level data:
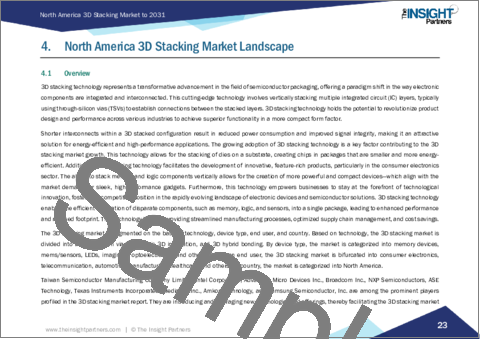
4. North America 3D Stacking Market Landscape
- 4.1 Overview
- 4.2 PEST Analysis
- 4.3 Ecosystem Analysis
- 4.3.1 List of Vendors in the Value Chain
5. North America 3D Stacking Market - Key Market Dynamics
- 5.1 3D Stacking Market - Key Market Dynamics
- 5.2 Market Drivers
- 5.2.1 Rising Demand for Consumer Electronics
- 5.2.2 Increasing Use of Heterogeneous Integration and Component Optimization
- 5.3 Market Restraints
- 5.3.1 Complexity Associated with 3D Stacking Technology
- 5.4 Market Opportunities
- 5.4.1 Surge in Demand for High-Bandwidth Memory
- 5.5 Future Trends
- 5.5.1 Fast Processors for Gaming Purposes
- 5.6 Impact of Drivers and Restraints:
6. 3D Stacking Market -North America Market Analysis
- 6.1 North America 3D Stacking Market Overview-
- 6.2 North America 3D Stacking Market Revenue (US$ Million), 2021-2031
- 6.3 North America 3D Stacking Market Forecast Analysis
7. North America 3D Stacking Market Analysis - by Interconnecting Technology
- 7.1 Through-Silicon Via
- 7.1.1 Overview
- 7.1.2 Through-Silicon Via: 3D Stacking Market - Revenue and Forecast to 2031 (US$ Million)
- 7.2 Monolithic 3D Integration
- 7.2.1 Overview
- 7.2.2 Monolithic 3D Integration: 3D Stacking Market - Revenue and Forecast to 2031 (US$ Million)
- 7.3 3D Hybrid Bonding
- 7.3.1 Overview
- 7.3.2 3D Hybrid Bonding: 3D Stacking Market - Revenue and Forecast to 2031 (US$ Million)
8. North America 3D Stacking Market Analysis - by Device Type
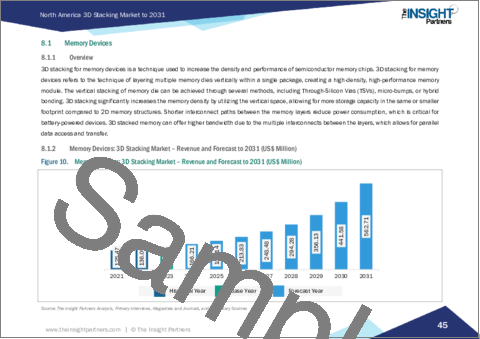
- 8.1 Memory Devices
- 8.1.1 Overview
- 8.1.2 Memory Devices: 3D Stacking Market - Revenue and Forecast to 2031 (US$ Million)
- 8.2 MEMS/Sensors
- 8.2.1 Overview
- 8.2.2 MEMS/Sensors: 3D Stacking Market - Revenue and Forecast to 2031 (US$ Million)
- 8.3 LEDs
- 8.3.1 Overview
- 8.3.2 LEDs: 3D Stacking Market - Revenue and Forecast to 2031 (US$ Million)
- 8.4 Imaging and Optoelectronics
- 8.4.1 Overview
- 8.4.2 Imaging and Optoelectronics: 3D Stacking Market - Revenue and Forecast to 2031 (US$ Million)
- 8.5 Others
- 8.5.1 Overview
- 8.5.2 Others: 3D Stacking Market - Revenue and Forecast to 2031 (US$ Million)
9. North America 3D Stacking Market Analysis - by End User
- 9.1 Consumer Electronics
- 9.1.1 Overview
- 9.1.2 Consumer Electronics: 3D Stacking Market - Revenue and Forecast to 2031 (US$ Million)
- 9.2 Telecommunication
- 9.2.1 Overview
- 9.2.2 Telecommunication: 3D Stacking Market - Revenue and Forecast to 2031 (US$ Million)
- 9.3 Automotive
- 9.3.1 Overview
- 9.3.2 Automotive: 3D Stacking Market - Revenue and Forecast to 2031 (US$ Million)
- 9.4 Manufacturing
- 9.4.1 Overview
- 9.4.2 Manufacturing: 3D Stacking Market - Revenue and Forecast to 2031 (US$ Million)
- 9.5 Healthcare
- 9.5.1 Overview
- 9.5.2 Healthcare: 3D Stacking Market - Revenue and Forecast to 2031 (US$ Million)
- 9.6 Others
- 9.6.1 Overview
- 9.6.2 Others: 3D Stacking Market - Revenue and Forecast to 2031 (US$ Million)
10. North America 3D Stacking Market -Country Analysis
- 10.1 North America
- 10.1.1 North America 3D Stacking Market, by Key Country- Revenue (2023) (US$ Million)
- 10.1.2 North America 3D Stacking Market - Revenue and Forecast Analysis - by Country
- 10.1.2.1 North America 3D Stacking Market - Revenue and Forecast Analysis - by Country
- 10.1.2.2 United States: 3D Stacking Market - Revenue and Forecast to 2031 (US$ Million)
- 10.1.2.2.1 United States: 3D Stacking Market Breakdown, by Interconnecting Technology
- 10.1.2.2.2 United States: 3D Stacking Market Breakdown, by Device Type
- 10.1.2.2.3 United States: 3D Stacking Market Breakdown, by End User
- 10.1.2.3 Canada: 3D Stacking Market - Revenue and Forecast to 2031 (US$ Million)
- 10.1.2.3.1 Canada: 3D Stacking Market Breakdown, by Interconnecting Technology
- 10.1.2.3.2 Canada: 3D Stacking Market Breakdown, by Device Type
- 10.1.2.3.3 Canada: 3D Stacking Market Breakdown, by End User
- 10.1.2.4 Mexico: 3D Stacking Market - Revenue and Forecast to 2031 (US$ Million)
- 10.1.2.4.1 Mexico: 3D Stacking Market Breakdown, by Interconnecting Technology
- 10.1.2.4.2 Mexico: 3D Stacking Market Breakdown, by Device Type
- 10.1.2.4.3 Mexico: 3D Stacking Market Breakdown, by End User
11. Competitive Landscape
- 11.1 Heat Map Analysis by Key Players
- 11.2 Company Positioning & Concentration
12. Industry Landscape
- 12.1 Overview
- 12.2 Market Initiative
- 12.3 Product Development
13. Company Profiles
- 13.1 Taiwan Semiconductor Manufacturing Co Ltd
- 13.1.1 Key Facts
- 13.1.2 Business Description
- 13.1.3 Products and Services
- 13.1.4 Financial Overview
- 13.1.5 SWOT Analysis
- 13.1.6 Key Developments
- 13.2 Samsung Electronics Co Ltd
- 13.2.1 Key Facts
- 13.2.2 Business Description
- 13.2.3 Products and Services
- 13.2.4 Financial Overview
- 13.2.5 SWOT Analysis
- 13.2.6 Key Developments
- 13.3 Intel Corp
- 13.3.1 Key Facts
- 13.3.2 Business Description
- 13.3.3 Products and Services
- 13.3.4 Financial Overview
- 13.3.5 SWOT Analysis
- 13.3.6 Key Developments
- 13.4 MediaTek Inc
- 13.4.1 Key Facts
- 13.4.2 Business Description
- 13.4.3 Products and Services
- 13.4.4 Financial Overview
- 13.4.5 SWOT Analysis
- 13.4.6 Key Developments
- 13.5 Texas Instruments Inc
- 13.5.1 Key Facts
- 13.5.2 Business Description
- 13.5.3 Products and Services
- 13.5.4 Financial Overview
- 13.5.5 SWOT Analysis
- 13.5.6 Key Developments
- 13.6 Amkor Technology Inc
- 13.6.1 Key Facts
- 13.6.2 Business Description
- 13.6.3 Products and Services
- 13.6.4 Financial Overview
- 13.6.5 SWOT Analysis
- 13.6.6 Key Developments
- 13.7 ASE Technology Holding Co Ltd
- 13.7.1 Key Facts
- 13.7.2 Business Description
- 13.7.3 Products and Services
- 13.7.4 Financial Overview
- 13.7.5 SWOT Analysis
- 13.7.6 Key Developments
- 13.8 Advanced Micro Devices Inc
- 13.8.1 Key Facts
- 13.8.2 Business Description
- 13.8.3 Products and Services
- 13.8.4 Financial Overview
- 13.8.5 SWOT Analysis
- 13.8.6 Key Developments
- 13.9 3M Co
- 13.9.1 Key Facts
- 13.9.2 Business Description
- 13.9.3 Products and Services
- 13.9.4 Financial Overview
- 13.9.5 SWOT Analysis
- 13.9.6 Key Developments
- 13.10 Globalfoundries Inc
- 13.10.1 Key Facts
- 13.10.2 Business Description
- 13.10.3 Products and Services
- 13.10.4 Financial Overview
- 13.10.5 SWOT Analysis
- 13.10.6 Key Developments
14. Appendix
- 14.1 About The Insight Partners
- 14.2 Word Index
