|
|
市場調査レポート
商品コード
1597063
北米の薬物動態サービス市場の将来予測 (2031年まで) - 地域別分析:薬剤の種類別、サービスの種類別、治療用途別、エンドユーザー別North America Pharmacokinetics Services Market Forecast to 2031 - Regional Analysis - by Drug Type, Service Type, Therapeutic Application, and End User |
||||||
|
|||||||
|
|||||||

| 北米の薬物動態サービス市場の将来予測 (2031年まで) - 地域別分析:薬剤の種類別、サービスの種類別、治療用途別、エンドユーザー別 |
|
出版日: 2024年10月17日
発行: The Insight Partners
ページ情報: 英文 87 Pages
納期: 即納可能
|

全表示
- 概要
- 図表
- 目次
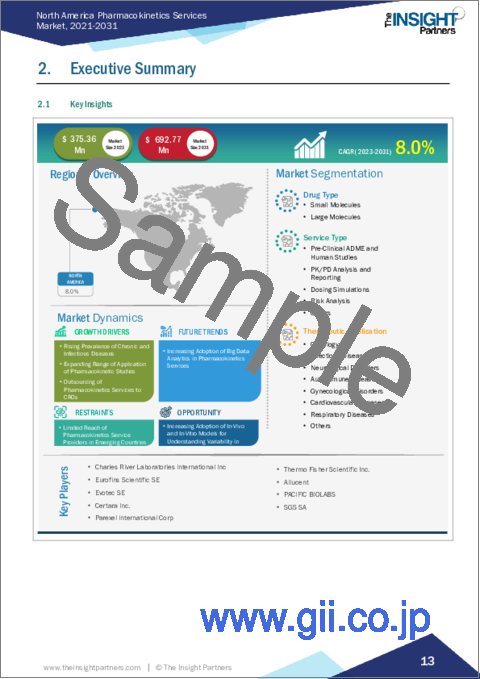
北米の薬物動態サービス市場は、2023年に3億7,536万米ドルと評価され、2031年には6億9,277万米ドルに達すると予測され、2023年から2031年までのCAGRは8.0%と推定されます。
薬物動態研究の活用領域の拡大が北米薬物動態サービス市場を後押し
薬物動態試験は、ヒト等価用量 (HED) レベル、無観察効果レベル (NOEL)、薬物動態学的/薬力学的試験など、いくつかのパラメータを決定するために採用されています。前臨床試験プログラムの主な焦点は、薬物動態試験における安全かつ有効な用量範囲の分析をサポートすることです。いくつかの毒性学的研究では、NOEL、すなわち有害作用が生じない最高用量に関するデータが実施されました。この用量レベルは、臨床薬物動態学的データが不足している場合、比較体表面積ベースでさらにHEDレベルに変換されます。潜在的な医薬品候補の薬物動態プロファイルを理解することは、創薬プログラムにおいて重要な役割を果たします。規制当局は、薬物動態試験の実施を推進する大きな役割を果たしています。これらの研究はまた、病院に入院している患者に提供される薬物治療サービスの最適化にも役立っています。PKモデルは、薬物への曝露量の決定、最適投与量を分析するための薬物濃度の決定、および人体における薬物の体内動態の分析に適用されることが多いです。医療提供者は、薬物濃度や薬物の投与量をモニターし、意図した治療効果を最大化し、毒性を最小化するためにPKの原理を導入しています。
北米の薬物動態サービス市場の概要
北米の薬物動態サービス市場で最大のシェアを占めるのは米国です。同国は主要な臨床研究先として頭角を現しており、世界で実施されている臨床試験全体の~50%を占めています。確立された医療インフラ、迅速な承認スケジュール、有利な規制枠組みが利用可能なため、製薬研究企業が臨床試験を実施しやすい環境が整っています。さらに、米国で実施された臨床試験で得られたデータは世界的に受け入れられています。世界保健機関 (WHO) の報告書によると、米国は2021年に最も多くの臨床試験 (157,618件) が登録されました。
北米の薬物動態サービス市場の収益と2031年までの予測 (単位:100万米ドル)
北米の薬物動態サービス市場の内訳
北米の薬物動態サービス市場は、薬剤の種類別、サービスの種類別、治療用途別、エンドユーザー別、国別に分類されます。
薬剤の種類別では、北米の薬物動態サービス市場は低分子、高分子、ワクチンに区分されます。低分子セグメントは2023年に最大の市場シェアを占めました。
サービスの種類別では、北米の薬物動態サービス市場は前臨床ADMEおよびヒト試験、PK/PD解析および報告、投与シミュレーション、リスク解析、その他に分類されます。2023年には、前臨床ADMEおよびヒト試験セグメントが最大の市場シェアを占めています。
治療用途別では、北米の薬物動態サービス市場は、がん、感染症、神経疾患、自己免疫疾患、婦人科疾患、心血管疾患、呼吸器疾患、その他に区分されます。2023年には、がん領域が最大の市場シェアを占めています。
エンドユーザー別では、北米の薬物動態サービス市場は製薬・バイオテクノロジー企業、CRO、その他に区分されます。2023年にはCROが最大の市場シェアを占めました。
国別では、北米の薬物動態サービス市場は米国、カナダ、メキシコに区分されます。2023年の北米薬物動態サービス市場シェアは米国が独占しています。
Charles River Laboratories International Inc、Eurofins Scientific SE、Evotec SE、Certara Inc、Parexel International Corp、Thermo Fisher Scientific Inc、Allucent、PACIFIC BIOLABS、SGS SAなどが、北米の薬物動態サービス市場で事業を展開する主要企業です。
目次
第1章 イントロダクション
第2章 エグゼクティブサマリー
第3章 調査手法
第4章 北米の薬物動態サービス市場の情勢
- PEST分析
第5章 北米の薬物動態サービス市場:主要な市場力学
- 市場促進要因
- 慢性疾患・感染症の有病率の上昇
- 薬物動態研究への応用範囲の拡大
- CROへの薬物動態サービスのアウトソーシング
- 市場抑制要因
- 新興国における薬物動態サービス業者のリーチの制約
- 市場機会
- 薬物動態のばらつきを理解するための生体内・生体外モデルの採用増加
- 今後の動向
- 薬物動態サービスにおけるビッグデータ解析の採用増加
- 促進要因と阻害要因の影響
第6章 北米の薬物動態サービス市場の分析
- 北米の薬物動態サービス市場の収益 (2021~2031年)
第7章 北米の薬物動態サービス市場の分析:薬剤の種類別
- 低分子
- 高分子
- ワクチン
第8章 北米の薬物動態サービス市場の分析:サービスの種類別
- 前臨床ADMEおよびヒト試験
- PK/PD分析とレポーティング
- 投与シミュレーション
- リスク分析
- その他
第9章 北米の薬物動態サービス市場の分析:治療用途別
- がん領域
- 感染症
- 神経疾患
- 自己免疫疾患
- 婦人科疾患
- 循環器疾患
- 呼吸器疾患
- その他
第10章 北米の薬物動態サービス市場の分析:エンドユーザー別
- 製薬・バイオテクノロジー企業
- CRO (医薬品開発業務受託機関)
- その他
第11章 北米の薬物動態サービス市場:国別分析
- 北米
- 米国
- カナダ
- メキシコ
第12章 企業プロファイル
- Charles River Laboratories International Inc
- Eurofins Scientific SE
- Evotec SE
- Certara Inc.
- Parexel International Corp
- Thermo Fisher Scientific Inc.
- Allucent
- PACIFIC BIOLABS
- SGS SA
第13章 付録
List Of Tables
- Table 1. North America Pharmacokinetics Services Market Segmentation
- Table 2. United States: North America Pharmacokinetics Services Market - Revenue and Forecast to 2031 (US$ Million) - by Drug Type
- Table 3. United States: North America Pharmacokinetics Services Market - Revenue and Forecast to 2031 (US$ Million) - by Service Type
- Table 4. United States: North America Pharmacokinetics Services Market - Revenue and Forecast to 2031 (US$ Million) - by Therapeutic Application
- Table 5. United States: North America Pharmacokinetics Services Market - Revenue and Forecast to 2031 (US$ Million) - by End User
- Table 6. Canada: North America Pharmacokinetics Services Market - Revenue and Forecast to 2031 (US$ Million) - by Drug Type
- Table 7. Canada: North America Pharmacokinetics Services Market - Revenue and Forecast to 2031 (US$ Million) - by Service Type
- Table 8. Canada: North America Pharmacokinetics Services Market - Revenue and Forecast to 2031 (US$ Million) - by Therapeutic Application
- Table 9. Canada: North America Pharmacokinetics Services Market - Revenue and Forecast to 2031 (US$ Million) - by End User
- Table 10. Mexico: North America Pharmacokinetics Services Market - Revenue and Forecast to 2031 (US$ Million) - by Drug Type
- Table 11. Mexico: North America Pharmacokinetics Services Market - Revenue and Forecast to 2031 (US$ Million) - by Service Type
- Table 12. Mexico: North America Pharmacokinetics Services Market - Revenue and Forecast to 2031 (US$ Million) - by Therapeutic Application
- Table 13. Mexico: North America Pharmacokinetics Services Market - Revenue and Forecast to 2031 (US$ Million) - by End User
- Table 14. Glossary of Terms
List Of Figures
- Figure 1. North America Pharmacokinetics Services Market Segmentation, by Country
- Figure 2. PEST Analysis
- Figure 3. North America Pharmacokinetics Services Market - Key Market Dynamics
- Figure 4. Impact Analysis of Drivers and Restraints
- Figure 5. North America Pharmacokinetics Services Market Revenue (US$ Million), 2021-2031
- Figure 6. North America Pharmacokinetics Services Market Share (%) - by Drug Type (2023 and 2031)
- Figure 7. Small Molecule: North America Pharmacokinetics Services Market - Revenue and Forecast to 2031 (US$ Million)
- Figure 8. Large Molecule: North America Pharmacokinetics Services Market - Revenue and Forecast to 2031 (US$ Million)
- Figure 9. Vaccines: North America Pharmacokinetics Services Market - Revenue and Forecast to 2031 (US$ Million)
- Figure 10. North America Pharmacokinetics Services Market Share (%) - by Service Type (2023 and 2031)
- Figure 11. Pre-Clinical ADME and Human Studies: North America Pharmacokinetics Services Market - Revenue and Forecast to 2031 (US$ Million)
- Figure 12. PK/PD Analysis and Reporting: North America Pharmacokinetics Services Market - Revenue and Forecast to 2031 (US$ Million)
- Figure 13. Dosing Simulations: North America Pharmacokinetics Services Market - Revenue and Forecast to 2031 (US$ Million)
- Figure 14. Risk Analysis: North America Pharmacokinetics Services Market - Revenue and Forecast to 2031 (US$ Million)
- Figure 15. Others: North America Pharmacokinetics Services Market - Revenue and Forecast to 2031 (US$ Million)
- Figure 16. North America Pharmacokinetics Services Market Share (%) - by Therapeutic Application (2023 and 2031)
- Figure 17. Oncology: North America Pharmacokinetics Services Market - Revenue and Forecast to 2031 (US$ Million)
- Figure 18. Infectious Diseases: North America Pharmacokinetics Services Market - Revenue and Forecast to 2031 (US$ Million)
- Figure 19. Neurological Disorders: North America Pharmacokinetics Services Market - Revenue and Forecast to 2031 (US$ Million)
- Figure 20. Autoimmune Diseases: North America Pharmacokinetics Services Market - Revenue and Forecast to 2031 (US$ Million)
- Figure 21. Gynecological Disorders: North America Pharmacokinetics Services Market - Revenue and Forecast to 2031 (US$ Million)
- Figure 22. Cardiovascular Diseases: North America Pharmacokinetics Services Market - Revenue and Forecast to 2031 (US$ Million)
- Figure 23. Respiratory Disorders: North America Pharmacokinetics Services Market - Revenue and Forecast to 2031 (US$ Million)
- Figure 24. Others: North America Pharmacokinetics Services Market - Revenue and Forecast to 2031 (US$ Million)
- Figure 25. North America Pharmacokinetics Services Market Share (%) - by End User (2023 and 2031)
- Figure 26. Pharmaceutical and Biotechnology Companies: North America Pharmacokinetics Services Market - Revenue and Forecast to 2031 (US$ Million)
- Figure 27. Contract Research Organization: North America Pharmacokinetics Services Market - Revenue and Forecast to 2031 (US$ Million)
- Figure 28. Others: North America Pharmacokinetics Services Market - Revenue and Forecast to 2031 (US$ Million)
- Figure 29. North America Pharmacokinetics Services Market by Key Countries - Revenue (2023) (US$ Million)
- Figure 30. North America Pharmacokinetics Services Market Breakdown, by Key Countries, 2023 and 2031 (%)
- Figure 31. United States: North America Pharmacokinetics Services Market - Revenue and Forecast to 2031 (US$ Million)
- Figure 32. Canada: North America Pharmacokinetics Services Market - Revenue and Forecast to 2031(US$ Million)
- Figure 33. Mexico: North America Pharmacokinetics Services Market - Revenue and Forecast to 2031(US$ Million)
The North America pharmacokinetics services market was valued at US$ 375.36 million in 2023 and is expected to reach US$ 692.77 million by 2031; it is estimated to register a CAGR of 8.0% from 2023 to 2031.
Expanding Range of Application of Pharmacokinetic Studies Fuels North America Pharmacokinetics Services Market
Pharmacokinetic studies are being employed to determine several parameters such as human-equivalent doses (HED) level, no-observed effect level (NOEL), and pharmacokinetic/pharmacodynamic testing. The main focus of any pre-clinical program conducted is to support the analysis of a safe and effective dose range for testing in pharmacokinetic studies. Several toxicology studies conducted data on the NOEL, i.e., the highest dose that does not produce adverse effects. This dose level is further converted to a HED level on a comparative body-surface area basis if there is lack of clinical pharmacokinetic data. Understanding the pharmacokinetic profile of a potential drug candidate plays an important role in the drug discovery program. Regulatory authorities play a major role propelling the implementation of pharmacokinetic studies. These studies are also instrumental in optimizing pharmaceutical care services provided to patients admitted in hospitals. The PK model is often applied to determine exposure to drugs, concentrations of drugs to analyze optimal dosage, and analyze the disposition of drugs in the human body. Healthcare providers implement the principles of PK to design monitor drug concentrations, doses of some drugs, maximize the intended therapeutic outcomes and minimize toxicities.
North America Pharmacokinetics Services Market Overview
The US accounts for the largest share of the North America pharmacokinetics services market in North America. The country has emerged as a leading clinical research destination; it accounts for ~50% of the total clinical trials conducted in the world. The availability of established medical infrastructure, fast approval timelines, and favorable regulatory framework create a conducive environment for pharmaceutical research companies to conduct clinical trials. Moreover, the data generated in trials conducted in the US is accepted globally. As per a World Health Organization (WHO) report, the US registered the highest number of clinical trials (157,618) in 2021.
North America Pharmacokinetics Services Market Revenue and Forecast to 2031 (US$ Million)
North America Pharmacokinetics Services Market Segmentation
The North America pharmacokinetics services market is categorized into drug type, service type, therapeutic application, end user, and country.
Based on drug type, the North America pharmacokinetics services market is segmented small molecule, large molecule, and vaccines. The small molecule segment held the largest market share in 2023.
In terms of service type, the North America pharmacokinetics services market is categorized into pre-clinical ADME and human studies, PK/PD analysis and reporting, dosing simulations, risk analysis, and others. The pre-clinical ADME and human studies segment held the largest market share in 2023.
By therapeutic application, the North America pharmacokinetics services market is segmented into oncology, infectious diseases, neurological disorders, autoimmune diseases, gynaecological disorders, cardiovascular diseases, respiratory disorders, and others. The oncology segment held the largest market share in 2023.
By end user, the North America pharmacokinetics services market is segmented into pharmaceutical and biotechnology companies, contract research organization, and others. The contract research organization segment held the largest market share in 2023.
By country, the North America pharmacokinetics services market is segmented into the US, Canada, and Mexico. The US dominated the North America pharmacokinetics services market share in 2023.
Charles River Laboratories International Inc; Eurofins Scientific SE; Evotec SE; Certara Inc.; Parexel International Corp; Thermo Fisher Scientific Inc.; Allucent; PACIFIC BIOLABS; and SGS SA are some of the leading companies operating in the North America pharmacokinetics services market.
Table Of Contents
1. Introduction
- 1.1 The Insight Partners Research Report Guidance
- 1.2 Market Segmentation
2. Executive Summary
- 2.1 Key Insights
3. Research Methodology
- 3.1 Coverage
- 3.2 Secondary Research
- 3.3 Primary Research
4. North America Pharmacokinetics Services Market Landscape
- 4.1 PEST Analysis
5. North America Pharmacokinetics Services Market - Key Market Dynamics
- 5.1 Market Drivers
- 5.1.1 Rising Prevalence of Chronic and Infectious Diseases
- 5.1.2 Expanding Range of Application of Pharmacokinetic Studies
- 5.1.3 Outsourcing of Pharmacokinetics Services to CROs
- 5.2 Market Restraints
- 5.2.1 Limited Reach of Pharmacokinetics Service Providers in Emerging Countries
- 5.3 Market Opportunities
- 5.3.1 Increasing Adoption of In-Vivo and In-Vitro Models for Understanding Variability in Pharmacokinetics
- 5.4 Future Trend
- 5.4.1 Increasing Adoption of Big Data Analytics in Pharmacokinetics Services
- 5.5 Impact of Drivers and Restraints:
6. Pharmacokinetics Services Market - North America Analysis
- 6.1 North America Pharmacokinetics Services Market Revenue (US$ Million), 2021-2031
7. North America Pharmacokinetics Services Market Analysis - by Drug Type
- 7.1 Overview
- 7.2 Small Molecule
- 7.2.1 Overview
- 7.2.2 Small Molecule: North America Pharmacokinetics Services Market - Revenue and Forecast to 2031 (US$ Million)
- 7.3 Large Molecule
- 7.3.1 Overview
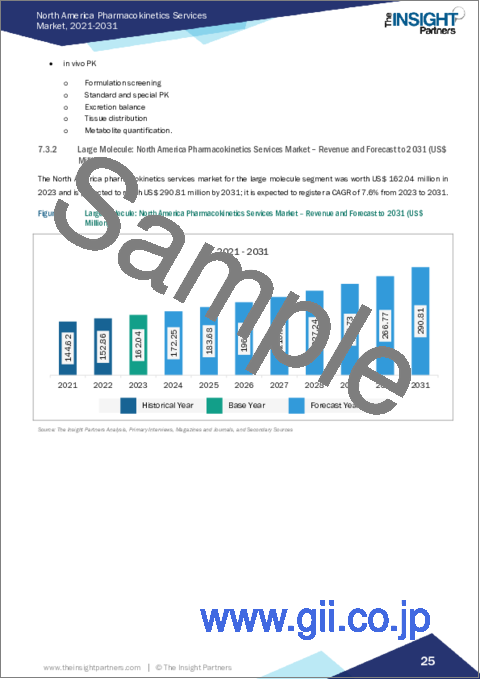
- 7.3.2 Large Molecule: North America Pharmacokinetics Services Market - Revenue and Forecast to 2031 (US$ Million)
- 7.4 Vaccines
- 7.4.1 Overview
- 7.4.2 Vaccines: North America Pharmacokinetics Services Market - Revenue and Forecast to 2031 (US$ Million)
8. North America Pharmacokinetics Services Market Analysis - by Service Type
- 8.1 Overview
- 8.2 Pre-Clinical ADME and Human Studies
- 8.2.1 Overview
- 8.2.2 Pre-Clinical ADME and Human Studies: North America Pharmacokinetics Services Market - Revenue and Forecast to 2031 (US$ Million)
- 8.3 PK/PD Analysis and Reporting
- 8.3.1 Overview
- 8.3.2 PK/PD Analysis and Reporting: North America Pharmacokinetics Services Market - Revenue and Forecast to 2031 (US$ Million)
- 8.4 Dosing Simulations
- 8.4.1 Overview
- 8.4.2 Dosing Simulations: North America Pharmacokinetics Services Market - Revenue and Forecast to 2031 (US$ Million)
- 8.5 Risk Analysis
- 8.5.1 Overview
- 8.5.2 Risk Analysis: North America Pharmacokinetics Services Market - Revenue and Forecast to 2031 (US$ Million)
- 8.6 Others
- 8.6.1 Overview
- 8.6.2 Others: North America Pharmacokinetics Services Market - Revenue and Forecast to 2031 (US$ Million)
9. North America Pharmacokinetics Services Market Analysis - by Therapeutic Application
- 9.1 Oncology
- 9.1.1 Overview
- 9.1.2 Oncology: North America Pharmacokinetics Services Market - Revenue and Forecast to 2031 (US$ Million)
- 9.2 Infectious Diseases
- 9.2.1 Overview
- 9.2.2 Infectious Diseases: North America Pharmacokinetics Services Market - Revenue and Forecast to 2031 (US$ Million)
- 9.3 Neurological Disorders
- 9.3.1 Overview
- 9.3.2 Neurological Disorders: North America Pharmacokinetics Services Market - Revenue and Forecast to 2031 (US$ Million)
- 9.4 Autoimmune Diseases
- 9.4.1 Overview
- 9.4.2 Autoimmune Diseases: North America Pharmacokinetics Services Market - Revenue and Forecast to 2031 (US$ Million)
- 9.5 Gynecological Disorders
- 9.5.1 Overview
- 9.5.2 Gynecological Disorders: North America Pharmacokinetics Services Market - Revenue and Forecast to 2031 (US$ Million)
- 9.6 Cardiovascular Diseases
- 9.6.1 Overview
- 9.6.2 Cardiovascular Diseases: North America Pharmacokinetics Services Market - Revenue and Forecast to 2031 (US$ Million)
- 9.7 Respiratory Disorders
- 9.7.1 Overview
- 9.7.2 Respiratory Disorders: North America Pharmacokinetics Services Market - Revenue and Forecast to 2031 (US$ Million)
- 9.8 Others
- 9.8.1 Overview
- 9.8.2 Others: North America Pharmacokinetics Services Market - Revenue and Forecast to 2031 (US$ Million)
10. North America Pharmacokinetics Services Market Analysis - by End User
- 10.1 Pharmaceutical and Biotechnology Companies
- 10.1.1 Overview
- 10.1.2 Pharmaceutical and Biotechnology Companies: North America Pharmacokinetics Services Market - Revenue and Forecast to 2031 (US$ Million)
- 10.2 Contract Research Organization
- 10.2.1 Overview
- 10.2.2 Contract Research Organization: North America Pharmacokinetics Services Market - Revenue and Forecast to 2031 (US$ Million)
- 10.3 Others
- 10.3.1 Overview
- 10.3.2 Others: North America Pharmacokinetics Services Market - Revenue and Forecast to 2031 (US$ Million)
11. North America Pharmacokinetics Services Market - Country Analysis
- 11.1 North America
- 11.1.1 North America Pharmacokinetics Services Market Breakdown, by Key Countries, 2023 and 2031 (%)
- 11.1.1.1 United States: North America Pharmacokinetics Services Market - Revenue and Forecast to 2031 (US$ Million)
- 11.1.1.1.1 Overview
- 11.1.1.1.2 United States: North America Pharmacokinetics Services Market - Revenue and Forecast to 2031 (US$ Million)
- 11.1.1.1.3 United States: North America Pharmacokinetics Services Market Breakdown, by Drug Type
- 11.1.1.1.4 United States: North America Pharmacokinetics Services Market Breakdown, by Service Type
- 11.1.1.1.5 United States: North America Pharmacokinetics Services Market Breakdown, by Therapeutic Application
- 11.1.1.1.6 United States: North America Pharmacokinetics Services Market Breakdown, by End User
- 11.1.1.2 Canada: North America Pharmacokinetics Services Market - Revenue and Forecast to 2031 (US$ Million)
- 11.1.1.2.1 Overview
- 11.1.1.2.2 Canada: North America Pharmacokinetics Services Market - Revenue and Forecast to 2031 (US$ Million)
- 11.1.1.2.3 Canada: North America Pharmacokinetics Services Market Breakdown, by Drug Type
- 11.1.1.2.4 Canada: North America Pharmacokinetics Services Market Breakdown, by Service Type
- 11.1.1.2.5 Canada: North America Pharmacokinetics Services Market Breakdown, by Therapeutic Application
- 11.1.1.2.6 Canada: North America Pharmacokinetics Services Market Breakdown, by End User
- 11.1.1.3 Mexico: North America Pharmacokinetics Services Market - Revenue and Forecast to 2031 (US$ Million)
- 11.1.1.3.1 Overview
- 11.1.1.3.2 Mexico: North America Pharmacokinetics Services Market - Revenue and Forecast to 2031 (US$ Million)
- 11.1.1.3.3 Mexico: North America Pharmacokinetics Services Market Breakdown, by Drug Type
- 11.1.1.3.4 Mexico: North America Pharmacokinetics Services Market Breakdown, by Service Type
- 11.1.1.3.5 Mexico: North America Pharmacokinetics Services Market Breakdown, by Therapeutic Application
- 11.1.1.3.6 Mexico: North America Pharmacokinetics Services Market Breakdown, by End User
- 11.1.1.1 United States: North America Pharmacokinetics Services Market - Revenue and Forecast to 2031 (US$ Million)
- 11.1.1 North America Pharmacokinetics Services Market Breakdown, by Key Countries, 2023 and 2031 (%)
12. Company Profile
- 12.1 Charles River Laboratories International Inc
- 12.1.1 Key Facts
- 12.1.2 Business Description
- 12.1.3 Products and Services
- 12.1.4 Financial Overview
- 12.1.5 SWOT Analysis
- 12.1.6 Key Developments
- 12.2 Eurofins Scientific SE
- 12.2.1 Key Facts
- 12.2.2 Business Description
- 12.2.3 Products and Services
- 12.2.4 Financial Overview
- 12.2.5 SWOT Analysis
- 12.2.6 Key Developments
- 12.3 Evotec SE
- 12.3.1 Key Facts
- 12.3.2 Business Description
- 12.3.3 Products and Services
- 12.3.4 Financial Overview
- 12.3.5 SWOT Analysis
- 12.3.6 Key Developments
- 12.4 Certara Inc.
- 12.4.1 Key Facts
- 12.4.2 Business Description
- 12.4.3 Products and Services
- 12.4.4 Financial Overview
- 12.4.5 SWOT Analysis
- 12.5 Parexel International Corp
- 12.5.1 Key Facts
- 12.5.2 Business Description
- 12.5.3 Products and Services
- 12.5.4 Financial Overview
- 12.5.5 SWOT Analysis
- 12.5.6 Key Developments
- 12.6 Thermo Fisher Scientific Inc.
- 12.6.1 Key Facts
- 12.6.2 Business Description
- 12.6.3 Products and Services
- 12.6.4 Financial Overview
- 12.6.5 SWOT Analysis
- 12.6.6 Key Developments
- 12.7 Allucent
- 12.7.1 Key Facts
- 12.7.2 Business Description
- 12.7.3 Products and Services
- 12.7.4 Financial Overview
- 12.7.5 SWOT Analysis
- 12.7.6 Key Developments
- 12.8 PACIFIC BIOLABS
- 12.8.1 Key Facts
- 12.8.2 Business Description
- 12.8.3 Products and Services
- 12.8.4 Financial Overview
- 12.8.5 SWOT Analysis
- 12.8.6 Key Developments
- 12.9 SGS SA
- 12.9.1 Key Facts
- 12.9.2 Business Description
- 12.9.3 Products and Services
- 12.9.4 Financial Overview
- 12.9.5 SWOT Analysis
- 12.9.6 Key Developments
13. Appendix
- 13.1 About The Insight Partners
- 13.2 Glossary of Terms for Pharmacokinetic Services Market
