|
|
市場調査レポート
商品コード
1597064
アジア太平洋の薬物動態サービス市場の将来予測 (2031年まで) - 地域別分析:薬剤の種類別、サービスの種類別、治療用途別、エンドユーザー別Asia Pacific Pharmacokinetics Services Market Forecast to 2031 - Regional Analysis - by Drug Type, Service Type, Therapeutic Application, and End User |
||||||
|
|||||||
|
|||||||

| アジア太平洋の薬物動態サービス市場の将来予測 (2031年まで) - 地域別分析:薬剤の種類別、サービスの種類別、治療用途別、エンドユーザー別 |
|
出版日: 2024年10月17日
発行: The Insight Partners
ページ情報: 英文 95 Pages
納期: 即納可能
|

全表示
- 概要
- 図表
- 目次
アジア太平洋の薬物動態サービス市場は、2023年に1億9,144万米ドルと評価され、2031年には3億5,658万米ドルに達すると予測され、2023年から2031年にかけて8.1%のCAGRを記録すると推定されています。
薬物動態のばらつきを理解するための生体内モデルおよび生体外モデルの採用が増加し、アジア太平洋の薬物動態サービス市場を促進
医薬品製造時に発生する膨大な薬物動態データの収集と処理は、高価で面倒で時間のかかる作業です。こうした作業には労力とコストがかかるため、薬物動態パラメータを予測するための薬物動態シミュレーションモデルやin vitro-in vivo薬物動態相関モデル (IVIVC) などのモデルの必要性が浮き彫りになっています。薬物動態シミュレーションモデルは、計算および数学的モデルを用いて、特定の条件下における生活環境での薬物動態を解釈するツールです。また、IVIVCモデルは創薬プロセスの基本的な部分です。医薬品開発の初期段階でPK/PD予測を分析することは、リード化合物の最適化戦略に必要であり、また、減少率をさらに低減するためにも必要です。薬物動態特性を改善し、特徴付けるための新しいin-vitroおよびin-vivo戦略の開発において、著しい進歩が見られます。IVIVCモデルは、薬剤のバイオアベイラビリティとその応用を分析する生物薬剤学的特性を評価するための費用効果の高い代替案として提案されています。したがって、このようなin-vivoおよびin-vitroモデルは、近い将来、アジア太平洋薬物動態サービス市場に有利な機会を提供すると予想されます。
アジア太平洋の薬物動態サービス市場の概要
中国におけるアジア太平洋薬物動態サービス市場の成長は、主に、確立された医薬品市場、製薬・バイオ医薬品企業による研究開発費の増加、運営コストの低下による臨床試験件数の増加、有利な規制政策の実施に起因しています。2023年に発表されたEFPIAの報告書によると、中国の製薬企業による研究開発費は2020年の108億1,423万米ドルから2021年には129億8,923万米ドルに増加しました。中国は世界第2位の医薬品市場です。同国の過剰な人口に加え、様々な非伝染性疾患や感染症の増加が新薬分子の必要性を煽り、中国をアジア太平洋の主要市場にしています。
アジア太平洋の薬物動態サービス市場の収益と2031年までの予測 (単位:100万米ドル)
アジア太平洋薬物動態サービス市場の内訳
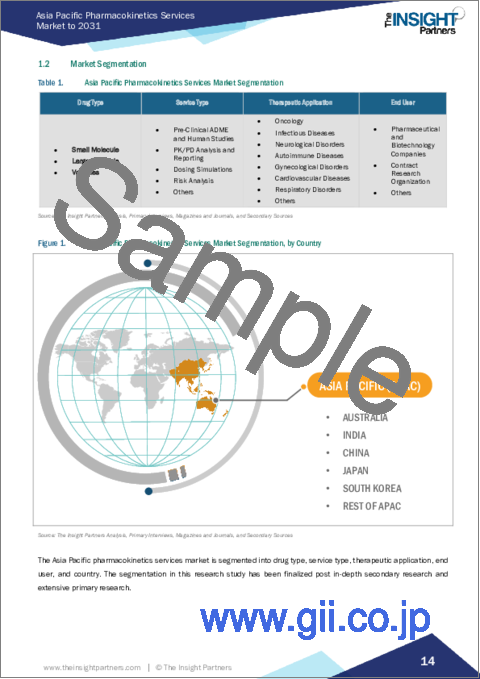
アジア太平洋の薬物動態サービス市場は、薬剤の種類別、サービスの種類別、治療用途別、エンドユーザー別、国別に分類されます。
薬剤の種類別では、アジア太平洋の薬物動態サービス市場は低分子、高分子、ワクチンに区分されます。低分子セグメントは2023年に最大の市場シェアを占めました。
サービスの種類別では、アジア太平洋の薬物動態サービス市場は前臨床ADMEおよびヒト試験、PK/PD解析および報告、投与シミュレーション、リスク解析、その他に分類されます。2023年には、前臨床ADMEおよびヒト試験セグメントが最大の市場シェアを占めています。
治療用途別では、アジア太平洋の薬物動態サービス市場は、がん、感染症、神経疾患、自己免疫疾患、婦人科疾患、心血管疾患、呼吸器疾患、その他に区分されます。2023年には、がん領域が最大の市場シェアを占めています。
エンドユーザー別では、アジア太平洋の薬物動態サービス市場は製薬・バイオテクノロジー企業、CRO、その他に区分されます。2023年にはCROが最大の市場シェアを占めました。
国別では、アジア太平洋の薬物動態サービス市場は中国、日本、インド、オーストラリア、韓国、その他アジア太平洋諸国に区分されます。2023年のアジア太平洋薬物動態サービスの市場シェアは日本が独占しています。
Allucent、Certara Inc.、Charles River Laboratories International Inc、Eurofins Scientific SE、PACIFIC BIOLABS、Parexel International Corp、SGS SA、Shanghai Medicilon Inc、Thermo Fisher Scientific Inc.などが、アジア太平洋の薬物動態サービス市場で事業を展開する主要企業です。
目次
第1章 イントロダクション
第2章 エグゼクティブサマリー
第3章 調査手法
第4章 アジア太平洋の薬物動態サービス市場:主要な市場力学
- 市場促進要因
- 慢性疾患・感染症の有病率の上昇
- 薬物動態研究への応用範囲の拡大
- CROへの薬物動態サービスのアウトソーシング
- 市場抑制要因
- 新興国における薬物動態サービス業者のリーチの制約
- 市場機会
- 薬物動態のばらつきを理解するための生体内・生体外モデルの採用増加
- 今後の動向
- 薬物動態サービスにおけるビッグデータ解析の採用増加
- 促進要因と阻害要因の影響
第5章 アジア太平洋の薬物動態サービス市場の分析
- アジア太平洋の薬物動態サービス市場の概要
- アジア太平洋の薬物動態サービス市場の収益 (2021~2031年)
第6章 アジア太平洋の薬物動態サービス市場の分析:薬剤の種類別
- 低分子
- 大型分子
- ワクチン
第7章 アジア太平洋の薬物動態サービス市場の分析:サービスの種類別
- 前臨床ADMEおよびヒト試験
- PK/PD分析とレポーティング
- 投与シミュレーション
- リスク分析
- その他
第8章 アジア太平洋の薬物動態サービス市場の分析:治療用途別
- がん領域
- 感染症
- 神経疾患
- 自己免疫疾患
- 婦人科疾患
- 循環器疾患
- 呼吸器疾患
- その他
第9章 アジア太平洋の薬物動態サービス市場の分析:エンドユーザー別
- 製薬・バイオテクノロジー企業
- CRO (医薬品開発業務受託機関)
- その他
第10章 アジア太平洋の薬物動態サービス市場:国別分析
- アジア太平洋
- 中国
- 日本
- インド
- オーストラリア
- 韓国
- その他のアジア太平洋諸国
第11章 企業プロファイル
- Charles River Laboratories International Inc
- Eurofins Scientific SE
- Certara Inc.
- Parexel International Corp
- Thermo Fisher Scientific Inc.
- Allucent
- PACIFIC BIOLABS
- SGS SA
- Shanghai Medicilon Inc.
第12章 付録
List Of Tables
- Table 1. Asia Pacific Pharmacokinetics Services Market Segmentation
- Table 2. China: Asia Pacific Pharmacokinetics Services Market - Revenue and Forecast to 2031 (US$ Million) - by Drug Type
- Table 3. China: Asia Pacific Pharmacokinetics Services Market - Revenue and Forecast to 2031 (US$ Million) - by Service Type
- Table 4. China: Asia Pacific Pharmacokinetics Services Market - Revenue and Forecast to 2031 (US$ Million) - by Therapeutic Application
- Table 5. China: Asia Pacific Pharmacokinetics Services Market - Revenue and Forecast to 2031 (US$ Million) - by End User
- Table 6. Japan: Asia Pacific Pharmacokinetics Services Market - Revenue and Forecast to 2031 (US$ Million) - by Drug Type
- Table 7. Japan: Asia Pacific Pharmacokinetics Services Market - Revenue and Forecast to 2031 (US$ Million) - by Service Type
- Table 8. Japan: Asia Pacific Pharmacokinetics Services Market - Revenue and Forecast to 2031 (US$ Million) - by Therapeutic Application
- Table 9. Japan: Asia Pacific Pharmacokinetics Services Market - Revenue and Forecast to 2031 (US$ Million) - by End User
- Table 10. R&D Expenditure of Indian Companies, 2018-2020 (US$ Million)
- Table 11. India: Asia Pacific Pharmacokinetics Services Market - Revenue and Forecast to 2031 (US$ Million) - by Drug Type
- Table 12. India: Asia Pacific Pharmacokinetics Services Market - Revenue and Forecast to 2031 (US$ Million) - by Service Type
- Table 13. India: Asia Pacific Pharmacokinetics Services Market - Revenue and Forecast to 2031 (US$ Million) - by Therapeutic Application
- Table 14. India: Asia Pacific Pharmacokinetics Services Market - Revenue and Forecast to 2031 (US$ Million) - by End User
- Table 15. Australia: Asia Pacific Pharmacokinetics Services Market - Revenue and Forecast to 2031 (US$ Million) - by Drug Type
- Table 16. Australia: Asia Pacific Pharmacokinetics Services Market - Revenue and Forecast to 2031 (US$ Million) - by Service Type
- Table 17. Australia: Asia Pacific Pharmacokinetics Services Market - Revenue and Forecast to 2031 (US$ Million) - by Therapeutic Application
- Table 18. Australia: Asia Pacific Pharmacokinetics Services Market - Revenue and Forecast to 2031 (US$ Million) - by End User
- Table 19. South Korea: Asia Pacific Pharmacokinetics Services Market - Revenue and Forecast to 2031 (US$ Million) - by Drug Type
- Table 20. South Korea: Asia Pacific Pharmacokinetics Services Market - Revenue and Forecast to 2031 (US$ Million) - by Service Type
- Table 21. South Korea: Asia Pacific Pharmacokinetics Services Market - Revenue and Forecast to 2031 (US$ Million) - by Therapeutic Application
- Table 22. South Korea: Asia Pacific Pharmacokinetics Services Market - Revenue and Forecast to 2031 (US$ Million) - by End User
- Table 23. Rest of Asia Pacific: Asia Pacific Pharmacokinetics Services Market - Revenue and Forecast to 2031 (US$ Million) - by Drug Type
- Table 24. Rest of Asia Pacific: Asia Pacific Pharmacokinetics Services Market - Revenue and Forecast to 2031 (US$ Million) - by Service Type
- Table 25. Rest of Asia Pacific: Asia Pacific Pharmacokinetics Services Market - Revenue and Forecast to 2031 (US$ Million) - by Therapeutic Application
- Table 26. Rest of Asia Pacific: Asia Pacific Pharmacokinetics Services Market - Revenue and Forecast to 2031 (US$ Million) - by End User
- Table 27. Glossary of Terms
List Of Figures
- Figure 1. Asia Pacific Pharmacokinetics Services Market Segmentation, by Country
- Figure 2. Asia Pacific Pharmacokinetics Services Market - Key Market Dynamics
- Figure 3. Impact Analysis of Drivers and Restraints
- Figure 4. Asia Pacific Pharmacokinetics Services Market Revenue (US$ Million), 2021-2031
- Figure 5. Asia Pacific Pharmacokinetics Services Market Share (%) - by Drug Type (2023 and 2031)
- Figure 6. Small Molecule: Asia Pacific Pharmacokinetics Services Market - Revenue and Forecast to 2031 (US$ Million)
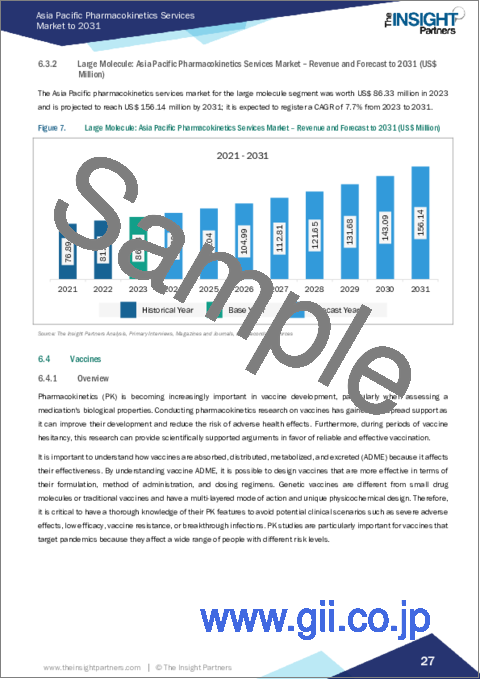
- Figure 7. Large Molecule: Asia Pacific Pharmacokinetics Services Market - Revenue and Forecast to 2031 (US$ Million)
- Figure 8. Vaccines: Asia Pacific Pharmacokinetics Services Market - Revenue and Forecast to 2031 (US$ Million)
- Figure 9. Asia Pacific Pharmacokinetics Services Market Share (%) - by Service Type (2023 and 2031)
- Figure 10. Pre-Clinical ADME and Human Studies: Asia Pacific Pharmacokinetics Services Market - Revenue and Forecast to 2031 (US$ Million)
- Figure 11. PK/PD Analysis and Reporting: Asia Pacific Pharmacokinetics Services Market - Revenue and Forecast to 2031 (US$ Million)
- Figure 12. Dosing Simulations: Asia Pacific Pharmacokinetics Services Market - Revenue and Forecast to 2031 (US$ Million)
- Figure 13. Risk Analysis: Asia Pacific Pharmacokinetics Services Market - Revenue and Forecast to 2031 (US$ Million)
- Figure 14. Others: Asia Pacific Pharmacokinetics Services Market - Revenue and Forecast to 2031 (US$ Million)
- Figure 15. Asia Pacific Pharmacokinetics Services Market Share (%) - by Therapeutic Application (2023 and 2031)
- Figure 16. Oncology: Asia Pacific Pharmacokinetics Services Market - Revenue and Forecast to 2031 (US$ Million)
- Figure 17. Infectious Diseases: Asia Pacific Pharmacokinetics Services Market - Revenue and Forecast to 2031 (US$ Million)
- Figure 18. Neurological Disorders: Asia Pacific Pharmacokinetics Services Market - Revenue and Forecast to 2031 (US$ Million)
- Figure 19. Autoimmune Diseases: Asia Pacific Pharmacokinetics Services Market - Revenue and Forecast to 2031 (US$ Million)
- Figure 20. Gynecological Disorders: Asia Pacific Pharmacokinetics Services Market - Revenue and Forecast to 2031 (US$ Million)
- Figure 21. Cardiovascular Diseases: Asia Pacific Pharmacokinetics Services Market - Revenue and Forecast to 2031 (US$ Million)
- Figure 22. Respiratory Disorders: Asia Pacific Pharmacokinetics Services Market - Revenue and Forecast to 2031 (US$ Million)
- Figure 23. Others: Asia Pacific Pharmacokinetics Services Market - Revenue and Forecast to 2031 (US$ Million)
- Figure 24. Asia Pacific Pharmacokinetics Services Market Share (%) - by End User (2023 and 2031)
- Figure 25. Pharmaceutical and Biotechnology Companies: Asia Pacific Pharmacokinetics Services Market - Revenue and Forecast to 2031 (US$ Million)
- Figure 26. Contract Research Organization: Asia Pacific Pharmacokinetics Services Market - Revenue and Forecast to 2031 (US$ Million)
- Figure 27. Others: Asia Pacific Pharmacokinetics Services Market - Revenue and Forecast to 2031 (US$ Million)
- Figure 28. Asia Pacific Pharmacokinetics Services Market - Revenue by Key Countries 2023 (US$ Million)
- Figure 29. Asia Pacific Pharmacokinetics Services Market Breakdown, by Key Countries, 2023 and 2031 (%)
- Figure 30. China: Asia Pacific Pharmacokinetics Services Market - Revenue and Forecast to 2031 (US$ Million)
- Figure 31. Japan: Asia Pacific Pharmacokinetics Services Market - Revenue and Forecast to 2031 (US$ Million)
- Figure 32. India: Asia Pacific Pharmacokinetics Services Market - Revenue and Forecast to 2031 (US$ Million)
- Figure 33. Australia: Asia Pacific Pharmacokinetics Services Market - Revenue and Forecast to 2031 (US$ Million)
- Figure 34. South Korea: Asia Pacific Pharmacokinetics Services Market - Revenue and Forecast to 2031 (US$ Million)
- Figure 35. Rest of Asia Pacific: Asia Pacific Pharmacokinetics Services Market - Revenue and Forecast to 2031 (US$ Million)
The Asia Pacific pharmacokinetics services market was valued at US$ 191.44 million in 2023 and is expected to reach US$ 356.58 million by 2031; it is estimated to register a CAGR of 8.1% from 2023 to 2031.
Increasing Adoption of In-Vivo and In-Vitro Models for Understanding Variability in Pharmacokinetics Boost Asia Pacific Pharmacokinetics Services Market
The collection and handling of huge pharmacokinetic data generated during drug manufacturing are expensive, tedious, and time-consuming tasks. The labor- and cost-intensive nature of these tasks highlights the need for models such as pharmacokinetic simulation models and in vitro-in vivo pharmacokinetic correlation models (IVIVC) for the prediction of pharmacokinetic parameters. The pharmacokinetic simulation model is a tool that interprets drug kinetics in the living environment under specific conditions using computational and mathematical models. In addition, the IVIVC model are a fundamental part of the drug discovery process. Analyzing PK/PD predictions at the early stages of drug development is necessary for lead optimization strategies and also to further reduce attrition rates. There have been significant advancements in the development of new in-vitro and in-vivo strategies to improve and characterize pharmacokinetic properties. IVIVC models are being proposed as a cost-effective alternative to assess the biopharmaceutical properties that analyze the bioavailability of drugs and their application. Hence, such in-vivo and in-vitro models are anticipated to provide lucrative opportunities for the Asia Pacific pharmacokinetics services market in the near future.
Asia Pacific Pharmacokinetics Services Market Overview
The Asia Pacific pharmacokinetics services market growth in China is primarily attributed to the established pharmaceutical market, increasing R&D expenditures by pharmaceutical and biopharmaceutical companies, rising number of clinical trials due to lower operating costs, and favorable regulatory policies in place. According to the EFPIA report published in 2023, R&D expenditure by pharmaceutical companies in China grew from US$ 10,814.23 million in 2020 to US$ 12,989.23 million in 2021. China has the world's second-largest pharmaceutical market. The excessive population in the country, coupled with a rise in the cases of various noncommunicable and infectious diseases, fuels the need for new drug molecules, which makes China a prime market in Asia Pacific.
Asia Pacific Pharmacokinetics Services Market Revenue and Forecast to 2031 (US$ Million)
Asia Pacific Pharmacokinetics Services Market Segmentation
The Asia Pacific pharmacokinetics services market is categorized into drug type, service type, therapeutic application, end user, and country.
Based on drug type, the Asia Pacific pharmacokinetics services market is segmented small molecule, large molecule, and vaccines. The small molecule segment held the largest market share in 2023.
In terms of service type, the Asia Pacific pharmacokinetics services market is categorized into pre-clinical ADME and human studies, PK/PD analysis and reporting, dosing simulations, risk analysis, and others. The pre-clinical ADME and human studies segment held the largest market share in 2023.
By therapeutic application, the Asia Pacific pharmacokinetics services market is segmented into oncology, infectious diseases, neurological disorders, autoimmune diseases, gynaecological disorders, cardiovascular diseases, respiratory disorders, and others. The oncology segment held the largest market share in 2023.
By end user, the Asia Pacific pharmacokinetics services market is segmented into pharmaceutical and biotechnology companies, contract research organization, and others. The contract research organization segment held the largest market share in 2023.
By country, the Asia Pacific pharmacokinetics services market is segmented into China, Japan, India, Australia, South Korea, and the Rest of Asia Pacific. Japan dominated the Asia Pacific pharmacokinetics services market share in 2023.
Allucent; Certara Inc.; Charles River Laboratories International Inc; Eurofins Scientific SE; PACIFIC BIOLABS; Parexel International Corp; SGS SA; Shanghai Medicilon Inc.; and Thermo Fisher Scientific Inc. are some of the leading companies operating in the Asia Pacific pharmacokinetics services market.
Table Of Contents
1. Introduction
- 1.1 The Insight Partners Research Report Guidance
- 1.2 Market Segmentation
2. Executive Summary
- 2.1 Key Insights
3. Research Methodology
- 3.1 Coverage
- 3.2 Secondary Research
- 3.3 Primary Research
4. Asia Pacific Pharmacokinetics Services Market - Key Market Dynamics
- 4.1 Market Drivers
- 4.1.1 Rising Prevalence of Chronic and Infectious Diseases
- 4.1.2 Expanding Range of Application of Pharmacokinetic Studies
- 4.1.3 Outsourcing of Pharmacokinetics Services to CROs
- 4.2 Market Restraints
- 4.2.1 Limited Reach of Pharmacokinetics Service Providers in Emerging Countries
- 4.3 Market Opportunities
- 4.3.1 Increasing Adoption of In-Vivo and In-Vitro Models for Understanding Variability in Pharmacokinetics
- 4.4 Future Trend
- 4.4.1 Increasing Adoption of Big Data Analytics in Pharmacokinetics Services
- 4.5 Impact of Drivers and Restraints:
5. Pharmacokinetics Services Market - Asia Pacific Analysis
- 5.1 Asia Pacific Pharmacokinetics Services Market Overview
- 5.2 Asia Pacific Pharmacokinetics Services Market Revenue (US$ Million), 2021-2031
6. Asia Pacific Pharmacokinetics Services Market Analysis - by Drug Type
- 6.1 Overview
- 6.2 Small Molecule
- 6.2.1 Overview
- 6.2.2 Small Molecule: Asia Pacific Pharmacokinetics Services Market - Revenue and Forecast to 2031 (US$ Million)
- 6.3 Large Molecule
- 6.3.1 Overview
- 6.3.2 Large Molecule: Asia Pacific Pharmacokinetics Services Market - Revenue and Forecast to 2031 (US$ Million)
- 6.4 Vaccines
- 6.4.1 Overview
- 6.4.2 Vaccines: Asia Pacific Pharmacokinetics Services Market - Revenue and Forecast to 2031 (US$ Million)
7. Asia Pacific Pharmacokinetics Services Market Analysis - by Service Type
- 7.1 Overview
- 7.2 Pre-Clinical ADME and Human Studies
- 7.2.1 Overview
- 7.2.2 Pre-Clinical ADME and Human Studies: Asia Pacific Pharmacokinetics Services Market - Revenue and Forecast to 2031 (US$ Million)
- 7.3 PK/PD Analysis and Reporting
- 7.3.1 Overview
- 7.3.2 PK/PD Analysis and Reporting: Asia Pacific Pharmacokinetics Services Market - Revenue and Forecast to 2031 (US$ Million)
- 7.4 Dosing Simulations
- 7.4.1 Overview
- 7.4.2 Dosing Simulations: Asia Pacific Pharmacokinetics Services Market - Revenue and Forecast to 2031 (US$ Million)
- 7.5 Risk Analysis
- 7.5.1 Overview
- 7.5.2 Risk Analysis: Asia Pacific Pharmacokinetics Services Market - Revenue and Forecast to 2031 (US$ Million)
- 7.6 Others
- 7.6.1 Overview
- 7.6.2 Others: Asia Pacific Pharmacokinetics Services Market - Revenue and Forecast to 2031 (US$ Million)
8. Asia Pacific Pharmacokinetics Services Market Analysis - by Therapeutic Application
- 8.1 Oncology
- 8.1.1 Overview
- 8.1.2 Oncology: Asia Pacific Pharmacokinetics Services Market - Revenue and Forecast to 2031 (US$ Million)
- 8.2 Infectious Diseases
- 8.2.1 Overview
- 8.2.2 Infectious Diseases: Asia Pacific Pharmacokinetics Services Market - Revenue and Forecast to 2031 (US$ Million)
- 8.3 Neurological Disorders
- 8.3.1 Overview
- 8.3.2 Neurological Disorders: Asia Pacific Pharmacokinetics Services Market - Revenue and Forecast to 2031 (US$ Million)
- 8.4 Autoimmune Diseases
- 8.4.1 Overview
- 8.4.2 Autoimmune Diseases: Asia Pacific Pharmacokinetics Services Market - Revenue and Forecast to 2031 (US$ Million)
- 8.5 Gynecological Disorders
- 8.5.1 Overview
- 8.5.2 Gynecological Disorders: Asia Pacific Pharmacokinetics Services Market - Revenue and Forecast to 2031 (US$ Million)
- 8.6 Cardiovascular Diseases
- 8.6.1 Overview
- 8.6.2 Cardiovascular Diseases: Asia Pacific Pharmacokinetics Services Market - Revenue and Forecast to 2031 (US$ Million)
- 8.7 Respiratory Disorders
- 8.7.1 Overview
- 8.7.2 Respiratory Disorders: Asia Pacific Pharmacokinetics Services Market - Revenue and Forecast to 2031 (US$ Million)
- 8.8 Others
- 8.8.1 Overview
- 8.8.2 Others: Asia Pacific Pharmacokinetics Services Market - Revenue and Forecast to 2031 (US$ Million)
9. Asia Pacific Pharmacokinetics Services Market Analysis - by End User
- 9.1 Pharmaceutical and Biotechnology Companies
- 9.1.1 Overview
- 9.1.2 Pharmaceutical and Biotechnology Companies: Asia Pacific Pharmacokinetics Services Market - Revenue and Forecast to 2031 (US$ Million)
- 9.2 Contract Research Organization
- 9.2.1 Overview
- 9.2.2 Contract Research Organization: Asia Pacific Pharmacokinetics Services Market - Revenue and Forecast to 2031 (US$ Million)
- 9.3 Others
- 9.3.1 Overview
- 9.3.2 Others: Asia Pacific Pharmacokinetics Services Market - Revenue and Forecast to 2031 (US$ Million)
10. Asia Pacific Pharmacokinetics Services Market - Country Analysis
- 10.1 Asia Pacific
- 10.1.1 Asia Pacific Pharmacokinetics Services Market Breakdown, by Key Countries, 2023 and 2031 (%)
- 10.1.1.1 China: Asia Pacific Pharmacokinetics Services Market - Revenue and Forecast to 2031 (US$ Million)
- 10.1.1.1.1 Overview
- 10.1.1.1.2 China: Asia Pacific Pharmacokinetics Services Market - Revenue and Forecast to 2031 (US$ Million)
- 10.1.1.1.3 China: Asia Pacific Pharmacokinetics Services Market Breakdown, by Drug Type
- 10.1.1.1.4 China: Asia Pacific Pharmacokinetics Services Market Breakdown, by Service Type
- 10.1.1.1.5 China: Asia Pacific Pharmacokinetics Services Market Breakdown, by Therapeutic Application
- 10.1.1.1.6 China: Asia Pacific Pharmacokinetics Services Market Breakdown, by End User
- 10.1.1.2 Japan: Asia Pacific Pharmacokinetics Services Market - Revenue and Forecast to 2031 (US$ Million)
- 10.1.1.2.1 Overview
- 10.1.1.2.2 Japan: Asia Pacific Pharmacokinetics Services Market - Revenue and Forecast to 2031 (US$ Million)
- 10.1.1.2.3 Japan: Asia Pacific Pharmacokinetics Services Market Breakdown, by Drug Type
- 10.1.1.2.4 Japan: Asia Pacific Pharmacokinetics Services Market Breakdown, by Service Type
- 10.1.1.2.5 Japan: Asia Pacific Pharmacokinetics Services Market Breakdown, by Therapeutic Application
- 10.1.1.2.6 Japan: Asia Pacific Pharmacokinetics Services Market Breakdown, by End User
- 10.1.1.3 India: Asia Pacific Pharmacokinetics Services Market - Revenue and Forecast to 2031 (US$ Million)
- 10.1.1.3.1 Overview
- 10.1.1.3.2 India: Asia Pacific Pharmacokinetics Services Market - Revenue and Forecast to 2031 (US$ Million)
- 10.1.1.3.3 India: Asia Pacific Pharmacokinetics Services Market Breakdown, by Drug Type
- 10.1.1.3.4 India: Asia Pacific Pharmacokinetics Services Market Breakdown, by Service Type
- 10.1.1.3.5 India: Asia Pacific Pharmacokinetics Services Market Breakdown, by Therapeutic Application
- 10.1.1.3.6 India: Asia Pacific Pharmacokinetics Services Market Breakdown, by End User
- 10.1.1.4 Australia: Asia Pacific Pharmacokinetics Services Market - Revenue and Forecast to 2031 (US$ Million)
- 10.1.1.4.1 Overview
- 10.1.1.4.2 Australia: Asia Pacific Pharmacokinetics Services Market - Revenue and Forecast to 2031 (US$ Million)
- 10.1.1.4.3 Australia: Asia Pacific Pharmacokinetics Services Market Breakdown, by Drug Type
- 10.1.1.4.4 Australia: Asia Pacific Pharmacokinetics Services Market Breakdown, by Service Type
- 10.1.1.4.5 Australia: Asia Pacific Pharmacokinetics Services Market Breakdown, by Therapeutic Application
- 10.1.1.4.6 Australia: Asia Pacific Pharmacokinetics Services Market Breakdown, by End User
- 10.1.1.5 South Korea: Asia Pacific Pharmacokinetics Services Market - Revenue and Forecast to 2031 (US$ Million)
- 10.1.1.5.1 Overview
- 10.1.1.5.2 South Korea: Asia Pacific Pharmacokinetics Services Market - Revenue and Forecast to 2031 (US$ Million)
- 10.1.1.5.3 South Korea: Asia Pacific Pharmacokinetics Services Market Breakdown, by Drug Type
- 10.1.1.5.4 South Korea: Asia Pacific Pharmacokinetics Services Market Breakdown, by Service Type
- 10.1.1.5.5 South Korea: Asia Pacific Pharmacokinetics Services Market Breakdown, by Therapeutic Application
- 10.1.1.5.6 South Korea: Asia Pacific Pharmacokinetics Services Market Breakdown, by End User
- 10.1.1.6 Rest of Asia Pacific: Asia Pacific Pharmacokinetics Services Market - Revenue and Forecast to 2031 (US$ Million)
- 10.1.1.6.1 Overview
- 10.1.1.6.2 Rest of Asia Pacific: Asia Pacific Pharmacokinetics Services Market - Revenue and Forecast to 2031 (US$ Million)
- 10.1.1.6.3 Rest of Asia Pacific: Asia Pacific Pharmacokinetics Services Market Breakdown, by Drug Type
- 10.1.1.6.4 Rest of Asia Pacific: Asia Pacific Pharmacokinetics Services Market Breakdown, by Service Type
- 10.1.1.6.5 Rest of Asia Pacific: Asia Pacific Pharmacokinetics Services Market Breakdown, by Therapeutic Application
- 10.1.1.6.6 Rest of Asia Pacific: Asia Pacific Pharmacokinetics Services Market Breakdown, by End User
- 10.1.1.1 China: Asia Pacific Pharmacokinetics Services Market - Revenue and Forecast to 2031 (US$ Million)
- 10.1.1 Asia Pacific Pharmacokinetics Services Market Breakdown, by Key Countries, 2023 and 2031 (%)
11. Company Profile
- 11.1 Charles River Laboratories International Inc
- 11.1.1 Key Facts
- 11.1.2 Business Description
- 11.1.3 Products and Services
- 11.1.4 Financial Overview
- 11.1.5 SWOT Analysis
- 11.1.6 Key Developments
- 11.2 Eurofins Scientific SE
- 11.2.1 Key Facts
- 11.2.2 Business Description
- 11.2.3 Products and Services
- 11.2.4 Financial Overview
- 11.2.5 SWOT Analysis
- 11.2.6 Key Developments
- 11.3 Certara Inc.
- 11.3.1 Key Facts
- 11.3.2 Business Description
- 11.3.3 Products and Services
- 11.3.4 Financial Overview
- 11.3.5 SWOT Analysis
- 11.4 Parexel International Corp
- 11.4.1 Key Facts
- 11.4.2 Business Description
- 11.4.3 Products and Services
- 11.4.4 Financial Overview
- 11.4.5 SWOT Analysis
- 11.4.6 Key Developments
- 11.5 Thermo Fisher Scientific Inc.
- 11.5.1 Key Facts
- 11.5.2 Business Description
- 11.5.3 Products and Services
- 11.5.4 Financial Overview
- 11.5.5 SWOT Analysis
- 11.5.6 Key Developments
- 11.6 Allucent
- 11.6.1 Key Facts
- 11.6.2 Business Description
- 11.6.3 Products and Services
- 11.6.4 Financial Overview
- 11.6.5 SWOT Analysis
- 11.6.6 Key Developments
- 11.7 PACIFIC BIOLABS
- 11.7.1 Key Facts
- 11.7.2 Business Description
- 11.7.3 Products and Services
- 11.7.4 Financial Overview
- 11.7.5 SWOT Analysis
- 11.7.6 Key Developments
- 11.8 SGS SA
- 11.8.1 Key Facts
- 11.8.2 Business Description
- 11.8.3 Products and Services
- 11.8.4 Financial Overview
- 11.8.5 SWOT Analysis
- 11.8.6 Key Developments
- 11.9 Shanghai Medicilon Inc.
- 11.9.1 Key Facts
- 11.9.2 Business Description
- 11.9.3 Products and Services
- 11.9.4 Financial Overview
- 11.9.5 SWOT Analysis
- 11.9.6 Key Developments
12. Appendix
- 12.1 About The Insight Partners
- 12.2 Glossary of Terms for Pharmacokinetic Services Market
