|
|
市場調査レポート
商品コード
1562223
北米の電子機器・半導体向け支出分析市場:2030年市場予測- 地域別分析- コンポーネント、タイプ、展開、用途別North America Spend Analytics for Electronics and Semiconductor Market Forecast to 2030 - Regional analysis - by Component, Type, Deployment, and Application |
||||||
|
|||||||
|
|||||||

| 北米の電子機器・半導体向け支出分析市場:2030年市場予測- 地域別分析- コンポーネント、タイプ、展開、用途別 |
|
出版日: 2024年07月04日
発行: The Insight Partners
ページ情報: 英文 87 Pages
納期: 即納可能
|

全表示
- 概要
- 図表
- 目次
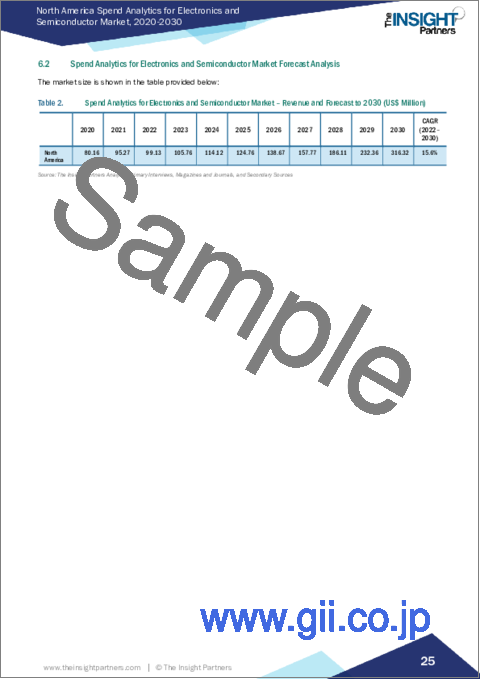
北米の電子機器・半導体向け支出分析市場は、2022年に9,913万米ドルと評価され、2030年には3億1,632万米ドルに達すると予測され、2022年から2030年までのCAGRは15.6%と推定されます。
家電需要の増加が北米の電子・半導体市場の支出分析を促進
電子機器・半導体市場では、スマートフォン、タブレット、ウェアラブル機器、その他の家電製品に対する需要が大幅に急増しました。この需要の増加は、業界における支出分析の必要性を浮き彫りにしました。民生用電子機器市場が拡大するにつれ、この分野の企業は、市場競争を維持し、変化する顧客の嗜好に対応するために、支出を効率的に管理するという課題に直面しました。支出分析ソリューションの導入は、支出パターンに関する貴重な洞察を提供し、コスト最適化の機会を特定し、情報に基づいた意思決定を促進することで、この目まぐるしく変化する市場において企業が適応性と対応力を維持できるようにするため、極めて重要になりました。また、支出分析は、企業が調達プロセスを合理化し、コスト削減の可能性のある分野を特定し、消費者向け電子機器の需要増に対応するために戦略的にリソースを配分するのに役立ち、電子機器・半導体向け支出分析市場の成長を後押ししています。
北米の電子機器・半導体向け支出分析市場の概要
北米の電子機器・半導体向け支出分析市場は、確立された成熟市場であり、調達プロセスの最適化とコスト削減を推進するためにアナリティクスを活用することに高いレベルの導入と強い関心を示しています。特に米国は、世界および北米の電子機器・半導体向け支出分析市場で大きな存在感を示しています。IBM Corporation、Lytica Inc、SAP、およびZycusは、米国で事業を展開し、顧客組織のニーズに合わせた洗練されたアナリティクス・ソリューションを提供する定評ある企業です。これらの企業は市場力学を深く理解しており、包括的な分析ツールを提供することで、企業は支出パターンに関する貴重な認識を得て、情報に基づいた意思決定を行うことができ、電子機器・半導体市場の支出分析市場の成長にさらに貢献しています。2023年6月、世界の経営コンサルティング会社であるKearneyは、Simfoniの投資ラウンドを主導し、投資額~800万米ドルを調達しました。Simfoni(本社サンフランシスコ)は、支出分析、e-ソーシング、テール支出管理のソリューションを提供しています。シリーズA-2として知られるこの投資ラウンドは、KearneyがSimfoniの電子・半導体市場向け支出分析ソリューションと成長の可能性に自信を持ち、支援していることを意味します。
北米の電子機器・半導体向け支出分析市場の収益と2030年までの予測(金額)
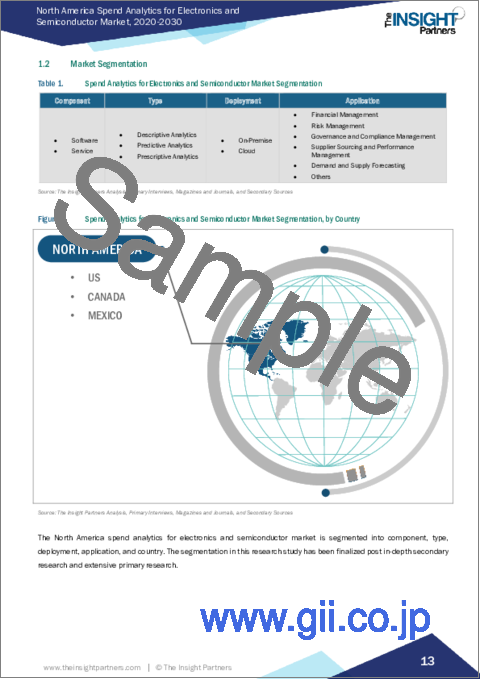
北米の電子機器・半導体向け支出分析市場のセグメンテーション
北米の電子機器・半導体向け支出分析市場は、コンポーネント、タイプ、展開、用途、国に基づいてセグメント化されます。コンポーネントに基づいて、北米の電子機器・半導体向け支出分析市場はソフトウェアとサービスに二分されます。2022年の市場シェアはソフトウェアサービスが大きいです。
タイプ別では、北米の電子機器・半導体向け支出分析市場は、記述的分析、予測的分析、処方的分析に区分されます。予測的分析が2022年に最大の市場シェアを占めました。
展開の面では、北米の電子・半導体向け支出アナリティクス市場はオンプレミスとクラウドに二分されます。2022年の市場シェアはクラウドの方が大きいです。
用途別では、北米の電子機器・半導体向け支出分析市場は、財務管理、リスク管理、ガバナンス・コンプライアンス管理、サプライヤーソーシング・パフォーマンス管理、需要&供給予測、その他に区分されます。サプライヤーソーシング・パフォーマンス管理は2022年に最大の市場シェアを占めました。
国別に見ると、北米の電子機器・半導体向け支出分析市場は、米国、カナダ、メキシコに区分されます。2022年の電子機器・半導体向け北米支出アナリティクス市場シェアは米国が独占しました。
Coupa Software Inc、International Business Machines Corp、Ivalua Inc、Lytica Inc、NB Ventures Inc、SAP SE、Scanmarket AS、Synertrade Inc、Zycus Incは、北米の電子・半導体向け支出アナリティクス市場で事業を展開する主要企業です。
目次
第1章 イントロダクション
第2章 エグゼクティブサマリー
- 主要洞察
- 市場の魅力
第3章 調査手法
- 調査範囲
- 2次調査
- 1次調査
第4章 電子機器・半導体向け支出分析市場の展望
- エコシステム分析
第5章 北米のエレクトロニクスと半導体向け支出分析市場-主要市場力学
- 市場促進要因
- コンシューマーエレクトロニクス需要の増加
- 原材料価格の変動
- 市場抑制要因
- 技術の複雑さ
- 市場機会
- サプライチェーンの混乱
- 電子機器の小型化
- 今後の動向
- AIベースの支出分析の導入拡大
- 促進要因と抑制要因の影響
第6章 北米の電子機器・半導体向け支出分析市場:市場分析
- 電子機器・半導体向け支出分析市場収益(2022年~2030年)
- 電子機器・半導体向け支出分析市場予測分析
第7章 北米の電子機器・半導体向け支出分析市場分析:コンポーネント別
- ソフトウェア
- サービス
第8章 北米の電子機器・半導体向け支出分析市場分析:タイプ別
- 記述的分析
- 予測的分析
- 処方的分析
第9章 北米の電子機器・半導体向け支出分析市場分析:展開別
- オンプレミス
- クラウド
第10章 北米の電子機器・半導体向け支出分析市場分析:用途別
- 財務管理
- リスク管理
- ガバナンス・コンプライアンス管理
- サプライヤーソーシング・パフォーマンス管理
- 需要と供給の予測
- その他
第11章 北米の電子機器・半導体向け支出分析市場:国別分析
- 北米市場概要
- 北米
- 米国
- カナダ
- メキシコ
- 北米
第12章 競合情勢
- 主要プレーヤー別ヒートマップ分析
第13章 業界情勢
- 市場イニシアティブ
- 製品開発
- 合併と買収
第14章 企業プロファイル
- Coupa Software Inc
- International Business Machines Corp
- Ivalua Inc
- Lytica Inc
- NB Ventures Inc
- SAP SE
- Scanmarket AS
- Synertrade Inc
- Zycus Inc
第15章 付録
List Of Tables
- Table 1. Spend Analytics for Electronics and Semiconductor Market Segmentation
- Table 2. Spend Analytics for Electronics and Semiconductor Market - Revenue and Forecast to 2030 (US$ Million)
- Table 3. Spend Analytics for Electronics and Semiconductor Market - Revenue and Forecast to 2030 (US$ Million) - by Component
- Table 4. Spend Analytics for Electronics and Semiconductor Market - Revenue and Forecast to 2030 (US$ Million) - by Type
- Table 5. Spend Analytics for Electronics and Semiconductor Market - Revenue and Forecast to 2030 (US$ Million) - by Deployment
- Table 6. Spend Analytics for Electronics and Semiconductor Market - Revenue and Forecast to 2030 (US$ Million) - by Application
- Table 7. North America: Spend Analytics for Electronics and Semiconductor Market - Revenue and Forecast to 2030 (US$ Million) - by Country
- Table 8. United States: Spend Analytics for Electronics and Semiconductor Market - Revenue and Forecast to 2030 (US$ Million) - by Component
- Table 9. United States: Spend Analytics for Electronics and Semiconductor Market - Revenue and Forecast to 2030 (US$ Million) - by Type
- Table 10. United States: Spend Analytics for Electronics and Semiconductor Market - Revenue and Forecast to 2030 (US$ Million) - by Deployment
- Table 11. United States: Spend Analytics for Electronics and Semiconductor Market - Revenue and Forecast to 2030 (US$ Million) - by Application
- Table 12. Canada: Spend Analytics for Electronics and Semiconductor Market - Revenue and Forecast to 2030 (US$ Million) - by Component
- Table 13. Canada: Spend Analytics for Electronics and Semiconductor Market - Revenue and Forecast to 2030 (US$ Million) - by Type
- Table 14. Canada: Spend Analytics for Electronics and Semiconductor Market - Revenue and Forecast to 2030 (US$ Million) - by Deployment
- Table 15. Canada: Spend Analytics for Electronics and Semiconductor Market - Revenue and Forecast to 2030 (US$ Million) - by Application
- Table 16. Mexico: Spend Analytics for Electronics and Semiconductor Market - Revenue and Forecast to 2030 (US$ Million) - by Component
- Table 17. Mexico: Spend Analytics for Electronics and Semiconductor Market - Revenue and Forecast to 2030 (US$ Million) - by Type
- Table 18. Mexico: Spend Analytics for Electronics and Semiconductor Market - Revenue and Forecast to 2030 (US$ Million) - by Deployment
- Table 19. Mexico: Spend Analytics for Electronics and Semiconductor Market - Revenue and Forecast to 2030 (US$ Million) - by Application
- Table 20. Heat Map Analysis By Key Players
- Table 21. List of Abbreviation
List Of Figures
- Figure 1. Spend Analytics for Electronics and Semiconductor Market Segmentation, by Country
- Figure 2. Ecosystem: Spend Analytics for Electronics and Semiconductor Market
- Figure 3. Spend Analytics for Electronics and Semiconductor Market - Key Market Dynamics
- Figure 4. Impact Analysis of Drivers and Restraints
- Figure 5. Spend Analytics for Electronics and Semiconductor Market Revenue (US$ Million), 2022-2030
- Figure 6. Spend Analytics for Electronics and Semiconductor Market Share (%) - by Component (2022 and 2030)
- Figure 7. Software: Spend Analytics for Electronics and Semiconductor Market - Revenue and Forecast to 2030 (US$ Million)
- Figure 8. Service: Spend Analytics for Electronics and Semiconductor Market - Revenue and Forecast to 2030 (US$ Million)
- Figure 9. Spend Analytics for Electronics and Semiconductor Market Share (%) - by Type (2022 and 2030)
- Figure 10. Descriptive Analytics: Spend Analytics for Electronics and Semiconductor Market - Revenue and Forecast to 2030 (US$ Million)
- Figure 11. Predictive Analytics: Spend Analytics for Electronics and Semiconductor Market - Revenue and Forecast to 2030 (US$ Million)
- Figure 12. Prescriptive Analytics: Spend Analytics for Electronics and Semiconductor Market - Revenue and Forecast to 2030 (US$ Million)
- Figure 13. Spend Analytics for Electronics and Semiconductor Market Share (%) - by Deployment (2022 and 2030)
- Figure 14. On-Premise: Spend Analytics for Electronics and Semiconductor Market - Revenue and Forecast to 2030 (US$ Million)
- Figure 15. Cloud: Spend Analytics for Electronics and Semiconductor Market - Revenue and Forecast to 2030 (US$ Million)
- Figure 16. Spend Analytics for Electronics and Semiconductor Market Share (%) - by Application (2022 and 2030)
- Figure 17. Financial Management: Spend Analytics for Electronics and Semiconductor Market - Revenue and Forecast to 2030 (US$ Million)
- Figure 18. Risk Management: Spend Analytics for Electronics and Semiconductor Market - Revenue and Forecast to 2030 (US$ Million)
- Figure 19. Governance and Compliance Management: Spend Analytics for Electronics and Semiconductor Market - Revenue and Forecast to 2030 (US$ Million)
- Figure 20. Supplier Sourcing and Performance Management: Spend Analytics for Electronics and Semiconductor Market - Revenue and Forecast to 2030 (US$ Million)
- Figure 21. Demand and Supply Forecasting: Spend Analytics for Electronics and Semiconductor Market - Revenue and Forecast to 2030 (US$ Million)
- Figure 22. Others: Spend Analytics for Electronics and Semiconductor Market - Revenue and Forecast to 2030 (US$ Million)
- Figure 23. Spend Analytics for Electronics and Semiconductor Market, by Key Countries - Revenue (2022) (US$ Million)
- Figure 24. North America: Spend Analytics for Electronics and Semiconductor Market Breakdown, by Key Countries, 2022 and 2030 (%)
- Figure 25. United States: Spend Analytics for Electronics and Semiconductor Market - Revenue and Forecast to 2030 (US$ Million)
- Figure 26. Canada: Spend Analytics for Electronics and Semiconductor Market - Revenue and Forecast to 2030 (US$ Million)
- Figure 27. Mexico: Spend Analytics for Electronics and Semiconductor Market - Revenue and Forecast to 2030 (US$ Million)
The North America spend analytics for electronics and semiconductor market was valued at US$ 99.13 million in 2022 and is expected to reach US$ 316.32 million by 2030; it is estimated to register a CAGR of 15.6% from 2022 to 2030.
Rise in Demand for Consumer Electronics Fuels North America Spend Analytics for Electronics and Semiconductor Market
The electronics and semiconductor market experienced a significant surge in demand for smartphones, tablets, wearable devices, and other consumer electronics. This increase in demand highlighted the necessity for spending analytics within the industry. As the consumer electronics market expanded, companies in this sector faced the challenge of efficiently managing their expenditures to maintain competitiveness and meet their customers' changing preferences. The adoption of spend analytics solutions became crucial as it provided valuable insights into spending patterns, identified opportunities for cost optimization, and facilitated informed decision-making to ensure companies remained adaptable and responsive in this fast-paced market. Also, spend analytics help companies streamline their procurement processes, identify potential areas for cost reduction, and strategically allocate resources to meet the growing demand for consumer electronics, which boosts the spend analytics for electronics and semiconductor market growth.
North America Spend Analytics for Electronics and Semiconductor Market Overview
The spend analytics for electronics and semiconductor market in North America is a well-established and mature one, exhibiting a high level of adoption and strong focus on leveraging analytics to optimize procurement processes as well as drive cost savings. Particularly, the US has significant presence in the global and North American spend analytics for electronics and semiconductor market. IBM Corporation, Lytica Inc, SAP, and Zycus are among the established players operating in the US that offer sophisticated analytics solutions tailored to the needs of their client organizations. These players have a deep understanding of the market dynamics and provide comprehensive analytics tools that allow businesses to gain valuable perceptions of their spending patterns and make informed decisions, further contributing to the growth of spend analytics for electronics and semiconductor market. In June 2023, Kearney, a global management consulting firm, led the investment round for Simfoni, raising the investment amount of ~US$ 8 million. Simfoni (based in San Francisco) provides solutions for spend analytics, e-sourcing, and tail spend management. This investment round, known as Series A-2, signifies Kearney's confidence and support in Simfoni's offerings and potential for growth in the spend analytics for electronics and semiconductor market.
North America Spend Analytics for Electronics and Semiconductor Market Revenue and Forecast to 2030 (US$ Million)
North America Spend Analytics for Electronics and Semiconductor Market Segmentation
The North America spend analytics for electronics and semiconductor market is segmented based on component, type, deployment, application, and country. Based on component, the North America spend analytics for electronics and semiconductor market is bifurcated into software and services. The software services held a larger market share in 2022.
Based on type, the North America spend analytics for electronics and semiconductor market is segmented into descriptive analytics, predictive analytics, and prescriptive analytics. The predictive analytics held the largest market share in 2022.
In terms of deployment, the North America spend analytics for electronics and semiconductor market is bifurcated into on-premise and cloud. The cloud held a larger market share in 2022.
By application, the North America spend analytics for electronics and semiconductor market is segmented into financial management, risk management, governance & compliance management, supplier sourcing & performance management, demand & supply forecasting, and others. The supplier sourcing & performance management held the largest market share in 2022.
Based on country, the North America spend analytics for electronics and semiconductor market is segmented into the US, Canada, and Mexico. The US dominated the North America spend analytics for electronics and semiconductor market share in 2022.
Coupa Software Inc, International Business Machines Corp, Ivalua Inc, Lytica Inc, NB Ventures Inc, SAP SE, Scanmarket AS, Synertrade Inc, and Zycus Inc are some of the leading companies operating in the North America spend analytics for electronics and semiconductor market.
Table Of Contents
1. Introduction
- 1.1 The Insight Partners Research Report Guidance
- 1.2 Market Segmentation
2. Executive Summary
- 2.1 Key Insights
- 2.2 Market Attractiveness
3. Research Methodology
- 3.1 Coverage
- 3.2 Secondary Research
- 3.3 Primary Research
4. Spend Analytics for Electronics and Semiconductor Market Landscape
- 4.1 Overview
- 4.2 Ecosystem Analysis
5. North America Spend Analytics for Electronics and Semiconductor Market - Key Market Dynamics
- 5.1 Market Drivers
- 5.1.1 Rise in Demand for Consumer Electronics
- 5.1.2 Fluctuations in Raw Materials Prices
- 5.2 Market Restraints
- 5.2.1 Technological Complexity
- 5.3 Market Opportunities
- 5.3.1 Rise in Supply Chain Disruption
- 5.3.2 Incorporation of Miniaturized Electronic Devices
- 5.4 Future Trends
- 5.4.1 Growing Implementation of AI-based Spend Analytics
- 5.5 Impact of Drivers and Restraints:
6. North America Spend Analytics for Electronics and Semiconductor Market -Market Analysis
- 6.1 Spend Analytics for Electronics and Semiconductor Market Revenue (US$ Million), 2022-2030
- 6.2 Spend Analytics for Electronics and Semiconductor Market Forecast Analysis
7. North America Spend Analytics for Electronics and Semiconductor Market Analysis - by Component
- 7.1 Software
- 7.1.1 Overview
- 7.1.2 Software: Spend Analytics for Electronics and Semiconductor Market - Revenue and Forecast to 2030 (US$ Million)
- 7.2 Service
- 7.2.1 Overview
- 7.2.2 Service: Spend Analytics for Electronics and Semiconductor Market - Revenue and Forecast to 2030 (US$ Million)
8. North America Spend Analytics for Electronics and Semiconductor Market Analysis - by Type
- 8.1 Descriptive Analytics
- 8.1.1 Overview
- 8.1.2 Descriptive Analytics: Spend Analytics for Electronics and Semiconductor Market - Revenue and Forecast to 2030 (US$ Million)
- 8.2 Predictive Analytics
- 8.2.1 Overview
- 8.2.2 Predictive Analytics: Spend Analytics for Electronics and Semiconductor Market - Revenue and Forecast to 2030 (US$ Million)
- 8.3 Prescriptive Analytics
- 8.3.1 Overview
- 8.3.2 Prescriptive Analytics: Spend Analytics for Electronics and Semiconductor Market - Revenue and Forecast to 2030 (US$ Million)
9. North America Spend Analytics for Electronics and Semiconductor Market Analysis - by Deployment
- 9.1 On-Premise
- 9.1.1 Overview
- 9.1.2 On-Premise: Spend Analytics for Electronics and Semiconductor Market - Revenue and Forecast to 2030 (US$ Million)
- 9.2 Cloud
- 9.2.1 Overview
- 9.2.2 Cloud: Spend Analytics for Electronics and Semiconductor Market - Revenue and Forecast to 2030 (US$ Million)
10. North America Spend Analytics for Electronics and Semiconductor Market Analysis - by Application
- 10.1 Financial Management
- 10.1.1 Overview
- 10.1.2 Financial Management: Spend Analytics for Electronics and Semiconductor Market - Revenue and Forecast to 2030 (US$ Million)
- 10.2 Risk Management
- 10.2.1 Overview
- 10.2.2 Risk Management: Spend Analytics for Electronics and Semiconductor Market - Revenue and Forecast to 2030 (US$ Million)
- 10.3 Governance and Compliance Management
- 10.3.1 Overview
- 10.3.2 Governance and Compliance Management: Spend Analytics for Electronics and Semiconductor Market - Revenue and Forecast to 2030 (US$ Million)
- 10.4 Supplier Sourcing and Performance Management
- 10.4.1 Overview
- 10.4.2 Supplier Sourcing and Performance Management: Spend Analytics for Electronics and Semiconductor Market - Revenue and Forecast to 2030 (US$ Million)
- 10.5 Demand and Supply Forecasting
- 10.5.1 Overview
- 10.5.2 Demand and Supply Forecasting: Spend Analytics for Electronics and Semiconductor Market - Revenue and Forecast to 2030 (US$ Million)
- 10.6 Others
- 10.6.1 Overview
- 10.6.2 Others: Spend Analytics for Electronics and Semiconductor Market - Revenue and Forecast to 2030 (US$ Million)
11. North America Spend Analytics for Electronics and Semiconductor Market - Country Analysis
- 11.1 North America Market Overview
- 11.1.1 North America: Spend Analytics for Electronics and Semiconductor Market - Revenue and Forecast Analysis - by Country
- 11.1.1.1 North America: Spend Analytics for Electronics and Semiconductor Market - Revenue and Forecast Analysis - by Country
- 11.1.1.2 United States: Spend Analytics for Electronics and Semiconductor Market - Revenue and Forecast to 2030 (US$ Million)
- 11.1.1.2.1 United States: Spend Analytics for Electronics and Semiconductor Market Breakdown, by Component
- 11.1.1.2.2 United States: Spend Analytics for Electronics and Semiconductor Market Breakdown, by Type
- 11.1.1.2.3 United States: Spend Analytics for Electronics and Semiconductor Market Breakdown, by Deployment
- 11.1.1.2.4 United States: Spend Analytics for Electronics and Semiconductor Market Breakdown, by Application
- 11.1.1.3 Canada: Spend Analytics for Electronics and Semiconductor Market - Revenue and Forecast to 2030 (US$ Million)
- 11.1.1.3.1 Canada: Spend Analytics for Electronics and Semiconductor Market Breakdown, by Component
- 11.1.1.3.2 Canada: Spend Analytics for Electronics and Semiconductor Market Breakdown, by Type
- 11.1.1.3.3 Canada: Spend Analytics for Electronics and Semiconductor Market Breakdown, by Deployment
- 11.1.1.3.4 Canada: Spend Analytics for Electronics and Semiconductor Market Breakdown, by Application
- 11.1.1.4 Mexico: Spend Analytics for Electronics and Semiconductor Market - Revenue and Forecast to 2030 (US$ Million)
- 11.1.1.4.1 Mexico: Spend Analytics for Electronics and Semiconductor Market Breakdown, by Component
- 11.1.1.4.2 Mexico: Spend Analytics for Electronics and Semiconductor Market Breakdown, by Type
- 11.1.1.4.3 Mexico: Spend Analytics for Electronics and Semiconductor Market Breakdown, by Deployment
- 11.1.1.4.4 Mexico: Spend Analytics for Electronics and Semiconductor Market Breakdown, by Application
- 11.1.1 North America: Spend Analytics for Electronics and Semiconductor Market - Revenue and Forecast Analysis - by Country
12. Competitive Landscape
- 12.1 Heat Map Analysis By Key Players
13. Industry Landscape
- 13.1 Overview
- 13.2 Market Initiative
- 13.3 Product Development
- 13.4 Merger and Acquisition
14. Company Profiles
- 14.1 Coupa Software Inc
- 14.1.1 Key Facts
- 14.1.2 Business Description
- 14.1.3 Products and Services
- 14.1.4 Financial Overview
- 14.1.5 SWOT Analysis
- 14.1.6 Key Developments
- 14.2 International Business Machines Corp
- 14.2.1 Key Facts
- 14.2.2 Business Description
- 14.2.3 Products and Services
- 14.2.4 Financial Overview
- 14.2.5 SWOT Analysis
- 14.2.6 Key Developments
- 14.3 Ivalua Inc
- 14.3.1 Key Facts
- 14.3.2 Business Description
- 14.3.3 Products and Services
- 14.3.4 Financial Overview
- 14.3.5 SWOT Analysis
- 14.3.6 Key Developments
- 14.4 Lytica Inc
- 14.4.1 Key Facts
- 14.4.2 Business Description
- 14.4.3 Products and Services
- 14.4.4 Financial Overview
- 14.4.5 SWOT Analysis
- 14.4.6 Key Developments
- 14.5 NB Ventures Inc
- 14.5.1 Key Facts
- 14.5.2 Business Description
- 14.5.3 Products and Services
- 14.5.4 Financial Overview
- 14.5.5 SWOT Analysis
- 14.5.6 Key Developments
- 14.6 SAP SE
- 14.6.1 Key Facts
- 14.6.2 Business Description
- 14.6.3 Products and Services
- 14.6.4 Financial Overview
- 14.6.5 SWOT Analysis
- 14.6.6 Key Developments
- 14.7 Scanmarket AS
- 14.7.1 Key Facts
- 14.7.2 Business Description
- 14.7.3 Products and Services
- 14.7.4 Financial Overview
- 14.7.5 SWOT Analysis
- 14.7.6 Key Developments
- 14.8 Synertrade Inc
- 14.8.1 Key Facts
- 14.8.2 Business Description
- 14.8.3 Products and Services
- 14.8.4 Financial Overview
- 14.8.5 SWOT Analysis
- 14.8.6 Key Developments
- 14.9 Zycus Inc
- 14.9.1 Key Facts
- 14.9.2 Business Description
- 14.9.3 Products and Services
- 14.9.4 Financial Overview
- 14.9.5 SWOT Analysis
- 14.9.6 Key Developments
15. Appendix
- 15.1 Word Index
