|
|
市場調査レポート
商品コード
1510673
アジア太平洋のバニラエキス市場予測(~2030年):地域別分析 - 形態、カテゴリー、用途別Asia Pacific Vanilla Extract Market Forecast to 2030 - Regional Analysis - by Form (Powder and Liquid), Category (Organic and Conventional), and Application (Food & Beverages, Personal Care, and Others) |
||||||
|
|||||||
|
|||||||

| アジア太平洋のバニラエキス市場予測(~2030年):地域別分析 - 形態、カテゴリー、用途別 |
|
出版日: 2024年05月07日
発行: The Insight Partners
ページ情報: 英文 75 Pages
納期: 即納可能
|

全表示
- 概要
- 図表
- 目次
アジア太平洋のバニラエキスの市場規模は、2022年に6,436万米ドル、2030年には1億611万米ドルに達すると予測され、2022年~2030年のCAGRは6.4%を記録すると予測されます。
天然/クリーンラベル原料への需要拡大がアジア太平洋のバニラエキス市場を後押し
世界中の消費者は、より健康的なライフスタイルの採用に傾いています。天然香料は消費者の食生活の要求を満たすことができます。メニューの記載や食品パッケージのラベルは消費者の嗜好に大きな影響を与えます。消費者は、保存料、人工着色料、香料などの合成成分を含まない100%天然製品を好むため、クリーンラベル製品の人気が高まっています。
消費者の需要と国際的な規制により、様々な用途産業が安全で持続可能な製品を製造するために天然源から有効成分を求めるようになっています。そのため、バニラエキスの製造業者は、天然でクリーンラベルの成分に対する需要の増加に対応するため、製品ポートフォリオを拡大しています。
このように、天然成分やクリーンラベル成分への需要の高まりは、予測期間中にアジア太平洋のバニラエキス市場に有利な機会を提供すると期待されています。
アジア太平洋のバニラエキス市場概要
その他のアジア太平洋では、消費者のナチュラル・オーガニック食品への人気の高まりにより、バニラエキス市場で大きな成長が見込まれます。シンガポール、インドネシア、タイ、マレーシアはアロマセラピーで有名な数少ない国の一つです。これらの国々の多くのスパ、美容クリニック、マッサージセンター、アロマセラピーセンターでは、癒し、保湿、鎮静効果のあるバニラエキスを含むエッセンシャルオイルが使用されています。さらに、天然の解毒クリーナーや除菌剤の採用が増加していることから、バニラエキスの需要が加速すると予想されています。
アジア太平洋のバニラエキス市場の収益と2030年までの予測(金額)
アジア太平洋のバニラエキス市場のセグメンテーション
アジア太平洋のバニラエキス市場は、形態、カテゴリー、用途、国によって細分化されます。アジア太平洋のバニラエキス市場は、形態別に、粉末と液体に二分されます。2022年の市場は液体セグメントが大きなシェアを占めました。
カテゴリー別では、アジア太平洋のバニラエキス市場はオーガニックと従来型に二分されます。2022年の市場シェアは従来型が大きなシェアを占めました。
用途別では、アジア太平洋のバニラエキス市場は飲食品、パーソナルケア、その他に分類されます。飲食品セグメントは2022年に最大の市場シェアを占めました。さらに、食品・飲料セグメントは、ベーカリー・菓子類、乳製品・冷菓、飲食品、甘味・風味スナック、その他に分類されます。
国別に見ると、アジア太平洋のバニラエキス市場は中国、日本、インド、オーストラリア、韓国、東南アジア、その他アジア太平洋に区分されます。その他アジア太平洋は、2022年のアジア太平洋のバニラ・エキス市場シェアを独占しました。
Prova SAS、Tharakan and Co、Natural Vanilla Pty Ltd、Kerry Group Plc、Archer-Daniels-Midland Co、Synergy Flavors Incは、アジア太平洋のバニラエキス市場で事業を展開する大手企業の一部です。
目次
目次
第1章 イントロダクション
第2章 エグゼクティブサマリー
- 主要市場洞察
- 市場の魅力
第3章 調査手法
- 調査範囲
- 2次調査
- 1次調査
第4章 アジア太平洋のバニラエキス市場情勢
- ポーターのファイブフォース分析
- 供給企業の交渉力
- 買い手の交渉力
- 新規参入業者の脅威
- 競争企業間の敵対関係
- 代替品の脅威
- エコシステム分析
- 原材料サプライヤー
- 製造プロセス
- 流通業者または供給業者
- 用途
第5章 アジア太平洋のバニラエキス市場:主要産業力学
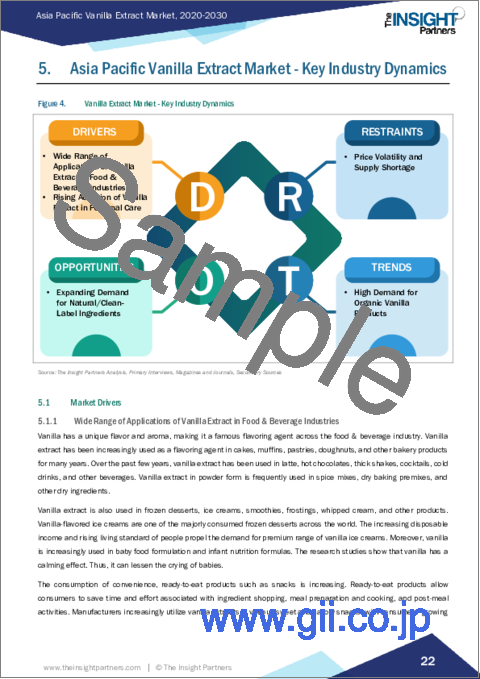
- 市場促進要因
- 飲食品産業におけるバニラエキスの幅広い用途
- パーソナルケアにおけるバニラエキスの採用増加
- 市場抑制要因
- 価格変動と供給不足
- 市場機会
- 天然/クリーンラベル原料の需要拡大
- 今後の動向
- オーガニックバニラ製品に対する高い需要
- 促進要因と抑制要因の影響分析
第6章 バニラエキス市場:アジア太平洋市場分析
- アジア太平洋のバニラエキス市場概要
- アジア太平洋のバニラエキス市場収益:2020年~2030年
- バニラエキス市場の予測・分析
第7章 アジア太平洋のバニラエキス市場分析:形態
- 液体
- 液体市場の収益と2030年までの予測
- 粉末
- 粉末市場の収益と2030年までの予測
第8章 アジア太平洋のバニラエキス市場分析:カテゴリー
- オーガニック
- オーガニック市場の収益と2030年までの予測
- 従来型
- 従来型市場の収益と2030年までの予測
第9章 アジア太平洋のバニラエキス市場分析:用途
- 飲食品
- 飲食品市場の収益と2030年までの予測
- パーソナルケア
- パーソナルケア市場の収益と2030年までの予測
- その他
- その他市場の収益と2030年までの予測
第10章 アジア太平洋のバニラエキス市場:国別分析
- アジア太平洋
- 中国
- インド
- 日本
- オーストラリア
- 韓国
- 東南アジア
- その他アジア太平洋
第11章 企業プロファイル
- Prova SAS
- Tharakan and Co
- Natural Vanilla Pty Ltd
- Kerry Group Plc
- Archer-Daniels-Midland Co
- Synergy Flavors Inc
第12章 付録
List Of Tables
- Table 1. Vanilla Extract Market Segmentation
- Table 2. Vanilla Extract Market Revenue and Forecasts to 2030 (US$ Thousand)
- Table 3. Asia Pacific Vanilla Extract Market Revenue and Forecasts to 2030 (US$ Thousand) - Form
- Table 4. Asia Pacific Vanilla Extract Market Revenue and Forecasts to 2030 (US$ Thousand) - Category
- Table 5. Asia Pacific Vanilla Extract Market Revenue and Forecasts to 2030 (US$ Thousand) - Application
- Table 6. China Vanilla Extract Market Revenue and Forecasts to 2030 (US$ Thousand) - By Form
- Table 7. China Vanilla Extract Market Revenue and Forecasts to 2030 (US$ Thousand) - By Category
- Table 8. China Vanilla Extract Market Revenue and Forecasts to 2030 (US$ Thousand) - By Application
- Table 9. India Vanilla Extract Market Revenue and Forecasts to 2030 (US$ Thousand) - By Form
- Table 10. India Vanilla Extract Market Revenue and Forecasts to 2030 (US$ Thousand) - By Category
- Table 11. India Vanilla Extract Market Revenue and Forecasts to 2030 (US$ Thousand) - By Application
- Table 12. Japan Vanilla Extract Market Revenue and Forecasts to 2030 (US$ Thousand) - By Form
- Table 13. Japan Vanilla Extract Market Revenue and Forecasts to 2030 (US$ Thousand) - By Category
- Table 14. Japan Vanilla Extract Market Revenue and Forecasts to 2030 (US$ Thousand) - By Application
- Table 15. Australia Vanilla Extract Market Revenue and Forecasts to 2030 (US$ Thousand) - By Form
- Table 16. Australia Vanilla Extract Market Revenue and Forecasts to 2030 (US$ Thousand) - By Category
- Table 17. Australia Vanilla Extract Market Revenue and Forecasts to 2030 (US$ Thousand) - By Application
- Table 18. South Korea Vanilla Extract Market Revenue and Forecasts to 2030 (US$ Thousand) - By Form
- Table 19. South Korea Vanilla Extract Market Revenue and Forecasts to 2030 (US$ Thousand) - By Category
- Table 20. South Korea Vanilla Extract Market Revenue and Forecasts to 2030 (US$ Thousand) - By Application
- Table 21. Southeast Asia Vanilla Extract Market Revenue and Forecasts to 2030 (US$ Thousand) - By Form
- Table 22. Southeast Asia Vanilla Extract Market Revenue and Forecasts to 2030 (US$ Thousand) - By Category
- Table 23. Southeast Asia Vanilla Extract Market Revenue and Forecasts to 2030 (US$ Thousand) - By Application
- Table 24. Rest of Asia Pacific Vanilla Extract Market Revenue and Forecasts to 2030 (US$ Thousand) - By Form
- Table 25. Rest of Asia Pacific Vanilla Extract Market Revenue and Forecasts to 2030 (US$ Thousand) - By Category
- Table 26. Rest of Asia Pacific Vanilla Extract Market Revenue and Forecasts to 2030 (US$ Thousand) - By Application
List Of Figures
- Figure 1. Vanilla Extract Market Segmentation, By Country
- Figure 2. Porter's Five Forces Analysis
- Figure 3. Ecosystem: Vanilla Extract Market
- Figure 4. Vanilla Extract Market - Key Industry Dynamics
- Figure 5. Asia Pacific Vanilla Extract Market Impact Analysis of Drivers and Restraints
- Figure 6. Asia Pacific Vanilla Extract Market Revenue (US$ Thousand), 2020 - 2030
- Figure 7. Asia Pacific Vanilla Extract Market Share (%) - Form, 2022 and 2030
- Figure 8. Liquid Market Revenue and Forecasts to 2030 (US$ Thousand)
- Figure 9. Powder Market Revenue and Forecasts to 2030 (US$ Thousand)
- Figure 10. Asia Pacific Vanilla Extract Market Share (%) -Category, 2022 and 2030
- Figure 11. Organic Market Revenue and Forecasts to 2030 (US$ Thousand)
- Figure 12. Conventional Market Revenue and Forecasts to 2030 (US$ Thousand)
- Figure 13. Asia Pacific Vanilla Extract Market Share (%) -Application, 2022 and 2030
- Figure 14. Food & Beverages Market Revenue and Forecasts to 2030 (US$ Thousand)
- Figure 15. Bakery & Confectionery Market Revenue and Forecasts to 2030 (US$ Thousand)
- Figure 16. Dairy & Frozen Desserts Market Revenue and Forecasts to 2030 (US$ Thousand)
- Figure 17. Beverages Market Revenue and Forecasts to 2030 (US$ Thousand)
- Figure 18. Sweet & Savory Snacks Market Revenue and Forecasts to 2030 (US$ Thousand)
- Figure 19. Others Market Revenue and Forecasts to 2030 (US$ Thousand)
- Figure 20. Personal Care Market Revenue and Forecasts to 2030 (US$ Thousand)
- Figure 21. Others Market Revenue and Forecasts to 2030 (US$ Thousand)
- Figure 22. Asia Pacific Vanilla Extract Market, by Key Countries - Revenue (2022) (US$ Thousand)
- Figure 23. Asia Pacific Vanilla Extract Market Breakdown by Key Countries, 2022 and 2030 (%)
- Figure 24. China Vanilla Extract Market Revenue and Forecasts to 2030 (US$ Thousand)
- Figure 25. India Vanilla Extract Market Revenue and Forecasts to 2030 (US$ Thousand)
- Figure 26. Japan Vanilla Extract Market Revenue and Forecasts to 2030 (US$ Thousand)
- Figure 27. Australia Vanilla Extract Market Revenue and Forecasts to 2030 (US$ Thousand)
- Figure 28. South Korea Vanilla Extract Market Revenue and Forecasts to 2030 (US$ Thousand)
- Figure 29. Southeast Asia Vanilla Extract Market Revenue and Forecasts to 2030 (US$ Thousand)
- Figure 30. Rest of Asia Pacific Vanilla Extract Market Revenue and Forecasts to 2030 (US$ Thousand)
The Asia Pacific vanilla extract market was valued at US$ 64.36 million in 2022 and is expected to reach US$ 106.11 million by 2030; it is estimated to record a CAGR of 6.4% from 2022 to 2030.
Expanding Demand for Natural/Clean-Label Ingredients Fuels Asia Pacific Vanilla Extract Market
Consumers across the world are leaning toward the adoption of a healthier lifestyle. Natural flavors can satisfy consumers' dietary requirements. Descriptions on menus and labels on food packaging highly influence consumer preferences. Clean-label products are becoming increasingly popular as consumers prefer 100% natural products with no synthetic ingredients such as preservatives, artificial colors, flavors, and others.
Consumer demand and international regulations have prompted various application industries to seek active ingredients from natural sources to produce safe and sustainable products. Thus, manufacturers of vanilla extracts expand their product portfolio to fulfil the increasing demand for natural and clean-label ingredients.
Thus, the rising demand for natural and clean-label ingredients is expected to provide lucrative opportunities for the Asia Pacific vanilla extract market during the forecast period.
Asia Pacific Vanilla Extract Market Overview
The Rest of Asia Pacific countries are expected to witness significant growth in the vanilla extract market owing to consumers' growing popularity of natural & organic food products. Singapore, Indonesia, Thailand, and Malaysia are among the few countries famous for aromatic therapies. Many spas, beauty clinics, massage centers, and aromatherapy centers in these countries use essential oils containing vanilla extract that have healing, moisturizing, and soothing properties. Further, the increasing adoption of natural detoxifying cleaners and sanitizers is anticipated to accelerate the demand for vanilla extract.
Asia Pacific Vanilla Extract Market Revenue and Forecast to 2030 (US$ Million)
Asia Pacific Vanilla Extract Market Segmentation
The Asia Pacific vanilla extract market is segmented based on form, category, application, and country. Based on form, the Asia Pacific vanilla extract market is bifurcated into powder and liquid. The liquid segment held a larger market share in 2022.
In terms of category, the Asia Pacific vanilla extract market is bifurcated into organic and conventional. The conventional segment held a larger market share in 2022.
By application, the Asia Pacific vanilla extract market is categorized into food & beverages, personal care, and others. The food & beverages segment held the largest market share in 2022. Further, food & beverages segment is categorized into bakery & confectionery, dairy & frozen desserts, beverages, sweet & savory snacks, and others.
Based on country, the Asia Pacific vanilla extract market is segmented into China, Japan, India, Australia, South Korea, Southeast Asia, and the Rest of Asia Pacific. The Rest of Asia Pacific dominated the Asia Pacific vanilla extract market share in 2022.
Prova SAS, Tharakan and Co, Natural Vanilla Pty Ltd, Kerry Group Plc, Archer-Daniels-Midland Co, and Synergy Flavors Inc are some of the leading players operating in the Asia Pacific vanilla extract market.
Table Of Contents
Table of Content
1. Introduction
- 1.1 The Insight Partners Research Report Guidance
- 1.2 Market Segmentation
2. Executive Summary
- 2.1 Key Market Insights
- 2.2 Market Attractiveness
3. Research Methodology
- 3.1 Coverage
- 3.2 Secondary Research
- 3.3 Primary Research
4. Asia Pacific Vanilla Extract Market Landscape
- 4.1 Overview
- 4.2 Porter's Five Forces Analysis
- 4.2.1 Bargaining Power of Suppliers
- 4.2.2 Bargaining Power of Buyers
- 4.2.3 Threat of New Entrants
- 4.2.4 Competitive Rivalry
- 4.2.5 Threat of Substitutes
- 4.3 Ecosystem Analysis
- 4.3.1 Raw Material Suppliers
- 4.3.2 Manufacturing Process
- 4.3.3 Distributors or Suppliers
- 4.3.4 Application
5. Asia Pacific Vanilla Extract Market - Key Industry Dynamics
- 5.1 Market Drivers
- 5.1.1 Wide Range of Applications of Vanilla Extract in Food & Beverage Industries
- 5.1.2 Rising Adoption of Vanilla Extract in Personal Care
- 5.2 Market Restraints
- 5.2.1 Price Volatility and Supply Shortage
- 5.3 Market Opportunities
- 5.3.1 Expanding Demand for Natural/Clean-Label Ingredients
- 5.4 Future Trends
- 5.4.1 High Demand for Organic Vanilla Products
- 5.5 Impact Analysis of Drivers and Restraints
6. Vanilla Extract Market - Asia Pacific Market Analysis
- 6.1 Asia Pacific Vanilla Extract Market Overview
- 6.2 Asia Pacific Vanilla Extract Market Revenue (US$ Thousand), 2020 - 2030
- 6.3 Vanilla Extract Market Forecast and Analysis
7. Asia Pacific Vanilla Extract Market Analysis - Form
- 7.1 Liquid
- 7.1.1 Overview
- 7.1.2 Liquid Market Revenue and Forecast to 2030 (US$ Thousand)
- 7.2 Powder
- 7.2.1 Overview
- 7.2.2 Powder Market Revenue and Forecast to 2030 (US$ Thousand)
8. Asia Pacific Vanilla Extract Market Analysis - Category
- 8.1 Organic
- 8.1.1 Overview
- 8.1.2 Organic Market Revenue and Forecast to 2030 (US$ Thousand)
- 8.2 Conventional
- 8.2.1 Overview
- 8.2.2 Conventional Market Revenue and Forecast to 2030 (US$ Thousand)
9. Asia Pacific Vanilla Extract Market Analysis - Application
- 9.1 Food & Beverages
- 9.1.1 Overview
- 9.1.2 Food & Beverages Market Revenue and Forecast to 2030 (US$ Thousand)
- 9.1.2.1 Bakery & Confectionery
- 9.1.2.1.1 Overview
- 9.1.2.1.2 Bakery & Confectionery Market Revenue and Forecast to 2030 (US$ Thousand)
- 9.1.2.2 Dairy & Frozen Desserts
- 9.1.2.2.1 Overview
- 9.1.2.2.2 Dairy & Frozen Desserts Market Revenue and Forecast to 2030 (US$ Thousand)
- 9.1.2.3 Beverages
- 9.1.2.3.1 Overview
- 9.1.2.3.2 Beverages Market Revenue and Forecast to 2030 (US$ Thousand)
- 9.1.2.4 Sweet & Savory Snacks
- 9.1.2.4.1 Overview
- 9.1.2.4.2 Sweet & Savory Snacks Market Revenue and Forecast to 2030 (US$ Thousand)
- 9.1.2.5 Others
- 9.1.2.5.1 Overview
- 9.1.2.5.2 Others Market Revenue and Forecast to 2030 (US$ Thousand)
- 9.1.2.1 Bakery & Confectionery
- 9.2 Personal Care
- 9.2.1 Overview
- 9.2.2 Personal Care Market Revenue and Forecast to 2030 (US$ Thousand)
- 9.3 Others
- 9.3.1 Overview
- 9.3.2 Others Market Revenue and Forecast to 2030 (US$ Thousand)
10. Asia Pacific Vanilla Extract Market - Country Analysis
- 10.1 Asia Pacific
- 10.1.1 Asia Pacific Vanilla Extract Market Revenue and Forecasts and Analysis - By Countries
- 10.1.1.1 Asia Pacific Vanilla Extract Market Breakdown by Country
- 10.1.1.2 China Vanilla Extract Market Revenue and Forecasts to 2030 (US$ Thousand)
- 10.1.1.2.1 China Vanilla Extract Market Breakdown by Form
- 10.1.1.2.2 China Vanilla Extract Market Breakdown by Category
- 10.1.1.2.3 China Vanilla Extract Market Breakdown by Application
- 10.1.1.3 India Vanilla Extract Market Revenue and Forecasts to 2030 (US$ Thousand)
- 10.1.1.3.1 India Vanilla Extract Market Breakdown by Form
- 10.1.1.3.2 India Vanilla Extract Market Breakdown by Category
- 10.1.1.3.3 India Vanilla Extract Market Breakdown by Application
- 10.1.1.4 Japan Vanilla Extract Market Revenue and Forecasts to 2030 (US$ Thousand)
- 10.1.1.4.1 Japan Vanilla Extract Market Breakdown by Form
- 10.1.1.4.2 Japan Vanilla Extract Market Breakdown by Category
- 10.1.1.4.3 Japan Vanilla Extract Market Breakdown by Application
- 10.1.1.5 Australia Vanilla Extract Market Revenue and Forecasts to 2030 (US$ Thousand)
- 10.1.1.5.1 Australia Vanilla Extract Market Breakdown by Form
- 10.1.1.5.2 Australia Vanilla Extract Market Breakdown by Category
- 10.1.1.5.3 Australia Vanilla Extract Market Breakdown by Application
- 10.1.1.6 South Korea Vanilla Extract Market Revenue and Forecasts to 2030 (US$ Thousand)
- 10.1.1.6.1 South Korea Vanilla Extract Market Breakdown by Form
- 10.1.1.6.2 South Korea Vanilla Extract Market Breakdown by Category
- 10.1.1.6.3 South Korea Vanilla Extract Market Breakdown by Application
- 10.1.1.7 Southeast Asia Vanilla Extract Market Revenue and Forecasts to 2030 (US$ Thousand)
- 10.1.1.7.1 Southeast Asia Vanilla Extract Market Breakdown by Form
- 10.1.1.7.2 Southeast Asia Vanilla Extract Market Breakdown by Category
- 10.1.1.7.3 Southeast Asia Vanilla Extract Market Breakdown by Application
- 10.1.1.8 Rest of Asia Pacific Vanilla Extract Market Revenue and Forecasts to 2030 (US$ Thousand)
- 10.1.1.8.1 Rest of Asia Pacific Vanilla Extract Market Breakdown by Form
- 10.1.1.8.2 Rest of Asia Pacific Vanilla Extract Market Breakdown by Category
- 10.1.1.8.3 Rest of Asia Pacific Vanilla Extract Market Breakdown by Application
- 10.1.1 Asia Pacific Vanilla Extract Market Revenue and Forecasts and Analysis - By Countries
11. Company Profiles
- 11.1 Prova SAS
- 11.1.1 Key Facts
- 11.1.2 Business Description
- 11.1.3 Products and Services
- 11.1.4 Financial Overview
- 11.1.5 SWOT Analysis
- 11.1.6 Key Developments
- 11.2 Tharakan and Co
- 11.2.1 Key Facts
- 11.2.2 Business Description
- 11.2.3 Products and Services
- 11.2.4 Financial Overview
- 11.2.5 SWOT Analysis
- 11.2.6 Key Developments
- 11.3 Natural Vanilla Pty Ltd
- 11.3.1 Key Facts
- 11.3.2 Business Description
- 11.3.3 Products and Services
- 11.3.4 Financial Overview
- 11.3.5 SWOT Analysis
- 11.3.6 Key Developments
- 11.4 Kerry Group Plc
- 11.4.1 Key Facts
- 11.4.2 Business Description
- 11.4.3 Products and Services
- 11.4.4 Financial Overview
- 11.4.5 SWOT Analysis
- 11.4.6 Key Developments
- 11.5 Archer-Daniels-Midland Co
- 11.5.1 Key Facts
- 11.5.2 Business Description
- 11.5.3 Products and Services
- 11.5.4 Financial Overview
- 11.5.5 SWOT Analysis
- 11.5.6 Key Developments
- 11.6 Synergy Flavors Inc
- 11.6.1 Key Facts
- 11.6.2 Business Description
- 11.6.3 Products and Services
- 11.6.4 Financial Overview
- 11.6.5 SWOT Analysis
- 11.6.6 Key Developments
