|
|
市場調査レポート
商品コード
1126252
天然食品着色料の2028年までの市場予測-タイプ、形状、用途別の世界的分析Natural Food Colors Market Forecast to 2028 - COVID-19 Impact and Global Analysis By Type, Form, and Application |
||||||
|
|
|||||||


| 天然食品着色料の2028年までの市場予測-タイプ、形状、用途別の世界的分析 |
|
出版日: 2022年08月24日
発行: The Insight Partners
ページ情報: 英文 140 Pages
納期: 即納可能
|
- 全表示
- 概要
- 図表
- 目次
天然食品着色料市場は、2022年の21億米ドルから2028年には31億7000万米ドルに達すると予測されています。また、2022年から2028年の間にCAGR7.1%で成長すると予測されています。
天然食品着色料市場は、人々の可処分所得の上昇とともに、消費者の間で合成着色料の有害性についての認識が高まっていることが要因となっています。さらに、急速な都市化、現代的なライフスタイル、消費者支出の増加により、食生活全般が変化しています。多くの都市部では、パッケージ化された食品の傾向が強まっており、天然食品着色料の市場成長に寄与しています。天然食品着色料は、消費者にとってより安全であり、食品に栄養価を付加します。また、天然食品着色料は、多くの疾患のリスクを軽減するのに役立つ抗酸化物質を持っています。天然食品着色料市場の主な要因の一つは、クリーンラベル製品に向かって増加する消費者の性向です。
人々は、合成食品の色の欠点を避けるために、天然食品の色を好みます。合成食品着色料は、食品中の栄養素を破壊する化学組成を持っています。また、肌荒れや湿疹、腸の不調、呼吸困難などを引き起こす可能性があります。天然食品着色料は、使いやすく、安定性に優れ、食品の外観を美しくします。さらに、天然食品着色料には抗酸化物質が含まれていることが、その高い需要の理由となっています。さらに、メーカーは、食品にさまざまな色を与え、より安全に摂取できる新製品を発売しています。人口の増加と健康意識の高まりにより、健康食品の需要は驚異的な速度で急増しました。健康志向の高いミレニアル世代の増加により、有機・天然食品添加物の需要に拍車がかかると予想されます。可処分所得の増加とライフスタイルの向上は、世界の天然食品着色料市場を牽引する重要な要因です。さらに、複数の小売チャネルでさまざまな製品を手頃な価格で入手できることが、天然食品着色料の需要を促進しています。
天然食品着色料の世界市場は、タイプ別に、カルミン、アントシアニン、カラメル、クルクミン、アナトー、カロテノイド、クロロフィル、その他に区分されます。2021年には、カロテノイドセグメントが最大の収益シェアを占め、アントシアニンセグメントは予測期間中に最も高い成長率を占めると予想されます。形態面では、世界の天然食品着色料市場は、液体&ゲルと粉末に区分されます。2021年には、液体&ジェルセグメントが最大の収益シェアを占めました。用途別では、天然食品着色料の世界市場は、ベーカリー・菓子類、乳製品・冷菓、飲料、ソース;ドレッシング;および調味料、RTC・RTE製品、肉;鶏肉;および海産物、およびその他に区分されます。2021年には、飲料分野が最大の収益シェアを占めました。
地域別では、天然食品着色料市場は、北米、欧州、アジア太平洋(APAC)、中東・アフリカ(MEA)、中南米に区分されます。2021年では、欧州が最大のシェアを占めています。しかし、アジア太平洋地域は予測期間中に最も高いCAGRを記録すると推定されます。
アジア太平洋地域の天然食品着色料市場は、最も急速に成長している地域です。この地域は、オーストラリア、中国、インド、日本、韓国、その他のアジア太平洋地域に区分されます。この地域の市場は、合成着色料の有害性に関する消費者の意識の高まりにより、大きく成長しています。また、アジア太平洋地域の菓子類ブランドは、自社の製品ポートフォリオからすべての人工着色料を段階的に排除する努力を続けており、今後も天然食品着色料市場の成長に有利に働くと思われます。さらに、天然成分やクリーンラベルの食品に対する需要は、ほぼすべての地域で増加しています。クリーンラベル製品とは、有機、天然、非遺伝子組み換え、最小限の加工を施した消費者に優しい製品のことです。消費者の健康意識の高まりが、天然素材やクリーンラベル製品に対する需要を後押ししており、それが天然食品着色料市場の成長を後押しすることになります。消費者は、合成成分とその悪影響に対する認識が高まっているため、クリーンラベル製品に傾倒しつつあります。このため、消費者はクリーンラベルの成分を使用した製品や食生活を採用するようになります。クリーンラベル製品への需要の高まりは、最終的に天然食品着色料市場の成長につながるでしょう。
Koninklijke DSM N.V.、Sensient Technologies、Archer Daniels Midland Company、Dohler Group、BASF SE、Naturex S.A、Aromata Group、Givaudan、Dupont、Oterra A/S、Mane KANCORなどが、天然食品着色料の市場で事業を展開している主要企業として名を連ねています。これらの企業は、市場向けに幅広い製品ポートフォリオを提供しています。新興国市場の企業は、有利な市場成長の機会を提供しています。市場開拓者は、顧客の要求を満たすために、高品質で革新的な製品を開発しています。
世界の天然食品着色料市場の全体規模は、一次情報および二次情報の両方を使用して導き出されています。調査プロセスを開始するにあたり、市場に関連する質的・量的情報を入手するため、内外の情報源を用いて徹底的な二次調査を実施しました。また、データを検証し、テーマに関する分析的洞察を得るために、業界関係者に複数の一次インタビューを実施しました。このプロセスの参加者には、副社長、事業開発マネージャー、市場情報マネージャー、国内販売マネージャーなどの業界専門家、および天然食品着色料市場を専門とする評価専門家、研究アナリスト、キーオピニオンリーダーなどの外部コンサルタントが含まれています。
目次
第1章 イントロダクション
- 調査範囲
- インサイトパートナーズの調査報告書ガイダンス
- 市場セグメンテーション
第2章 重要なポイント
第3章 調査手法
- 調査範囲
- 調査手法
- データ収集
- 一次インタビュー
- 仮説の策定
- マクロ経済要因分析
- ベースナンバーの作成
- データの三角測量
- 国別データ
第4章 天然食品着色料の世界市場情勢
- 市場の概要
- ポーターのファイブフォース分析
- 新規参入業者の脅威
- 供給企業の交渉力
- 買い手の交渉力
- 競争企業間の競合関係
- 代替品の脅威
- エコシステム分析
- エコシステム天然食品着色料の世界市場
第5章 天然食品着色料市場-主要な市場力学
- 市場促進要因
- 合成成分に対する消費者の懸念の高まり
- クリーンラベル製品に対する消費者の傾向の高まり
- 市場抑制要因
- 天然成分のコスト高
- 市場機会
- 最終用途の増加
- 今後の動向
- 様々な天然食品着色料の入手可能性
- 推進要因と抑制要因の影響分析
第6章 世界市場-世界分析
- 世界市場の概要
- 市場のポジショニング-世界市場プレイヤー
第7章 天然食品着色料の市場分析-タイプ別
- 天然食品着色料のタイプ別市場(2021年、2028年)
- カーミン
- アントシアニン
- カラメル
- クルクミン
- アナトー
- カロテノイド
- クロロフィル
- その他
第8章 天然食品着色料の市場分析- フォーム別
- 天然食品着色料の形態別市場(2021年、2028年)
- 液体・ゲル
- 粉体
第9章 天然食品着色料の市場分析-用途別
- 天然食品着色料市場:用途別(2021年、2028年)
- ベーカリー、菓子類
- 乳製品と冷凍デザート
- 飲料
- ソース、ドレッシング、調味料
- RTC、RTE製品
- 肉・鶏肉・魚介類
- その他
第10章 天然食品着色料市場-地域別分析
- 北米の天然食品着色料市場
- 北米の天然食品着色料の市場:タイプ別
- 北米の天然食品着色料の市場:形態別
- 北米の天然食品着色料の市場:用途別
- 北米の天然食品着色料の市場:主要国別
- 欧州の天然食品着色料の市場
- 欧州の天然食品着色料の市場:タイプ別
- 欧州の天然食品着色料の市場、形状別
- 欧州の天然食品着色料の用途別市場
- 欧州の天然食品着色料の市場:主要国別
- アジア太平洋地域天然食品着色料の市場
- アジア太平洋地域の天然食品着色料の市場:タイプ別
- アジア太平洋地域の天然食品着色料の市場:形態別
- アジア太平洋地域の天然食品着色料の市場:用途別
- アジア太平洋地域の天然食品着色料の市場:主要国別
- 中東・アフリカ地域天然食品着色料の市場
- 中東・アフリカの天然食品着色料の市場:タイプ別
- 中東・アフリカの天然食品着色料の市場:形態別
- 中東・アフリカの天然食品着色料の市場:用途別
- 東アジア・アフリカ天然食品着色料の市場:主要国別
- 中南米の事例天然食品着色料の市場
- 中南米の様子天然食品着色料の市場:タイプ別
- 中南米の天然食品着色料の市場規模(形態別
- 中南米の天然食品着色料市場:形態別天然食品着色料の市場:用途別
- 中南米の中南米:天然食品着色料の市場:主要国別
第11章 COVID-19の影響
- 概要-COVID-19の影響
- 北米
- 欧州
- アジア太平洋地域
- 中東・アフリカ
- 南米
第12章 企業プロファイル
- Koninklijke DSM N.V.
- Sensient Technologies Corporation
- Archer Daniels Midland Company
- Dohler Group
- BASF SE
- Naturex S.A.
- Aromata Group
- Givaudan S.A.
- DuPont
- Oterra A/S
- Mane Kancor Ingredients Pvt. Ltd.
第13章 付録
- The Insight Partners について
- 用語解説
List Of Tables
- Table 1. Global Natural Food Colors Market -Revenue and Forecast To 2028 (US$ Million)
- Table 2. North America Natural Food Colors Market, By Type - Revenue and Forecast to 2028 (US$ Million)
- Table 3. North America Natural Food Colors Market, by Form - Revenue and Forecast to 2028 (US$ Million)
- Table 4. North America Natural Food Colors Market, by Application - Revenue and Forecast to 2028 (US$ Million)
- Table 5. US Natural Food Colors Market, Type - Revenue and Forecast to 2028 (US$ Million)
- Table 6. US Natural Food Colors Market, by Form - Revenue and Forecast to 2028 (US$ Million)
- Table 7. US Natural Food Colors Market, by Application - Revenue and Forecast to 2028 (US$ Million)
- Table 8. Mexico Natural Food Colors Market, By Type - Revenue and Forecast to 2028 (US$ Million)
- Table 9. Mexico Natural Food Colors Market, by Form - Revenue and Forecast to 2028 (US$ Million)
- Table 10. Mexico Natural Food Colors Market, by Application - Revenue and Forecast to 2028 (US$ Million)
- Table 11. Canada Natural Food Colors Market, By Type - Revenue and Forecast to 2028 (US$ Million)
- Table 12. Canada Natural Food Colors Market, by Form - Revenue and Forecast to 2028 (US$ Million)
- Table 13. Canada Natural Food Colors Market, by Application - Revenue and Forecast to 2028 (US$ Million)
- Table 14. Europe: Natural Food Colors Market, By Type - Revenue and Forecast to 2028 (US$ Million)
- Table 15. Europe Natural Food Colors Market, by Form - Revenue and Forecast to 2028 (US$ Million)
- Table 16. Europe Natural Food Colors Market, by Application - Revenue and Forecast to 2028 (US$ Million)
- Table 17. Germany Natural Food Colors Market, By Type - Revenue and Forecast to 2028 (US$ Million)
- Table 18. Germany Natural Food Colors Market, by Form - Revenue and Forecast to 2028 (US$ Million)
- Table 19. Germany Natural Food Colors Market, by Application - Revenue and Forecast to 2028 (US$ Million)
- Table 20. France Natural Food Colors Market, By Type - Revenue and Forecast to 2028 (US$ Million)
- Table 21. France Natural Food Colors Market, by Form - Revenue and Forecast to 2028 (US$ Million)
- Table 22. France Natural Food Colors Market, by Application - Revenue and Forecast to 2028 (US$ Million)
- Table 23. Italy Natural Food Colors Market, By Type - Revenue and Forecast to 2028 (US$ Million)
- Table 24. Italy Natural Food Colors Market, by Form - Revenue and Forecast to 2028 (US$ Million)
- Table 25. Italy Natural Food Colors Market, by Application - Revenue and Forecast to 2028 (US$ Million)
- Table 26. UK Natural Food Colors Market, By Type - Revenue and Forecast to 2028 (US$ Million)
- Table 27. UK Natural Food Colors Market, by Form - Revenue and Forecast to 2028 (US$ Million)
- Table 28. UK Natural Food Colors Market, by Application - Revenue and Forecast to 2028 (US$ Million)
- Table 29. Russia Natural Food Colors Market, By Type - Revenue and Forecast to 2028 (US$ Million)
- Table 30. Russia Natural Food Colors Market, by Form - Revenue and Forecast to 2028 (US$ Million)
- Table 31. Russia Natural Food Colors Market, by Application - Revenue and Forecast to 2028 (US$ Million)
- Table 32. Rest of Europe Natural Food Colors Market, By Type - Revenue and Forecast to 2028 (US$ Million)
- Table 33. Rest of Europe Natural Food Colors Market, by Form - Revenue and Forecast to 2028 (US$ Million)
- Table 34. Rest of Europe Natural Food Colors Market, by Application - Revenue and Forecast to 2028 (US$ Million)
- Table 35. Asia Pacific Natural Food Colors Market, By Type - Revenue and Forecast to 2028 (US$ Million)
- Table 36. Asia Pacific Natural Food Colors Market, by Form - Revenue and Forecast to 2028 (US$ Million)
- Table 37. Asia Pacific Natural Food Colors Market, by Application - Revenue and Forecast to 2028 (US$ Million)
- Table 38. Australia Natural Food Colors Market, By Type - Revenue and Forecast to 2028 (US$ Million)
- Table 39. Australia Natural Food Colors Market, by Form - Revenue and Forecast to 2028 (US$ Million)
- Table 40. Australia Natural Food Colors Market, by Application - Revenue and Forecast to 2028 (US$ Million)
- Table 41. China Natural Food Colors Market, By Type - Revenue and Forecast to 2028 (US$ Million)
- Table 42. China Natural Food Colors Market, by Form - Revenue and Forecast to 2028 (US$ Million)
- Table 43. China Natural Food Colors Market, by Application - Revenue and Forecast to 2028 (US$ Million)
- Table 44. India Natural Food Colors Market, By Type - Revenue and Forecast to 2028 (US$ Million)
- Table 45. India Natural Food Colors Market, by Form - Revenue and Forecast to 2028 (US$ Million)
- Table 46. India Natural Food Colors Market, by Application - Revenue and Forecast to 2028 (US$ Million)
- Table 47. Japan Natural Food Colors Market, By Type- Revenue and Forecast to 2028 (US$ Million)
- Table 48. Japan Natural Food Colors Market, by Form - Revenue and Forecast to 2028 (US$ Million)
- Table 49. Japan Natural Food Colors Market, by Application - Revenue and Forecast to 2028 (US$ Million)
- Table 50. South Korea Natural Food Colors Market, By Type - Revenue and Forecast to 2028 (US$ Million)
- Table 51. South Korea Natural Food Colors Market, by Form - Revenue and Forecast to 2028 (US$ Million)
- Table 52. South Korea Natural Food Colors Market, by Application - Revenue and Forecast to 2028 (US$ Million)
- Table 53. Rest of Asia Pacific Natural Food Colors Market, By Type - Revenue and Forecast to 2028 (US$ Million)
- Table 54. Rest of Asia Pacific Natural Food Colors Market, by Form - Revenue and Forecast to 2028 (US$ Million)
- Table 55. Rest of Asia Pacific Natural Food Colors Market, by Application - Revenue and Forecast to 2028 (US$ Million)
- Table 56. Middle East & Africa Natural Food Colors Market, By Type- Revenue and Forecast to 2028 (US$ Million)
- Table 57. Middle East & Africa Natural Food Colors Market, by Form - Revenue and Forecast to 2028 (US$ Million)
- Table 58. Middle East & Africa Natural Food Colors Market, by Application - Revenue and Forecast to 2028 (US$ Million)
- Table 59. South Africa Natural Food Colors Market, By Type - Revenue and Forecast to 2028 (US$ Million)
- Table 60. South Africa Natural Food Colors Market, by Form - Revenue and Forecast to 2028 (US$ Million)
- Table 61. South Africa Natural Food Colors Market, by Application - Revenue and Forecast to 2028 (US$ Million)
- Table 62. Saudi Arabia Natural Food Colors Market, By Type - Revenue and Forecast to 2028 (US$ Million)
- Table 63. Saudi Arabia Natural Food Colors Market, by Form - Revenue and Forecast to 2028 (US$ Million)
- Table 64. Saudi Arabia Natural Food Colors Market, by Application - Revenue and Forecast to 2028 (US$ Million)
- Table 65. UAE Natural Food Colors Market, By Type - Revenue and Forecast to 2028 (US$ Million)
- Table 66. UAE Natural Food Colors Market, by Form - Revenue and Forecast to 2028 (US$ Million)
- Table 67. UAE Natural Food Colors Market, by Application - Revenue and Forecast to 2028 (US$ Million)
- Table 68. Rest of MEA Natural Food Colors Market, By Type - Revenue and Forecast to 2028 (US$ Million)
- Table 69. Rest of MEA Natural Food Colors Market, by Form - Revenue and Forecast to 2028 (US$ Million)
- Table 70. Rest of MEA Natural Food Colors Market, by Application - Revenue and Forecast to 2028 (US$ Million)
- Table 71. South & Central America Natural Food Colors Market, By Type - Revenue and Forecast to 2028 (US$ Million)
- Table 72. South & Central America Natural Food Colors Market, by Form - Revenue and Forecast to 2028 (US$ Million)
- Table 73. South & Central America Natural Food Colors Market, by Application - Revenue and Forecast to 2028 (US$ Million)
- Table 74. Brazil Natural Food Colors Market, By Type - Revenue and Forecast to 2028 (US$ Million)
- Table 75. Brazil Natural Food Colors Market, by Form - Revenue and Forecast to 2028 (US$ Million)
- Table 76. Brazil Natural Food Colors Market, by Application - Revenue and Forecast to 2028 (US$ Million)
- Table 77. Argentina Natural Food Colors Market, By Type - Revenue and Forecast to 2028 (US$ Million)
- Table 78. Argentina Natural Food Colors Market, by Form - Revenue and Forecast to 2028 (US$ Million)
- Table 79. Argentina Natural Food Colors Market, by Application - Revenue and Forecast to 2028 (US$ Million)
- Table 80. Rest of South & Central America Natural Food Colors Market, By Type - Revenue and Forecast to 2028 (US$ Million)
- Table 81. Rest of South & Central America Natural Food Colors Market, by Form - Revenue and Forecast to 2028 (US$ Million)
- Table 82. Rest of South & Central America Natural Food Colors Market, by Application - Revenue and Forecast to 2028 (US$ Million)
- Table 83. Glossary of Terms, Natural Food Colors Market
List Of Figures
- Figure 1. Global Natural Food Colors Market Segmentation
- Figure 2. Global Natural Food Colors Market Segmentation - By Geography
- Figure 3. Global Natural Food Colors Market Overview
- Figure 4. Carotenoids Segment Held Largest Share of Global Natural Food Colors Market
- Figure 5. Europe Region Held Largest Share of Global Natural Food Colors Market
- Figure 6. Global Natural Food Colors Market, Industry Landscape
- Figure 7. Porter's Five Forces Analysis
- Figure 8. Global Natural Food Colors Market Impact Analysis of Drivers and Restraints
- Figure 9. Geographic Overview of Natural Food Colors Market
- Figure 10. Global: Natural Food Colors Market - Revenue and Forecast To 2028 (US$ Million)
- Figure 11. Natural Food Colors Market Revenue Share, by Type (2021 and 2028)
- Figure 12. Carmine: Natural Food Colors Market - Revenue and Forecast to 2028 (US$ Million)
- Figure 13. Anthocyanins: Natural Food Colors Market - Revenue and Forecast to 2028 (US$ Million)
- Figure 14. Frozen Mollusks: Natural Food Colors Market - Revenue and Forecast to 2028 (US$ Million)
- Figure 15. Curcumin: Natural Food Colors Market - Revenue and Forecast to 2028 (US$ Million)
- Figure 16. Annatto: Natural Food Colors Market - Revenue and Forecast to 2028 (US$ Million)
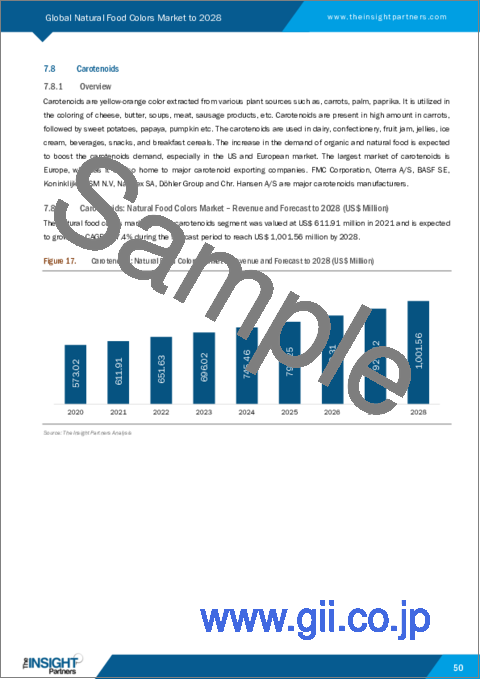
- Figure 17. Carotenoids: Natural Food Colors Market - Revenue and Forecast to 2028 (US$ Million)
- Figure 18. Chlorophyll: Natural Food Colors Market - Revenue and Forecast to 2028 (US$ Million)
- Figure 19. Others: Natural Food Colors Market - Revenue and Forecast to 2028 (US$ Million)
- Figure 20. Natural Food Colors Market Revenue Share by Form (2021 and 2028)
- Figure 21. Liquid & Gel: Natural Food Colors Market - Revenue and Forecast to 2028 (US$ Million)
- Figure 22. Powder: Natural Food Colors Market - Revenue and Forecast to 2028 (US$ Million)
- Figure 23. Natural Food Colors Market Revenue Share, by Type (2021 and 2028)
- Figure 24. Bakery and Confectionery: Natural Food Colors Market - Revenue and Forecast to 2028 (US$ Million)
- Figure 25. Dairy and Frozen Desserts: Natural Food Colors Market - Revenue and Forecast to 2028 (US$ Million)
- Figure 26. Beverages: Natural Food Colors Market - Revenue and Forecast to 2028 (US$ Million)
- Figure 27. Sauces, Dressings and Condiments: Natural Food Colors Market - Revenue and Forecast to 2028 (US$ Million)
- Figure 28. RTC and RTE Products: Natural Food Colors Market - Revenue and Forecast to 2028 (US$ Million)
- Figure 29. Meat, Poultry and Seafood: Natural Food Colors Market - Revenue and Forecast to 2028 (US$ Million)
- Figure 30. Others: Natural Food Colors Market - Revenue and Forecast to 2028 (US$ Million)
- Figure 31. Global Natural Food Colors Market Revenue Share, By Region (2021 and 2028)
- Figure 32. North America: Natural Food Colors Market- Revenue and Forecast to 2028 (US$ Million)
- Figure 33. North America: Natural Food Colors Market Revenue Share, By Type (2021 and 2028)
- Figure 34. North America: Natural Food Colors Market Revenue Share, by Form (2021 and 2028)
- Figure 35. North America: Natural Food Colors Market Revenue Share, by Application (2021 and 2028)
- Figure 36. North America: Natural Food Colors Market Revenue Share, by Key Country (2021 and 2028)
- Figure 37. US: Natural Food Colors Market- Revenue and Forecast to 2028 (US$ Million)
- Figure 38. Mexico: Natural Food Colors Market- Revenue and Forecast to 2028 (US$ Million)
- Figure 39. Canada: Natural Food Colors Market- Revenue and Forecast to 2028 (US$ Million)
- Figure 40. Europe: Natural Food Colors Market- Revenue and Forecast to 2028 (US$ Million)
- Figure 41. Europe: Natural Food Colors Market Revenue Share, By Type (2021 and 2028)
- Figure 42. Europe: Natural Food Colors Market Revenue Share, by Form (2021 and 2028)
- Figure 43. Europe: Natural Food Colors Market Revenue Share, by Application (2021 and 2028)
- Figure 44. Europe: Natural Food Colors Market Revenue Share, by Key Country (2021 and 2028)
- Figure 45. Germany: Natural Food Colors Market- Revenue and Forecast to 2028 (US$ Million)
- Figure 46. France: Natural Food Colors Market- Revenue and Forecast to 2028 (US$ Million)
- Figure 47. Italy: Natural Food Colors Market- Revenue and Forecast to 2028 (US$ Million)
- Figure 48. UK: Natural Food Colors Market- Revenue and Forecast to 2028 (US$ Million)
- Figure 49. Russia: Natural Food Colors Market- Revenue and Forecast to 2028 (US$ Million)
- Figure 50. Rest of Europe: Natural Food Colors Market- Revenue and Forecast to 2028 (US$ Million)
- Figure 51. Asia Pacific: Natural Food Colors Market- Revenue and Forecast to 2028 (US$ Million)
- Figure 52. Asia Pacific: Natural Food Colors Market Revenue Share, By Type (2021 and 2028)
- Figure 53. Asia Pacific: Natural Food Colors Market Revenue Share, by Form (2021 and 2028)
- Figure 54. Asia Pacific: Natural Food Colors Market Revenue Share, by Application (2021 and 2028)
- Figure 55. Asia Pacific: Natural Food Colors Market Revenue Share, by Key Country (2021 and 2028)
- Figure 56. Australia: Natural Food Colors Market-Revenue and Forecast to 2028 (US$ Million)
- Figure 57. China: Natural Food Colors Market-Revenue and Forecast to 2028 (US$ Million)
- Figure 58. India: Natural Food Colors Market-Revenue and Forecast to 2028 (US$ Million)
- Figure 59. Japan: Natural Food Colors Market-Revenue and Forecast to 2028 (US$ Million)
- Figure 60. South Korea: Natural Food Colors Market-Revenue and Forecast to 2028 (US$ Million)
- Figure 61. Rest of Asia Pacific: Natural Food Colors Market-Revenue and Forecast to 2028 (US$ Million)
- Figure 62. Middle East & Africa: Natural Food Colors Market- Revenue and Forecast to 2028 (US$ Million)
- Figure 63. Middle East & Africa: Natural Food Colors Market Revenue Share, By Type (2021 and 2028)
- Figure 64. Middle East & Africa: Natural Food Colors Market Revenue Share, by Form (2021 and 2028)
- Figure 65. Middle East & Africa: Natural Food Colors Market Revenue Share, by Application (2021 and 2028)
- Figure 66. Middle East & Africa: Natural Food Colors Market Revenue Share, by Key Country (2021 and 2028)
- Figure 67. South Africa: Natural Food Colors Market-Revenue and Forecast to 2028 (US$ Million)
- Figure 68. Saudi Arabia: Natural Food Colors Market-Revenue and Forecast to 2028 (US$ Million)
- Figure 69. UAE: Natural Food Colors Market-Revenue and Forecast to 2028 (US$ Million)
- Figure 70. Rest of MEA: Natural Food Colors Market-Revenue and Forecast to 2028 (US$ Million)
- Figure 71. South & Central America: Natural Food Colors Market- Revenue and Forecast to 2028 (US$ Million)
- Figure 72. South & Central America: Natural Food Colors Market Revenue Share, By Type (2021 and 2028)
- Figure 73. South & Central America: Natural Food Colors Market Revenue Share, by Form (2021 and 2028)
- Figure 74. South & Central America: Natural Food Colors Market Revenue Share, by Application (2021 and 2028)
- Figure 75. South & Central America: Natural Food Colors Market Revenue Share, by Key Country (2021 and 2028)
- Figure 76. Brazil: Natural Food Colors Market- Revenue and Forecast to 2028 (US$ Million)
- Figure 77. Argentina: Natural Food Colors Market- Revenue and Forecast to 2028 (US$ Million)
- Figure 78. Rest of South & Central America: Natural Food Colors Market- Revenue and Forecast to 2028 (US$ Million)
- Figure 79. Impact of COVID-19 Pandemic on Natural Food Colors Market in North America
- Figure 80. Impact of COVID-19 Pandemic on Natural Food Colors Market in Europe
- Figure 81. Impact of COVID-19 Pandemic on Natural Food Colors Market in Asia Pacific
- Figure 82. Impact of COVID-19 Pandemic on Natural Food Colors in Middle East and Africa
- Figure 83. Impact of COVID-19 Pandemic on Natural Food Colors in South America
The natural food colors market is projected to reach US$ 3.17 billion by 2028 from US$ 2.10 billion in 2022. It is expected to grow at a CAGR of 7.1% during 2022-2028.
The natural food colors market is driven by the increasing awareness about the harmful effects of synthetic colors among consumers, along with the rising disposable incomes of people. Moreover, rapid urbanization, a modern lifestyle, and a rise in consumer spending are changing their overall eating habits. In many urban areas, the growing trend of packaged food products is contributing to natural food colors market growth. Natural food colors are safer to consume and add nutritional value to the food. Natural food colors also have antioxidants which help reduce the risk of many diseases. One of the main drivers of the natural food colors market is the increasing consumer proclivity toward clean label products.
People prefer natural food colors to avoid the drawbacks of synthetic food colors. Synthetic food colors have a chemical composition which destroys the nutrients in the food. They can also cause skin irritation and eczema, intestinal upset and breathing problems. Natural food colors are easy to use, have superior stability, and enhance the appearance of food. Additionally, the presence of antioxidants in natural food colors is the reason for its high demand. Furthermore, manufacturers are launching new products which provide different colors to the food and are safer to consume. With expanding population and rising health awareness, demand for healthy food products surged at phenomenal rates. The increase in the number of health-conscious millennials is anticipated to fuel the demand for organic and natural food additives. Rising disposable income and improving lifestyles are the key factors driving the global natural food colors market. Moreover, the availability of various products at multiple retail channels at affordable prices is fueling the demand for natural food colors.
Based on type, the global natural food colors market is segmented into carmine, anthocyanins, caramel, curcumin, annatto, carotenoids, chlorophyll, and others. In 2021, the carotenoids segment accounted for the largest revenue share, and the anthocyanins segment is expected to account for the highest growth rate during the forecast period. In terms of form, the global natural food colors market is segmented into liquid & gel and powder. In 2021, the liquid & gel segment accounted for the largest revenue share. Based on application, the global natural food colors market is segmented into bakery and confectionery, dairy and frozen desserts, beverages, sauces; dressings; and condiments, RTC and RTE products, meat; poultry; and seafood, and others. In 2021, the beverages segment accounted for the largest revenue share.
By region, the natural food colors market is segmented into North America, Europe, Asia Pacific (APAC), the Middle East & Africa (MEA), and South & Central America. In 2021, Europe held the largest share of the market. However, Asia Pacific is estimated to register the highest CAGR during the forecast period.
The Asia Pacific natural food colors market is the fastest growing region. The region is segmented into Australia, China, India, Japan, South Korea, and the Rest of Asia Pacific. The market in the region is growing significantly due to the surging consumer awareness about the harmful effects of synthetic food colors. Moreover, continuous efforts of confectionery brands in Asia Pacific to phase out all artificial colors from their product portfolio will continue to work to the advantage of natural food colors market growth. Furthermore, the demand for food with natural ingredients and clean labels is increasing in almost all regions. Clean-label products are organic, natural, non-GMO, and minimally processed consumer-friendly products. The increasing health awareness among consumers is driving the demand for natural and clean-label products, which, in turn, will fuel the growth of the natural food color market. Consumers are becoming inclined toward clean-label products as they are becoming more aware of synthetic ingredients and their negative effects. This will drive them to adopt products and diets with clean-label ingredients. The increase in demand for clean label products will ultimately lead to the growth of the natural food colors market.
Koninklijke DSM N.V., Sensient Technologies, Archer Daniels Midland Company, Dohler Group, BASF SE, Naturex S.A, Aromata Group, Givaudan, Dupont, Oterra A/S, and Mane KANCOR are among the key players operating in the natural food colors market. These companies provide a wide range of product portfolios for the market. The companies in developing regions are providing lucrative market growth opportunities. Market players are developing high-quality, innovative products to meet customer requirements.
The overall size of the global natural food colors market has been derived using both primary and secondary sources. To begin the research process, exhaustive secondary research has been conducted using internal and external sources to obtain qualitative and quantitative information related to the market. Also, multiple primary interviews have been conducted with industry participants to validate the data and gain analytical insights into the topic. Participants in this process include industry experts, such as VPs, business development managers, market intelligence managers, and national sales managers, along with external consultants, such as valuation experts, research analysts, and key opinion leaders, specializing in the natural food colors market.
Reasons to Buy:
- Save and reduce time carrying out entry-level research by identifying the growth, size, leading players, and segments in the global natural food colors market
- Highlights key business priorities in order to assist companies to realign their business strategies
- The key findings and recommendations highlight crucial progressive industry trends in the global natural food colors market, thereby allowing players across the value chain to develop effective long-term strategies
- Develop/modify business expansion plans by using substantial growth offering developed and emerging markets
- Scrutinize in-depth global market trends and outlook coupled with the factors driving the natural food colors market as well as those hindering it.
- Enhance the decision-making process by understanding the strategies that underpin commercial interest with respect to client products, segmentation, pricing, and distribution
Table Of Contents
1. Introduction
- 1.1 Study Scope
- 1.2 The Insight Partners Research Report Guidance
- 1.3 Market Segmentation
2. Key Takeaways
3. Research Methodology
- 3.1 Scope of the Study
- 3.2 Research Methodology
- 3.2.1 Data Collection
- 3.2.2 Primary Interviews
- 3.2.3 Hypothesis Formulation
- 3.2.4 Macro-economic Factor Analysis
- 3.2.5 Developing Base Number
- 3.2.6 Data Triangulation
- 3.2.7 Country Level Data
4. Global Natural Food Colors Market Landscape
- 4.1 Market Overview
- 4.2 Porter's Five Forces Analysis
- 4.2.1 Threat of New Entrants
- 4.2.2 Bargaining Power of Suppliers
- 4.2.3 Bargaining Power of Buyers
- 4.2.4 Competitive Rivalry
- 4.2.5 Threat of Substitutes
- 4.3 Ecosystem Analysis
- 4.3.1 Ecosystem: Global Natural Food Colors Market
5. Natural Food Colors Market - Key Market Dynamics
- 5.1 Market Drivers
- 5.1.1 Rising consumer concerns about synthetic ingredients
- 5.1.2 Increasing consumer proclivity towards clean label products
- 5.2 Market Restraints
- 5.2.1 Higher cost of natural ingredients
- 5.3 Market Opportunities
- 5.3.1 Rise in the number of end-use applications
- 5.4 Future Trends
- 5.4.1 Availability of wide range of natural food colors
- 5.5 Impact Analysis of Drivers and Restraint
6. Global Market- Global Analysis
- 6.1 Global Market Overview
- 6.2 Natural Food Colors Market -Revenue and Forecast To 2028 (US$ Million)
- 6.3 Market Positioning - Global Market Players
7. Natural Food Colors Market Analysis - by Type
- 7.1 Overview
- 7.2 Natural Food Colors Market, by Type (2021 and 2028)
- 7.3 Carmine
- 7.3.1 Overview
- 7.3.2 Carmine: Natural Food Colors Market - Revenue and Forecast to 2028 (US$ Million)
- 7.4 Anthocyanins
- 7.4.1 Overview
- 7.4.2 Anthocyanins: Natural Food Colors Market - Revenue and Forecast to 2028 (US$ Million)
- 7.5 Caramel
- 7.5.1 Overview
- 7.5.2 Caramel: Natural Food Colors Market - Revenue and Forecast to 2028 (US$ Million)
- 7.6 Curcumin
- 7.6.1 Overview
- 7.6.2 Curcumin: Natural Food Colors Market - Revenue and Forecast to 2028 (US$ Million)
- 7.7 Annatto
- 7.7.1 Overview
- 7.7.2 Annatto: Natural Food Colors Market - Revenue and Forecast to 2028 (US$ Million)
- 7.8 Carotenoids
- 7.8.1 Overview
- 7.8.2 Carotenoids: Natural Food Colors Market - Revenue and Forecast to 2028 (US$ Million)
- 7.9 Chlorophyll
- 7.9.1 Overview
- 7.9.2 Chlorophyll: Natural Food Colors Market - Revenue and Forecast to 2028 (US$ Million)
- 7.10 Others
- 7.10.1 Overview
- 7.10.2 Others: Natural Food Colors Market - Revenue and Forecast to 2028 (US$ Million)
8. Natural Food Colors Market Analysis - by Form
- 8.1 Overview
- 8.2 Natural Food Colors Market, by Form (2021 and 2028)
- 8.3 Liquid & Gel
- 8.3.1 Overview
- 8.3.2 Liquid & Gel: Natural Food Colors Market - Revenue and Forecast to 2028 (US$ Million)
- 8.4 Powder
- 8.4.1 Overview
- 8.4.2 Powder: Natural Food Colors Market - Revenue and Forecast to 2028 (US$ Million)
9. Natural Food Colors Market Analysis - by Application
- 9.1 Overview
- 9.2 Natural Food Colors Market, by Application (2021 and 2028)
- 9.3 Bakery and Confectionery
- 9.3.1 Overview
- 9.3.2 Bakery and Confectionery: Natural Food Colors Market - Revenue and Forecast to 2028 (US$ Million)
- 9.4 Dairy and Frozen Desserts
- 9.4.1 Overview
- 9.4.2 Dairy and Frozen Desserts: Natural Food Colors Market - Revenue and Forecast to 2028 (US$ Million)
- 9.5 Beverages
- 9.5.1 Overview
- 9.5.2 Beverages: Natural Food Colors Market - Revenue and Forecast to 2028 (US$ Million)
- 9.6 Sauces, Dressings and Condiments
- 9.6.1 Overview
- 9.6.2 Sauces, Dressings and Condiments: Natural Food Colors Market - Revenue and Forecast to 2028 (US$ Million)
- 9.7 RTC and RTE Products
- 9.7.1 Overview
- 9.7.2 RTC and RTE Products: Natural Food Colors Market - Revenue and Forecast to 2028 (US$ Million)
- 9.8 Meat, Poultry and Seafood
- 9.8.1 Overview
- 9.8.2 Meat, Poultry and Seafood: Natural Food Colors Market - Revenue and Forecast to 2028 (US$ Million)
- 9.9 Others
- 9.9.1 Overview
- 9.9.2 Others: Natural Food Colors Market - Revenue and Forecast to 2028 (US$ Million)
10. Natural Food Colors Market- Geographic Analysis
- 10.1 Overview
- 10.2 North America: Natural Food Colors Market
- 10.2.1 North America: Natural Food Colors Market-Revenue and Forecast to 2028 (US$ Million)
- 10.2.2 North America: Natural Food Colors Market, By Type
- 10.2.3 North America: Natural Food Colors Market, by Form
- 10.2.4 North America: Natural Food Colors Market, by Application
- 10.2.5 North America: Natural Food Colors Market, by Key Country
- 10.2.5.1 US: Natural Food Colors Market- Revenue and Forecast to 2028 (US$ Million)
- 10.2.5.1.1 US: Natural Food Colors Market, By Type
- 10.2.5.1.2 US: Natural Food Colors Market, by Form
- 10.2.5.1.3 US: Natural Food Colors Market, by Application
- 10.2.5.2 Mexico: Natural Food Colors Market- Revenue and Forecast to 2028 (US$ Million)
- 10.2.5.2.1 Mexico: Natural Food Colors Market, By Type
- 10.2.5.2.2 Mexico: Natural Food Colors Market, by Form
- 10.2.5.2.3 Mexico: Natural Food Colors Market, by Application
- 10.2.5.3 Canada: Natural Food Colors Market- Revenue and Forecast to 2028 (US$ Million)
- 10.2.5.3.1 Canada: Natural Food Colors Market, By Type
- 10.2.5.3.2 Canada: Natural Food Colors Market, by Form
- 10.2.5.3.3 Canada: Natural Food Colors Market, by Application
- 10.2.5.1 US: Natural Food Colors Market- Revenue and Forecast to 2028 (US$ Million)
- 10.3 Europe: Natural Food Colors Market
- 10.3.1 Europe: Natural Food Colors Market-Revenue and Forecast to 2028 (US$ Million)
- 10.3.2 Europe: Natural Food Colors Market, By Type
- 10.3.3 Europe: Natural Food Colors Market, by Form
- 10.3.4 Europe: Natural Food Colors Market, by Application
- 10.3.5 Europe: Natural Food Colors Market, by Key Country
- 10.3.5.1 Germany: Natural Food Colors Market- Revenue and Forecast to 2028 (US$ Million)
- 10.3.5.1.1 Germany: Natural Food Colors Market, By Type
- 10.3.5.1.2 Germany: Natural Food Colors Market, by Form
- 10.3.5.1.3 Germany: Natural Food Colors Market, by Application
- 10.3.5.2 France: Natural Food Colors Market- Revenue and Forecast to 2028 (US$ Million)
- 10.3.5.2.1 France: Natural Food Colors Market, By Type
- 10.3.5.2.2 France: Natural Food Colors Market, by Form
- 10.3.5.2.3 France: Natural Food Colors Market, by Application
- 10.3.5.3 Italy: Natural Food Colors Market- Revenue and Forecast to 2028 (US$ Million)
- 10.3.5.3.1 Italy: Natural Food Colors Market, By Type
- 10.3.5.3.2 Italy: Natural Food Colors Market, by Form
- 10.3.5.3.3 Italy: Natural Food Colors Market, by Application
- 10.3.5.4 UK: Natural Food Colors Market- Revenue and Forecast to 2028 (US$ Million)
- 10.3.5.4.1 UK: Natural Food Colors Market, By Type
- 10.3.5.4.2 UK: Natural Food Colors Market, by Form
- 10.3.5.4.3 UK: Natural Food Colors Market, by Application
- 10.3.5.5 Russia: Natural Food Colors Market- Revenue and Forecast to 2028 (US$ Million)
- 10.3.5.5.1 Russia: Natural Food Colors Market, By Type
- 10.3.5.5.2 Russia: Natural Food Colors Market, by Form
- 10.3.5.5.3 Russia: Natural Food Colors Market, by Application
- 10.3.5.6 Rest of Europe: Natural Food Colors Market- Revenue and Forecast to 2028 (US$ Million)
- 10.3.5.6.1 Rest of Europe: Natural Food Colors Market, By Type
- 10.3.5.6.2 Rest of Europe: Natural Food Colors Market, by Form
- 10.3.5.6.3 Rest of Europe: Natural Food Colors Market, by Application
- 10.3.5.1 Germany: Natural Food Colors Market- Revenue and Forecast to 2028 (US$ Million)
- 10.4 Asia Pacific: Natural Food Colors Market
- 10.4.1 Asia Pacific: Natural Food Colors Market-Revenue and Forecast to 2028 (US$ Million)
- 10.4.2 Asia Pacific: Natural Food Colors Market, By Type
- 10.4.3 Asia Pacific: Natural Food Colors Market, by Form
- 10.4.4 Asia Pacific: Natural Food Colors Market, by Application
- 10.4.5 Asia Pacific: Natural Food Colors Market, by Key Country
- 10.4.5.1 Australia: Natural Food Colors Market-Revenue and Forecast to 2028 (US$ Million)
- 10.4.5.1.1 Australia: Natural Food Colors Market, By Type
- 10.4.5.1.2 Australia: Natural Food Colors Market, by Form
- 10.4.5.1.3 Australia: Natural Food Colors Market, by Application
- 10.4.5.2 China: Natural Food Colors Market-Revenue and Forecast to 2028 (US$ Million)
- 10.4.5.2.1 China: Natural Food Colors Market, By Type
- 10.4.5.2.2 China: Natural Food Colors Market, by Form
- 10.4.5.2.3 China: Natural Food Colors Market, by Application
- 10.4.5.3 India: Natural Food Colors Market-Revenue and Forecast to 2028 (US$ Million)
- 10.4.5.3.1 India: Natural Food Colors Market, By Type
- 10.4.5.3.2 India: Natural Food Colors Market, by Form
- 10.4.5.3.3 India: Natural Food Colors Market, by Application
- 10.4.5.4 Japan: Natural Food Colors Market-Revenue and Forecast to 2028 (US$ Million)
- 10.4.5.4.1 Japan: Natural Food Colors Market, By Type
- 10.4.5.4.2 Japan: Natural Food Colors Market, by Form
- 10.4.5.4.3 Japan: Natural Food Colors Market, by Application
- 10.4.5.5 South Korea: Natural Food Colors Market-Revenue and Forecast to 2028 (US$ Million)
- 10.4.5.5.1 South Korea: Natural Food Colors Market, By Type
- 10.4.5.5.2 South Korea: Natural Food Colors Market, by Form
- 10.4.5.5.3 South Korea: Natural Food Colors Market, by Application
- 10.4.5.6 Rest of Asia Pacific: Natural Food Colors Market-Revenue and Forecast to 2028 (US$ Million)
- 10.4.5.6.1 Rest of Asia Pacific: Natural Food Colors Market, By Type
- 10.4.5.6.2 Rest of Asia Pacific: Natural Food Colors Market, by Form
- 10.4.5.6.3 Rest of Asia Pacific: Natural Food Colors Market, by Application
- 10.4.5.1 Australia: Natural Food Colors Market-Revenue and Forecast to 2028 (US$ Million)
- 10.5 Middle East & Africa: Natural Food Colors Market
- 10.5.1 Middle East & Africa: Natural Food Colors Market-Revenue and Forecast to 2028 (US$ Million)
- 10.5.2 Middle East & Africa: Natural Food Colors Market, By Type
- 10.5.3 Middle East & Africa: Natural Food Colors Market, by Form
- 10.5.4 Middle East & Africa: Natural Food Colors Market, by Application
- 10.5.5 East & Africa: Natural Food Colors Market, by Key Country
- 10.5.5.1 South Africa: Natural Food Colors Market-Revenue and Forecast to 2028 (US$ Million)
- 10.5.5.1.1 South Africa: Natural Food Colors Market, By Type
- 10.5.5.1.2 South Africa: Natural Food Colors Market, by Form
- 10.5.5.1.3 South Africa: Natural Food Colors Market, by Application
- 10.5.5.2 Saudi Arabia: Natural Food Colors Market-Revenue and Forecast to 2028 (US$ Million)
- 10.5.5.2.1 Saudi Arabia: Natural Food Colors Market, By Type
- 10.5.5.2.2 Saudi Arabia: Natural Food Colors Market, by Form
- 10.5.5.2.3 Saudi Arabia: Natural Food Colors Market, by Application
- 10.5.5.3 UAE: Natural Food Colors Market-Revenue and Forecast to 2028 (US$ Million)
- 10.5.5.3.1 UAE: Natural Food Colors Market, By Type
- 10.5.5.3.2 UAE: Natural Food Colors Market, by Form
- 10.5.5.3.3 UAE: Natural Food Colors Market, by Application
- 10.5.5.4 Rest of MEA: Natural Food Colors Market-Revenue and Forecast to 2028 (US$ Million)
- 10.5.5.4.1 Rest of MEA: Natural Food Colors Market, By Type
- 10.5.5.4.2 Rest of MEA: Natural Food Colors Market, by Form
- 10.5.5.4.3 Rest of MEA: Natural Food Colors Market, by Application
- 10.5.5.1 South Africa: Natural Food Colors Market-Revenue and Forecast to 2028 (US$ Million)
- 10.6 South & Central America: Natural Food Colors Market
- 10.6.1 South & Central America: Natural Food Colors Market-Revenue and Forecast to 2028 (US$ Million)
- 10.6.2 South & Central America: Natural Food Colors Market, By Type
- 10.6.3 South & Central America: Natural Food Colors Market, by Form
- 10.6.4 South & Central America: Natural Food Colors Market, by Application
- 10.6.5 South & Central America: Natural Food Colors Market, by Key Country
- 10.6.5.1 Brazil: Natural Food Colors Market- Revenue and Forecast to 2028 (US$ Million)
- 10.6.5.1.1 Brazil: Natural Food Colors Market, By Type
- 10.6.5.1.2 Brazil: Natural Food Colors Market, by Form
- 10.6.5.1.3 Brazil: Natural Food Colors Market, by Application
- 10.6.5.2 Argentina: Natural Food Colors Market- Revenue and Forecast to 2028 (US$ Million)
- 10.6.5.2.1 Argentina: Natural Food Colors Market, By Type
- 10.6.5.2.2 Argentina: Natural Food Colors Market, by Form
- 10.6.5.2.3 Argentina: Natural Food Colors Market, by Application
- 10.6.5.3 Rest of South & Central America: Natural Food Colors Market- Revenue and Forecast to 2028 (US$ Million)
- 10.6.5.3.1 Rest of South & Central America: Natural Food Colors Market, By Type
- 10.6.5.3.2 Rest of South & Central America: Natural Food Colors Market, by Form
- 10.6.5.3.3 Rest of South & Central America: Natural Food Colors Market, by Application
- 10.6.5.1 Brazil: Natural Food Colors Market- Revenue and Forecast to 2028 (US$ Million)
11. Impact of COVID-19
- 11.1 Overview - Impact of COVID-19
- 11.2 North America: Impact Assessment of COVID-19 Pandemic
- 11.3 Europe: Impact Assessment of COVID-19 Pandemic
- 11.4 Asia Pacific: Impact Assessment of COVID-19 Pandemic
- 11.5 Middle East and Africa: Impact Assessment of COVID-19 Pandemic
- 11.6 South America: Impact Assessment of COVID-19 Pandemic
12. Company Profiles
- 12.1 Koninklijke DSM N.V.
- 12.1.1 Key Facts
- 12.1.2 Business Description
- 12.1.3 Products and Services
- 12.1.4 Financial Overview
- 12.1.5 SWOT Analysis
- 12.1.6 Key Developments
- 12.2 Sensient Technologies Corporation
- 12.2.1 Key Facts
- 12.2.2 Business Description
- 12.2.3 Products and Services
- 12.2.4 Financial Overview
- 12.2.5 SWOT Analysis
- 12.2.6 Key Developments
- 12.3 Archer Daniels Midland Company
- 12.3.1 Key Facts
- 12.3.2 Business Description
- 12.3.3 Products and Services
- 12.3.4 Financial Overview
- 12.3.5 SWOT Analysis
- 12.3.6 Key Developments
- 12.4 Dohler Group
- 12.4.1 Key Facts
- 12.4.2 Business Description
- 12.4.3 Products and Services
- 12.4.4 Financial Overview
- 12.4.5 SWOT Analysis
- 12.4.6 Key Developments
- 12.5 BASF SE
- 12.5.1 Key Facts
- 12.5.2 Business Description
- 12.5.3 Products and Services
- 12.5.4 Financial Overview
- 12.5.5 SWOT Analysis
- 12.5.6 Key Developments
- 12.6 Naturex S.A.
- 12.6.1 Key Facts
- 12.6.2 Business Description
- 12.6.3 Products and Services
- 12.6.4 Financial Overview
- 12.6.5 SWOT Analysis
- 12.6.6 Key Developments
- 12.7 Aromata Group
- 12.7.1 Key Facts
- 12.7.2 Business Description
- 12.7.3 Products and Services
- 12.7.4 Financial Overview
- 12.7.5 SWOT Analysis
- 12.7.6 Key Developments
- 12.8 Givaudan S.A.
- 12.8.1 Key Facts
- 12.8.2 Business Description
- 12.8.3 Products and Services
- 12.8.4 Financial Overview
- 12.8.5 SWOT Analysis
- 12.8.6 Key Developments
- 12.9 DuPont
- 12.9.1 Key Facts
- 12.9.2 Business Description
- 12.9.3 Products and Services
- 12.9.4 Financial Overview
- 12.9.5 SWOT Analysis
- 12.9.6 Key Developments
- 12.10 Oterra A/S
- 12.10.1 Key Facts
- 12.10.2 Business Description
- 12.10.3 Products and Services
- 12.10.4 Financial Overview
- 12.10.5 SWOT Analysis
- 12.10.6 Key Developments
- 12.11 Mane Kancor Ingredients Pvt. Ltd.
- 12.11.1 Key Facts
- 12.11.2 Business Description
- 12.11.3 Products and Services
- 12.11.4 Financial Overview
- 12.11.5 SWOT Analysis
- 12.11.6 Key Developments
13. Appendix
- 13.1 About The Insight Partners
- 13.2 Glossary of Terms