
医療画像分野におけるAI市場:2030年までの業界動向と世界の予測 - 応用分野別、処理画像タイプ別、主要地域別
AI in Medical Imaging Market, till 2030: Distribution by Application Area, Type of Image Processed, and Key Geographical Regions: Industry Trends and Global Forecasts- 発行日
- ページ情報
- 英文 389 Pages
- 納期
- 7~10営業日
- 商品コード
- 1895186
- カスタマイズ可能 お客様のご希望に応じて、既存データの加工や未掲載情報(例:国別セグメント)の追加などの対応が可能です。詳細はお問い合わせください。
- 翻訳ツール提供対象 PDF対応AI翻訳ツールの無料貸し出しサービスのご利用が可能です
- 医薬品関連専門 医薬品関連専門を専門とする市場調査会社です。
医療画像分野におけるAI市場の展望
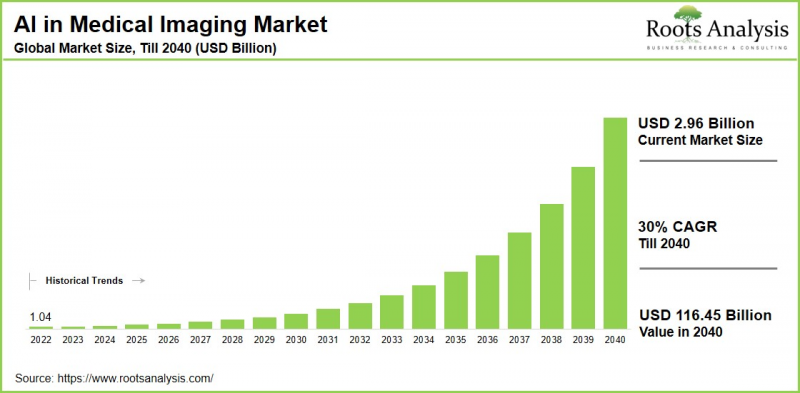
世界の医療画像分野におけるAI市場の規模は、現在の17億5,000万米ドルから2040年までに85億6,000万米ドルへ成長すると予測されております。予測期間(2040年まで)におけるCAGRは30%と推計されております。本調査では、医療画像分野におけるAI市場に関する包括的な分析を提供しております。具体的には、市場分析、パイプライン分析、パートナーシップ・協業状況、資金調達・投資動向分析、企業評価分析、特許分析、コスト削減分析、詳細な市場分析を含みます。
今後10年間の医療画像分野におけるAI市場の成長は、特に深層学習アルゴリズムにおける人工知能(AI)技術の導入拡大、個別化医療・精密医療への注目の高まり、対象層における未充足ニーズ、ベンチャーキャピタルからの支援に起因すると予想されます。ディープラーニングとは、高度なアルゴリズムと人工ニューラルネットワークを活用し、大量の非構造化データから教師なしパターン認識と知見生成を可能とする機械学習の手法です。この技術は、画像診断やデータ分析に基づく医療診断を含む、医療業界の様々な分野に段階的に統合されつつあります。
業界の様々な利害関係者が、医療画像処理のための独自の深層学習アルゴリズムを開発してまいりました。現在では、多くの革新的な企業様が、コンピュータに医療画像の検査と優先順位付けを学習させ、人間の目では認識できない可能性のある時間的・空間的変化に関連するパターンを特定できるシステムを開発したと主張しております。
経営幹部向け戦略的インサイト
医療画像市場におけるAI成長を牽引する主な要因
医療画像分野におけるAI市場の成長を牽引する主な要因としては、診断プロセスの増加、有資格放射線科医の不足、遠隔医療や遠隔診断におけるAIの統合の進展、そして膨大な医療データセットを効率的に管理する必要性が挙げられます。ディープラーニング、畳み込みニューラルネットワーク、生成対抗ネットワークなどの技術革新により、医療画像解析におけるAIアプリケーションの精度と有効性が向上しています。さらに、政府の支援、有利な規制環境、病院とAIソリューションプロバイダー間の連携が、導入プロセスを加速させています。
その他の重要な成長要因としては、マンモグラフィー、超音波検査、MRI、病理検査など、様々な医療画像技術におけるAIアプリケーションの拡大が挙げられます。AIは画像ノイズの低減、スキャン時の放射線被曝量の削減、臨床判断プロセスの向上に貢献しています。
医療画像産業におけるAIの技術的進歩
人工知能(AI)の技術的進歩は、医療画像技術の精度、効率性、診断のカスタマイズ性を向上させています。AI駆動アルゴリズムは現在、CT、MRI、X線など様々な画像技術において、腫瘍や骨折などの異常を正確に検出・識別できます。これらのシステムは日常業務を引き継ぎ、ワークフローを最適化し、放射線科医の疲労を軽減することで、臨床医がより複雑な症例に集中することを可能にします。さらに、AIは画像情報と臨床データ・ゲノムデータを統合し、疾患リスク評価のための個別化された知見と予測分析を提供します。生成AIのような革新技術は画像データセットを拡充し、リアルタイムAIツールは手術ナビゲーションを支援して処置の精度を高めます。
さらに、説明可能なAIとフェデレーテッドラーニングは、臨床環境における透明性と拡張性を向上させます。これらの進展が相まって、より早期かつ精密な診断を可能にし、最終的には世界中の患者の治療成果を向上させることで、医療画像診断を変革しつつあります。
医療画像診断におけるAI市場:業界の競合情勢
医療画像診断におけるAI市場の競合情勢は、大手企業と中小企業の共存による激しい競争が特徴です。主要ティア1企業(GE Healthcare、Siemens Healthineers、Philips、Canon Medical)は、統合型AIエコシステムを画像診断システムに組み込むことで優位性を維持しています。ティア2企業(Aidoc、Arterys、Qure.ai、Gleamer、Viz.ai)は、疾患特異的アプリケーション向けに設計された俊敏なクラウドネイティブアルゴリズムを通じて市場を変革中です。今後の競合における差別化は、モデルの説明可能性、相互運用性、臨床検証の程度といった要素に依存する見込みです。AIマーケットプレース、オープンAIプラットフォーム、ベンダー中立型統合フレームワークに関連する新たな動向が、競合の力学をさらに再構築すると予想されます。
医療画像診断におけるAIの進化 - 業界の新興動向
この業界における主な動向には、より広範な臨床導入を可能にする迅速な規制承認、患者情報に基づいたスキャンプロトコルの最適化のためのAI活用、特に日常的な診断がAIによって行われることが増えている放射線科分野におけるワークフロー最適化のためのAI搭載ツールの導入などが挙げられます。AI支援超音波検査、手術中のリアルタイム画像評価、クラウドベースソリューションといった革新的な開発により、地方や医療資源が不足している地域においても、高度な画像診断へのアクセスが改善されています。これらの進歩により、画像診断は定性的な分野からデータ駆動型へと移行しつつあり、精度・効率・医療の公平性の向上を伴う患者中心のアプローチに焦点が当てられています。
主要な市場課題
医療画像診断におけるAI導入の主な課題には、導入および継続的な維持管理にかかる多大なコスト、機微な患者データのプライバシーとセキュリティに関する懸念が含まれます。さらに、新技術に関連する規制上の課題、既存システムとの円滑な統合の必要性、医療従事者からの受容も成長を妨げています。
その他の重要な課題としては、既存ワークフローへの統合不足、医療データの断片化、孤立したITシステムが挙げられ、これらがAIソリューションのシームレスな導入を妨げています。さらに、データプライバシーに関する倫理的・規制上の問題、AIモデルのバイアス、説明責任の確保といった課題も臨床導入の障壁となっています。加えて、有能なAI人材の不足や規制ガイダンスの不明確さも、成長と日常的な臨床実践への統合をさらに複雑化させています。
地域別分析 - アジアが市場で最大のシェアを占める
当社の推計によれば、北米は現在、医療画像診断におけるAI市場で大きなシェアを占めております。これは、高度な医療システム、医療技術への多大な財政支援、特に米国における活発な研究開発活動によるものです。多くのトップテクノロジー企業や革新的なスタートアップの存在が、最先端のAIアプリケーションの開発と導入を促進しております。
さらに、北米の規制環境は、積極的なFDA承認と償還インセンティブを特徴としており、AIソリューションの導入を促進しています。また、この地域では慢性疾患の罹患率が高く、AI強化型画像診断による早期かつ精密な診断への需要が高まっています。
医療画像診断におけるAI市場:主要市場セグメンテーション
応用分野
- 肺感染症/呼吸器疾患
- 脳損傷・脳疾患
- 肺がん
- 心臓疾患/心血管疾患
- 骨の変形・整形外科疾患
- 乳がん
- その他
処理画像タイプ
- X線
- MRI
- CT
- 超音波
地理的地域
- 北米
- 米国
- カナダ
- メキシコ
- その他の北米諸国
- 欧州
- オーストリア
- ベルギー
- デンマーク
- フランス
- ドイツ
- アイルランド
- イタリア
- オランダ
- ノルウェー
- ロシア
- スペイン
- スウェーデン
- スイス
- 英国
- その他の欧州諸国
- アジア
- 中国
- インド
- 日本
- シンガポール
- 韓国
- その他のアジア諸国
- ラテンアメリカ
- ブラジル
- チリ
- コロンビア
- ベネズエラ
- その他のラテンアメリカ諸国
- 中東および北アフリカ
- エジプト
- イラン
- イラク
- イスラエル
- クウェート
- サウジアラビア
- アラブ首長国連邦
- その他中東・北アフリカ諸国
- 世界のその他の地域
- オーストラリア
- ニュージーランド
- その他の国々
医療画像診断分野におけるAI市場の代表的な参入企業
- Artelus
- Arterys
- Butterfly Network
- ContextVision
- Enlitic
- Echonous
- GE Healthcare
- InferVision
- VUNO
医療画像分野におけるAI市場:レポートのカバー範囲
医療画像分野におけるAI市場に関する当レポートでは、以下の様々なセクションに関する洞察を提供しております:
- 市場規模と機会分析:医療画像分野におけるAI市場の詳細な分析。主な市場セグメント([A]応用分野、[B]処理画像タイプ、[C]主要地域)に焦点を当てています。
- 競合情勢:設立年、企業規模、本社所在地、所有構造など、複数の関連パラメータに基づき、医療画像分野におけるAI市場に参入している企業を包括的に分析します。
- 企業プロファイル:医療画像分野におけるAI市場で活動する主要企業の詳細なプロファイルを提供します。内容は[A]本社所在地、[B]企業規模、[C]企業理念、[D]事業展開地域、[E]経営陣、[F]連絡先、[G]財務情報、[H]事業セグメント、[I]製品ポートフォリオ、[J]最近の動向、および将来展望を含みます。
- メガトレンド:医療画像分野におけるAI産業の継続的なメガトレンドを評価します。
- 特許分析:医療画像分野におけるAI関連の出願済み/登録済み特許について、[A]特許の種類、[B]特許公開年、[C]特許の経過年数、[D]主要プレイヤーといった関連パラメータに基づく詳細な分析。
- 最近の動向:医療画像分野におけるAI市場の最近の動向の概要と、[A]取り組みの年次、[B]取り組みの種類、[C]地理的分布、[D]最も活発なプレイヤーといった関連パラメータに基づく分析。
- ポーターのファイブフォース分析:医療画像分野におけるAI市場に存在する5つの競争的要因(新規参入業者の脅威、買い手の交渉力、供給企業の交渉力、代替品の脅威、既存競合他社間の競争)の分析。
- SWOT分析:当該分野における強み、弱み、機会、脅威を明示する洞察に富んだSWOTフレームワークです。さらにハーベイボール分析を提供し、各SWOTパラメータの相対的な影響度を強調します。
- バリューチェーン分析:医療画像分野におけるAI市場の各段階と利害関係者を網羅した包括的な分析を提供します。
目次
セクションI:レポートの概要
第1章 序文
第2章 調査手法
第3章 市場力学
第4章 マクロ経済指標
セクションII:定性的な洞察
第5章 エグゼクティブサマリー
第6章 イントロダクション
- 章の概要
- 医療画像分野におけるAI市場の概要
- 将来の展望
第7章 規制シナリオ
セクションIII:市場概要
第8章 主要参入企業の包括的なデータベース
第9章 競合情勢
- 章の概要
- 医療画像分野におけるAI市場:市場情勢
第10章 ホワイトスペース分析
第11章 企業競争力分析
第12章 医療画像市場におけるAIスタートアップエコシステム
- 医療画像分野におけるAI市場:スタートアップの市場情勢
- 主な調査結果
セクションIV:企業プロファイル
第13章 企業プロファイル
- 章の概要
- Artelus*
- Arterys
- Butterfly Network
- ContextVision
- Enlitic
- Echonous
- GE Healthcare
- InferVision
- VUNO
セクションV:市場動向
第14章 メガ動向分析
第15章 特許分析
第16章 最近の動向
- 章の概要
- 最近の資金調達
- 最近のパートナーシップ
- その他の最近の取り組み
セクションVI:市場機会分析
第17章 世界の医療画像分野におけるAI市場
第18章 応用分野別の市場機会
第19章 処理画像タイプ別の市場機会
第20章 北米における医療画像分野におけるAIの市場機会
第21章 欧州における医療画像分野におけるAIの市場機会
第22章 アジアにおける医療画像分野におけるAIの市場機会
第23章 中東および北アフリカ(MENA)における医療画像におけるAIの市場機会
第24章 ラテンアメリカにおける医療画像分野におけるAIの市場機会
第25章 その他の地域における医療画像診断におけるAIの市場機会
第26章 市場集中分析:主要参入企業別分布
第27章 隣接市場分析
セクションVII:戦略ツール
第28章 重要な勝利戦略
第29章 ポーターのファイブフォース分析
第30章 SWOT分析
第31章 ROOTの戦略提言
セクションVIII:その他の独占的洞察
第32章 1次調査からの洞察
第33章 報告書の結論
セクションXI:付録
第34章 表形式データ
第35章 企業・団体一覧
第36章 ROOTのサブスクリプションサービス
第37章 著者詳細
- 発行日
- 発行
- Roots Analysis
- ページ情報
- 英文 389 Pages
- 納期
- 7~10営業日


