
バイオプリザベーション市場:業界動向と世界の予測 - 保存状態別、血清タイプ別、生物学的サンプルタイプ別、応用分野別、包装形態タイプ別、エンドユーザー別、地域別
Biopreservation Market: Industry Trends and Global Forecasts - Distribution by Preservation Condition, Type of Serum, Type of Biological Sample, Area of Application, Type of Packaging Format, End Users, and Geographical Region :- 発行日
- ページ情報
- 英文 197 Pages
- 納期
- 7~10営業日
- 商品コード
- 1771288
- カスタマイズ可能 お客様のご希望に応じて、既存データの加工や未掲載情報(例:国別セグメント)の追加などの対応が可能です。詳細はお問い合わせください。
- 翻訳ツール提供対象 PDF対応AI翻訳ツールの無料貸し出しサービスのご利用が可能です
- 医薬品関連専門 医薬品関連専門を専門とする市場調査会社です。
概要
世界のバイオプリザベーション市場:概要
バイオプリザベーションの市場規模は2035年までの予測期間中に23.6%のCAGRで拡大し、現在の19億米ドルから2035年までに155億米ドルに成長すると予測されています。
市場セグメンテーションでは、市場規模および機会分析を以下のパラメータで区分しています。
保存状態
- 冷蔵
- 冷凍/コールドチェーン
- 冷凍(超低冷凍)/DeeAp冷凍
- 低温/LN2気相保存
血清タイプ
- 牛胎児血清含有培地
- 子牛胎児血清含有培地
- ヒト血清含有培地
- 血清フリー培地
生物学的サンプルタイプ
- 生殖細胞/幹細胞
- 臓器
- 体細胞
- 組織
応用分野
- 診断
- 研究開発
- 治療
包装形態タイプ
- 袋
- ボトル
- バイアル
- その他
エンドユーザー
- 学術研究機関
- バイオバンク/ジーンバンク
- 病院
- 製薬・バイオテクノロジー企業
- その他
地域
- 北米
- 欧州
- アジア
- 中東・北アフリカ
- ラテンアメリカ
- その他の地域
世界のバイオプリザベーション市場:成長と動向
近年、効果的な治療ソリューションに対する需要の高まりを受けて、細胞ベースの製品の開発が顕著に増加しています。しかし、これらの製品は温度変化に非常に敏感であり、安全な輸送や保存のために凍結や極低温条件を必要とすることが多いです。USFDAの調査によると、間葉系細胞をベースとする治療法の申請書類の80%以上が凍結保存の必要性を示しています。このことは、ゲノムとプロテオミクスの完全性を守りつつ、ストレスによって誘発される遺伝的選択を最小限に抑えることができる高度な保存戦略が緊急に必要であることを強調しています(現在のほとんどの保存方法では不十分な点となっています)。
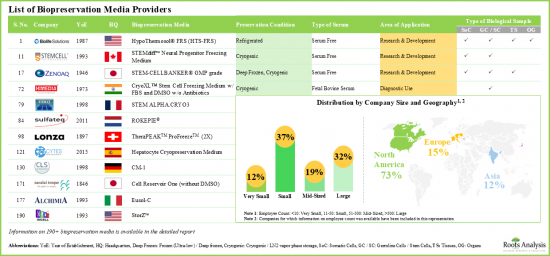
バイオプリザベーションは、細胞、組織、臓器を保存、出荷、輸送の目的で生体外で保存するために指定された唯一の生物学的アプローチです。さらに、バイオプリザベーションは、細胞生物学や分子生物学の飛躍的進歩に工学的概念を融合させることにより、製品に関連する様々な課題に対する解決策を提供します。その結果、業界の利害関係者は、調合済みで市販されているバイオプリザベーション培地にますます目を向けるようになっています。バイオプリザベーション用培地は、生物学的サンプルの保存に有効性を与える上で最も重要なもの一つです。培地の種類の選択は、保存に必要な期間、保存される生物学的サンプルタイプ、バイオプリザベーションの目的によって異なります。現在、様々な企業が、様々な種類の生物学的サンプルの保存と保管のために設計された190のバイオプリザベーションとバイオバンキング・ソリューションの提供に従事しています。
世界のバイオプリザベーション市場:主要インサイト
当レポートでは、世界のバイオプリザベーション市場の現状を掘り下げ、業界内の潜在的な成長機会を特定しています。当レポートの主な調査結果は以下の通りです。
- 世界全体で60以上の企業が、異なる保存状態での生物学的サンプルの保存を目的としたバイオプリザベーション培地を提供しています。
- バイオプリザベーション培地は、様々な生物サンプルに適合する様々な包装形態タイプで提供されています。
- 体細胞の保存を目的としたバイオプリザベーション培地のうち、45%近くは血清を含んでいません。
- バイオプリザベーション用培地の大部分(~90%)は極低温条件下での保存をサポートしており、代表的な例としてはC80EZ 2X、C80EZ Standard Medium、C80EZ-Neuron、C80EZ-TISSUEが挙げられます。
- 複数の包装形態タイプで培地を提供している企業の顕著な例としては、Akron Biotech、BioLife Solutions、Fuji Film、Protide Pharmaceuticals、ScienCell Research Laboratoriesなどが挙げられます。
- 競争優位を築くため、企業は提供する培地の特性を着実に改善することに注力しています。
- 利害関係者の関心が高まっていることは、提携活動の活発化からも明らかです。
- 既存企業も新規参入企業も、ここ最近いくつかのパートナーシップを締結しています。
- しかし、中長期的には、有名な学術機関とも協定を結ぶことが予想されます。
- コストは、このようなバイオプリザベーション培地の受容と採用の重要な決定要因です。価格戦略マトリクスは、参入企業が自社製品の競争市場価格を評価する際に役立つと思われます。
- 温度に敏感な製品の承認が高まっていることに後押しされ、バイオプリザベーション媒体プロバイダー市場は2035年まで年率23.6%以上で成長する見通しです。
- 予測される市場機会は、さまざまなエンドユーザー、生物学的サンプル、包装形態タイプ、主要な地理的地域にうまく分散されると思われます。
バイオプリザベーション市場の参入企業例
- BioLife Solutions
- Cell Applications
- HiMedia Laboratories
- Merck
- Thermo Fisher Scientific
- United States Biological
- ZenBio
当レポートでは、世界のバイオプリザベーション市場について調査し、市場の概要とともに、保存状態別、血清タイプ別、生物学的サンプルタイプ別、応用分野別、包装形態タイプ別、エンドユーザー別動向、地域別の動向、および市場に参入する企業のプロファイルなどを提供しています。
目次
第1章 序文
第2章 エグゼクティブサマリー
第3章 イントロダクション
- 章の概要
- バイオプリザベーションイントロダクション
- バイオプリザベーションのタイプ
- バイオプリザベーション媒体の応用
- バイオプリザベーション培地の利点と限界
- 結論
第4章 市場情勢
- 章の概要
- バイオプリザベーション培地プロバイダー:サービスプロバイダーの情勢
- バイオプリザベーション培地:市場情勢
第5章 重要な洞察
第6章 企業の競争力
- 章の概要
- 前提と主要なパラメータ
- 調査手法
- 製品ポートフォリオの強さのベンチマーク
- パートナーシップ活動のベンチマーキング
- バイオプリザベーション培地プロバイダー:企業競争力分析
第7章 企業プロファイル
- 章の概要
- BioLife Solutions
- Cell Applications
- HiMedia Laboratories
- Merck
- Thermo Fischer Scientific
- United States Biological
- ZenBio
第8章 パートナーシップとコラボレーション
- 章の概要
- パートナーシップモデル
- バイオプリザベーション培地プロバイダー:パートナーシップとコラボレーション
第9章 ボウマンクロックの価格戦略
第10章 市場規模の評価と機会分析
- 章の概要
- 予測調査手法と主要な前提条件
- バイオプリザベーション培地プロバイダー市場、2035年まで
- バイオプリザベーション培地プロバイダー市場:保存状態別
- バイオプリザベーション培地プロバイダー市場:血清タイプ別
- バイオプリザベーション媒体プロバイダー市場:生物学的サンプルタイプ別
- バイオプリザベーション培地プロバイダー市場:応用分野別
- バイオプリザベーション培地プロバイダー市場:包装形態タイプ別
- バイオプリザベーション培地プロバイダー市場:エンドユーザー別
- バイオプリザベーション培地プロバイダー市場:地域別
- 結論
第11章 結論
第12章 エグゼクティブ洞察
第13章 付録I:表形式データ
第14章 付録II:企業および組織の一覧
図表
List of Tables
- Table 4.1 Biopreservation Media Providers: Information on Year of Establishment, Company Size, Location of Headquarters (Country-wise and Region-wise) and Company Type
- Table 4.2 Biopreservation Media: Information on Preservation Condition
- Table 4.3 Biopreservation Media: Information on Type of Serum
- Table 4.4 Biopreservation Media: Information on Type of Biological Sample
- Table 4.5 Biopreservation Media: Information on Area of Application
- Table 4.6 Biopreservation Media: Information on Type of Packaging Format
- Table 4.7 Biopreservation Media: Information on Packaging Volume and Product Price
- Table 6.1 Company Competitiveness Analysis: Benchmarking of Product Portfolio Strength
- Table 6.2 Company Competitiveness Analysis: Benchmarking of Partnership Activity
- Table 6.3 Company Competitiveness Analysis: List of Very Small Players
- Table 6.4 Company Competitiveness Analysis: List of Small Players
- Table 6.5 Company Competitiveness Analysis: List of Mid-Sized Players
- Table 6.6 Company Competitiveness Analysis: List of Large Players
- Table 7.1 List of Companies Profiled
- Table 7.2 BioLife Solutions: Company Overview
- Table 7.3 BioLife Solutions: Recent Developments and Future Outlook
- Table 7.4 Cell Applications: Company Overview
- Table 7.5 HiMedia Laboratories: Company Overview
- Table 7.6 HiMedia Laboratories: Recent Developments and Future Outlook
- Table 7.7 Merck: Company Overview
- Table 7.8 Merck: Recent Developments and Future Outlook
- Table 7.9 Thermo Fischer Scientific: Company Overview
- Table 7.10 Thermo Fischer Scientific: Recent Developments and Future Outlook
- Table 7.11 United States Biological: Company Overview
- Table 7.12 ZenBio: Company Overview
- Table 7.13 ZenBio: Recent Developments and Future Outlook
- Table 8.1 Biopreservation Media: List of Collaborations, Since 2015
- Table 8.2 Biopreservation Media Providers: Partnerships and Collaborations, Information on Type of Agreement (Local and International Deals) and (Intercontinental and Intracontinental Deals), Since 2015
- Table 9.1 Product Price Evaluation Matrix: Information on Preservation Condition (USD)
- Table 9.2 Product Price Evaluation Matrix: Information on Type of Serum (USD)
- Table 9.3 Product Price Evaluation Matrix: Information on Type of Biological Sample (USD)
- Table 9.4 Product Price Evaluation Matrix: Information on Minimum Packaging Volume (USD)
- Table 9.5 Product Price Evaluation Matrix: Information on Maximum Packaging Volume (USD)
- Table 9.6 Product Price Evaluation Matrix: Information on Packaging Format (USD)
- Table 9.7 Product Price Evaluation Matrix: Information on Area of Application (USD)
- Table 12.1 Cytes Biotechnologies: Company Snapshot
- Table 13.1 Biopreservation Media Providers: Distribution by Year of Establishment
- Table 13.2 Biopreservation Media Providers: Distribution by Company Size
- Table 13.3 Biopreservation Media Providers: Distribution by Type of Company
- Table 13.4 Biopreservation Media Providers: Distribution by Location of Headquarters
- Table 13.5 Biopreservation Media: Distribution by Preservation Condition
- Table 13.6 Biopreservation Media: Distribution by Type of Serum
- Table 13.7 Biopreservation Media: Distribution by Type of Biological Sample
- Table 13.8 Biopreservation Media: Distribution by Area of Application
- Table 13.9 Biopreservation Media: Distribution by Type of Packaging Format
- Table 13.10 Biopreservation Media: Distribution by Minimum Packaging Volume (mL)
- Table 13.11 Biopreservation Media: Distribution by Maximum Packaging Volume (mL)
- Table 13.12 Biopreservation Media: Distribution by Minimum Price (USD)
- Table 13.13 Biopreservation Media: Distribution by Maximum Price (USD)
- Table 13.14 Partnerships and Collaborations: Cumulative Year-wise Trend, Since 2015
- Table 13.15 Partnerships and Collaborations: Distribution by Type of Partnership
- Table 13.16 Partnerships and Collaborations: Distribution by Year and Type of Partnership
- Table 13.17 Partnerships and Collaborations: Distribution by Type of Partnership and Company Size
- Table 13.18 Partnerships and Collaborations: Distribution by Type of Partner
- Table 13.19 Partnerships and Collaborations: Year-wise Distribution by Type of Partner
- Table 13.20 Partnerships and Collaborations: Distribution by Type of Partner and Type of Partnership
- Table 13.21 Partnerships and Collaborations: Distribution by Type of Partner and Company Size
- Table 13.22 Partnerships and Collaborations: Distribution by Number of Partnerships
- Table 13.23 Partnerships and Collaborations: Local and International Deals
- Table 13.24 Partnerships and Collaborations: Intercontinental and Intracontinental Deals
- Table 13.25 Partnerships and Collaborations: Distribution by Location of Headquarters of Partner
- Table 13.26 Partnerships and Collaborations: Distribution by Location of Headquarters of Partner and Type of Partnership
- Table 13.27 Biopreservation Media Providers Market, Till 2035, Conservative, Base and Optimistic Scenarios (USD Million)
- Table 13.28 Biopreservation Media Providers Market: Distribution by Preservation Condition
- Table 13.29 Biopreservation Media Providers Market for Cryogenic / LN2 Vapor Phase, Till 2035, Conservative, Base and Optimistic Scenarios (USD Million)
- Table 13.30 Biopreservation Media Providers Market for Frozen (Ultra-low) / Deep Frozen, Till 2035, Conservative, Base and Optimistic Scenarios (USD Million)
- Table 13.31 Biopreservation Media Providers Market for Frozen / Cold Chain, Till 2035, Conservative, Base and Optimistic Scenarios (USD Million)
- Table 13.32 Biopreservation Media Providers Market for Refrigerated, Till 2035, Conservative, Base and Optimistic Scenarios (USD Million)
- Table 13.33 Biopreservation Media Providers Market: Distribution by Type of Serum
- Table 13.34 Biopreservation Media Providers Market for Fetal Bovine Serum Containing Media, Till 2035, Conservative, Base and Optimistic Scenarios (USD Million)
- Table 13.35 Biopreservation Media Providers Market for Fetal Calf Serum Containing Media, Till 2035, Conservative, Base and Optimistic Scenarios (USD Million)
- Table 13.36 Biopreservation Media Providers Market for Human Serum Containing Media, Till 2035, Conservative, Base and Optimistic Scenarios (USD Million)
- Table 13.37 Biopreservation Media Providers Market for Serum Free Media, Till 2035, Conservative, Base and Optimistic Scenarios (USD Million)
- Table 13.38 Biopreservation Media Providers Market: Distribution by Type of Biological Sample
- Table 13.39 Biopreservation Media Providers Market for Germline Cells / Stem Cells, Till 2035, Conservative, Base and Optimistic Scenarios (USD Million)
- Table 13.40 Biopreservation Media Providers Market for Organs, Till 2035, Conservative, Base and Optimistic Scenarios (USD Million)
- Table 13.41 Biopreservation Media Providers Market for Somatic Cells, Till 2035, Conservative, Base and Optimistic Scenarios (USD Million)
- Table 13.42 Biopreservation Media Providers Market for Tissues, Till 2035, Conservative, Base and Optimistic Scenarios (USD Million)
- Table 13.43 Biopreservation Media Providers Market: Distribution by Area of Application
- Table 13.44 Biopreservation Media Providers Market for Diagnostic Use, Till 2035, Conservative, Base and Optimistic Scenarios (USD Million)
- Table 13.45 Biopreservation Media Providers Market for Research and Development, Till 2035, Conservative, Base and Optimistic Scenarios (USD Million)
- Table 13.46 Biopreservation Media Providers Market for Therapeutic Use, Till 2035, Conservative, Base and Optimistic Scenarios (USD Million)
- Table 13.47 Biopreservation Media Providers Market: Distribution by Type of Packaging Format
- Table 13.48 Biopreservation Media Providers Market for Bags, Till 2035, Conservative, Base and Optimistic Scenarios (USD Million)
- Table 13.49 Biopreservation Media Providers Market for Bottles, Till 2035, Conservative, Base and Optimistic Scenarios (USD Million)
- Table 13.50 Biopreservation Media Providers Market for Vials, Till 2035, Conservative, Base and Optimistic Scenarios (USD Million)
- Table 13.51 Biopreservation Media Providers Market for Others, Till 2035, Conservative, Base and Optimistic Scenarios (USD Million)
- Table 13.52 Biopreservation Media Providers Market: Distribution by End Users
- Table 13.53 Biopreservation Media Providers Market for Academic and Research Institutes, Till 2035, Conservative, Base and Optimistic Scenarios (USD Million)
- Table 13.54 Biopreservation Media Providers Market for Biobanks / Genebanks, Till 2035, Conservative, Base and Optimistic Scenarios (USD Million)
- Table 13.55 Biopreservation Media Providers Market for Hospitals, Till 2035, Conservative, Base and Optimistic Scenarios (USD Million)
- Table 13.56 Biopreservation Media Providers Market for Pharmaceutical and Biotechnology Companies, Till 2035, Conservative, Base and Optimistic Scenarios (USD Million)
- Table 13.57 Biopreservation Media Providers Market for Other End Users, Till 2035, Conservative, Base and Optimistic Scenarios (USD Million)
- Table 13.58 Biopreservation Media Providers Market: Distribution by Region
- Table 13.59 Biopreservation Media Providers Market in North America, Till 2035, Conservative, Base and Optimistic Scenarios (USD Million)
- Table 13.60 Biopreservation Media Providers Market in Europe, Till 2035, Conservative, Base and Optimistic Scenarios (USD Million)
- Table 13.61 Biopreservation Media Providers Market in Asia, Till 2035, Conservative, Base and Optimistic Scenarios (USD Million)
- Table 13.62 Biopreservation Media Providers Market in MENA, Till 2035, Conservative, Base and Optimistic Scenarios (USD Million)
- Table 13.63 Biopreservation Media Providers Market in Latin America, Till 2035, Conservative, Base and Optimistic Scenarios (USD Million)
- Table 13.64 Biopreservation Media Providers Market in Rest of the World, Till 2035, Conservative, Base and Optimistic Scenarios (USD Million)
List of Figures
- Figure 2.1 Executive Summary: Service Providers Landscape
- Figure 2.2 Executive Summary: Market Landscape
- Figure 2.3 Executive Summary: Partnerships and Collaborations
- Figure 2.4 Executive Summary: Current and Future Market Potential
- Figure 3.1 Applications of Biopreservation Media
- Figure 3.2 Key Benefits and Limitations of Hypothermic Biopreservation Media
- Figure 3.3 Key Benefits and Limitations of Cryopreservation Media
- Figure 4.1 Biopreservation Media Providers: Distribution by Year of Establishment
- Figure 4.2 Biopreservation Media Providers: Distribution by Company Size
- Figure 4.3 Biopreservation Media Providers: Distribution by Type of Company
- Figure 4.4 Biopreservation Media Providers: Distribution by Location of Headquarters
- Figure 4.5 Biopreservation Media: Distribution by Preservation Condition
- Figure 4.6 Biopreservation Media: Distribution by Type of Serum
- Figure 4.7 Biopreservation Media: Distribution by Type of Biological Sample
- Figure 4.8 Biopreservation Media: Distribution by Area of Application
- Figure 4.9 Biopreservation Media: Distribution by Type of Packaging Format
- Figure 4.10 Biopreservation Media: Distribution by Minimum Packaging Volume (mL)
- Figure 4.11 Biopreservation Media: Distribution by Maximum Packaging Volume (mL)
- Figure 4.12 Biopreservation Media: Distribution by Minimum Price (USD)
- Figure 4.13 Biopreservation Media: Distribution by Maximum Price (USD)
- Figure 5.1 Biopreservation Media Providers: Distribution by Location of Headquarters (World Map Representation)
- Figure 5.2 Biopreservation Media Providers: Distribution by Year of Establishment, Company Size, Number of Biopreservation Media Offered and Region (4D Bubble Chart)
- Figure 5.3 Biopreservation Media: Distribution by Preservation Condition and Area of Application (Treemap Representation)
- Figure 5.4 Biopreservation Media: Distribution by Company Size, Region, Preservation Condition, Type of Serum and Type of Biological Sample (Grid Representation)
- Figure 5.5 Biopreservation Media: Distribution by Minimum Packaging Volume and Minimum Price (Heat Map Representation)
- Figure 6.1 Company Competitiveness Analysis: Benchmarking of Product Portfolio Strength
- Figure 6.2 Company Competitiveness Analysis: Benchmarking of Partnership Activity
- Figure 6.3 Company Competitiveness Analysis: Very Small Companies
- Figure 6.4 Company Competitiveness Analysis: Small Companies
- Figure 6.5 Company Competitiveness Analysis: Mid-Sized Companies
- Figure 6.6 Company Competitiveness Analysis: Large Companies
- Figure 8.1 Partnerships and Collaborations: Cumulative Year-wise Trend, Since 2015
- Figure 8.2 Partnerships and Collaborations: Logo Landscape
- Figure 8.3 Partnerships and Collaborations: Distribution by Type of Partnership
- Figure 8.4 Partnerships and Collaborations: Distribution by Year and Type of Partnership
- Figure 8.5 Partnerships and Collaborations: Distribution by Type of Partnership and Company Size
- Figure 8.6 Partnerships and Collaborations: Distribution by Type of Partner
- Figure 8.7 Partnerships and Collaborations: Year-wise Distribution by Type of Partner
- Figure 8.8 Partnerships and Collaborations: Distribution by Type of Partner and Type of Partnership
- Figure 8.9 Partnerships and Collaborations: Distribution by Type of Partner and Company Size
- Figure 8.10 Partnerships and Collaborations: Distribution by Number of Partnerships
- Figure 8.11 Partnerships and Collaborations: Local and International Deals
- Figure 8.12 Partnerships and Collaborations: Intercontinental and Intracontinental Deals
- Figure 8.13 Partnerships and Collaborations: Distribution by Location of Headquarters of Partner
- Figure 8.14 Partnerships and Collaborations: Distribution by Location of Headquarters of Partner and Type of Partnership
- Figure 9.1 Biopreservation Media: Bowman Clock Pricing Strategy Matrix
- Figure 9.2 Biopreservation Media: Bowman Clock Pricing Strategy Graphical Interpretation
- Figure 10.1 Biopreservation Media Providers Market, Till 2035 (USD Million)
- Figure 10.2 Biopreservation Media Providers Market: Distribution by Preservation Condition
- Figure 10.3 Biopreservation Media Providers Market for Cryogenic / LN2 Vapor Phase, Till 2035 (USD Million)
- Figure 10.4 Biopreservation Media Providers Market for Frozen (Ultra-low) / Deep Frozen, Till 2035 (USD Million)
- Figure 10.5 Biopreservation Media Providers Market for Frozen / Cold Chain, Till 2035 (USD Million)
- Figure 10.6 Biopreservation Media Providers Market for Refrigerated, Till 2035 (USD Million)
- Figure 10.7 Biopreservation Media Providers Market: Distribution by Type of Serum
- Figure 10.8 Biopreservation Media Providers Market for Fetal Bovine Serum Containing Media, Till 2035 (USD Million)
- Figure 10.9 Biopreservation Media Providers Market for Fetal Calf Serum Containing Media, Till 2035 (USD Million)
- Figure 10.10 Biopreservation Media Providers Market for Human Serum Containing Media, Till 2035 (USD Million)
- Figure 10.11 Biopreservation Media Providers Market for Serum Free Media, Till 2035 (USD Million)
- Figure 10.12 Biopreservation Media Providers Market: Distribution by Type of Biological Sample
- Figure 10.13 Biopreservation Media Providers Market for Germline Cells / Stem Cells, Till 2035 (USD Million)
- Figure 10.14 Biopreservation Media Providers Market for Organs, Till 2035 (USD Million)
- Figure 10.15 Biopreservation Media Providers Market for Somatic Cells, Till 2035 (USD Million)
- Figure 10.16 Biopreservation Media Providers Market for Tissues, Till 2035 (USD Million)
- Figure 10.17 Biopreservation Media Providers Market: Distribution by Area of Application
- Figure 10.18 Biopreservation Media Providers Market for Diagnostic Use, Till 2035 (USD Million)
- Figure 10.19 Biopreservation Media Providers Market for Research and Development, Till 2035 (USD Million)
- Figure 10.20 Biopreservation Media Providers Market for Therapeutic Use, Till 2035 (USD Million)
- Figure 10.21 Biopreservation Media Providers Market: Distribution by Type of Packaging Format
- Figure 10.22 Biopreservation Media Providers Market for Bags, Till 2035 (USD Million)
- Figure 10.23 Biopreservation Media Providers Market for Bottles, Till 2035 (USD Million)
- Figure 10.24 Biopreservation Media Providers Market for Vials, Till 2035 (USD Million)
- Figure 10.25 Biopreservation Media Providers Market for Others, Till 2035 (USD Million)
- Figure 10.26 Biopreservation Media Providers Market: Distribution by End Users
- Figure 10.27 Biopreservation Media Providers Market for Academic and Research Institutes, Till 2035 (USD Million)
- Figure 10.28 Biopreservation Media Providers Market for Biobanks / Genebanks, Till 2035 (USD Million)
- Figure 10.29 Biopreservation Media Providers Market for Hospitals, Till 2035 (USD Million)
- Figure 10.30 Biopreservation Media Providers Market for Pharmaceutical and Biotechnology Companies, Till 2035 (USD Million)
- Figure 10.31 Biopreservation Media Providers Market for Other End Users, Till 2035 (USD Million)
- Figure 10.32 Biopreservation Media Providers Market: Distribution by Region
- Figure 10.33 Biopreservation Media Providers Market in North America, Till 2035 (USD Million)
- Figure 10.34 Biopreservation Media Providers Market in Europe, Till 2035 (USD Million)
- Figure 10.35 Biopreservation Media Providers Market in Asia, Till 2035 (USD Million)
- Figure 10.36 Biopreservation Media Providers Market in MENA, Till 2035 (USD Million)
- Figure 10.37 Biopreservation Media Providers Market in Latin America, Till 2035 (USD Million)
- Figure 10.38 Biopreservation Media Providers Market in Rest of the World, Till 2035 (USD Million)
- Figure 10.39 Biopreservation Media Providers Market, Conservative, Base and Optimistic Scenarios (USD Million)
- Figure 11.1 Concluding Remarks: Current Market Landscape
- Figure 11.2 Concluding Remarks: Company Competitiveness Analysis
- Figure 11.3 Concluding Remarks: Partnerships and Collaborations
- Figure 11.4 Concluding Remarks: Market Sizing and Opportunity Analysis
目次
GLOBAL BIOPRESERVATION MARKET: OVERVIEW
As per Roots Analysis, the biopreservation market is estimated to grow from USD 1.9 billion in the current year to USD 15.5 billion by 2035, at a CAGR of 23.6% during the forecast period, till 2035.
The market sizing and opportunity analysis has been segmented across the following parameters:
Preservation Condition
- Refrigerated
- Frozen / Cold Chain
- Frozen (Ultra-low) / DeeAp Frozen
- Cryogenic / LN2 Vapor Phase Storage
Type of Serum
- Fetal Bovine Serum Containing Media
- Fetal Calf Serum Containing Media
- Human Serum Containing Media
- Serum Free Media
Type of Biological Sample
- Germline Cells / Stem Cells
- Organs
- Somatic Cells
- Tissues
Area of Application
- Diagnostic Use
- Research and Development
- Therapeutic Use
Type of Packaging Format
- Bags
- Bottles
- Vials
- Others
End Users
- Academic and Research Institutes
- Biobanks / Genebanks
- Hospitals
- Pharmaceutical and Biotechnology Companies
- Other End Users
Geographical Region
- North America
- Europe
- Asia
- Middle East and North Africa
- Latin America
- Rest of the World
GLOBAL BIOPRESERVATION MARKET: GROWTH AND TRENDS
In recent years, there has been a noticeable increase in the development of cell-based products, driven by the rising demand for effective therapeutic solutions. However, these products are highly sensitive to temperature fluctuations and often require freezing or cryogenic conditions for safe transport and storage. According to a study by the USFDA, over 80% of submissions for mesenchymal cell-based therapies indicated a need for cryopreservation. This highlights the urgent need for advanced preservation strategies that can safeguard both genomic and proteomic integrity, while minimizing stress-induced genetic selection (an aspect where most current preservation methods fall short).
Biopreservation is the exclusive biological approach designated for the preservation of cells, tissues and organs ex-vivo for the purpose of storage, shipment and transportation. Further, biopreservation offers solutions to various product-related challenges by integrating engineering concepts with breakthroughs in cellular and molecular biology. Consequently, industry stakeholders are increasingly turning to pre-formulated, commercially available biopreservation media. Biopreservation media is one of the most crucial entities in conferring effectiveness in preservation of biological samples. The selection of the type of media depends upon the considerable time duration desired for the storage, type of biological material to be preserved and the purpose of biopreservation. Currently, various companies are engaged in providing 190 biopreservation and biobanking solutions designed for the storage and preservation of various types of biological samples.
GLOBAL BIOPRESERVATION MARKET: KEY INSIGHTS
The report delves into the current state of global biopreservation market and identifies potential growth opportunities within industry. Some key findings from the report include:
- Globally, over 60 companies provide biopreservation media, intended for the preservation of biological samples at different preservation conditions.
- Biopreservation media is available in different packaging formats that are compatible with a variety of biological samples.
- Amongst the biopreservation media intended for preservation of somatic cells, nearly 45% are serum free; of these, majority are being used for storage at cryogenic conditions.
- Largely, the biopreservation media support preservation at cryogenic conditions (~90%), prominent examples include C80EZ 2X, C80EZ Standard Medium, C80EZ-Neuron, and C80EZ-TISSUE.
- Prominent examples of companies offering media in multiple packaging formats include Akron Biotech, BioLife Solutions, Fujifilm, Protide Pharmaceuticals, and ScienCell Research Laboratories.
- In order to build a competitive advantage, companies are focused on steadily improving the characteristics of their media offerings.
- The growing interest of stakeholders is also evident from the rise in partnership activity; a relatively larger proportion of the deals were signed by companies based in the US.
- Both established players and new entrants have signed several partnerships in the recent past; most of the companies (~45%) are actively signing manufacturing and supply agreements.
- Industry players have emerged as preferred choice of partner for companies of variable employee strength; however, in mid-to-long term, we expect firms to ink agreements with renowned academic institutes as well.
- Cost is a key determinant of the acceptance and adoption of such biopreservation media; pricing strategy matrix is likely to assist players in evaluating the competitive market prices for their offerings.
- Driven by the rising approval of temperature sensitive products, the market for biopreservation media providers is poised to grow at an annualized rate of over 23.6%, till 2035.
- The projected market opportunity is likely to be well distributed across different end users, biological samples, packaging formats and key geographical regions.
Example Players in the Biopreservation Market
- BioLife Solutions
- Cell Applications
- HiMedia Laboratories
- Merck
- Thermo Fisher Scientific
- United States Biological
- ZenBio
GLOBAL BIOPRESERVATION MARKET: RESEARCH COVERAGE
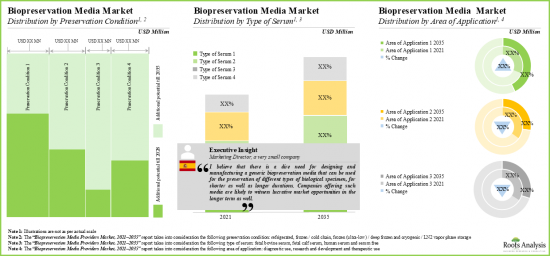
- Market Sizing and Opportunity Analysis: The report features an in-depth analysis of the global biopreservation market, focusing on key market segments, including [A] preservation condition, [B] type of serum, [C] type of biological sample, [D] area of application, [E] type of packaging format, [F] end users and [E] geographical regions.
- Market Landscape: A comprehensive evaluation of the current biopreservation media providers' landscape, considering various parameters, such as [A] year of establishment, [B] company size, [C] type of company and [D] location of headquarters. Additionally, a comprehensive evaluation of biopreservation media based on several relevant parameters, such as [A] preservation condition, [B] type of serum, [C] type of biological sample, [D] area of application, [E] type of packaging format, [F] packaging volume and [G] product price.
- Key Insights: In-depth analysis of market trends, focusing on location of headquarters and leading players engaged in offering biopreservation media based on the parameters, such as [A] year of establishment, [B] company size, [C] number of biopreservation media offered and [D] region. Further, an insightful representation of biopreservation media, distributed based on [A] preservation condition and [B] area of application, a grid representation illustrating the distribution of biopreservation media based on [A] company size, [B] region, preservation condition, [C] type of serum and type of biological sample, and a heat map representation of biopreservation media, distributed on the basis of [A] minimum packaging volume and [B] minimum price.
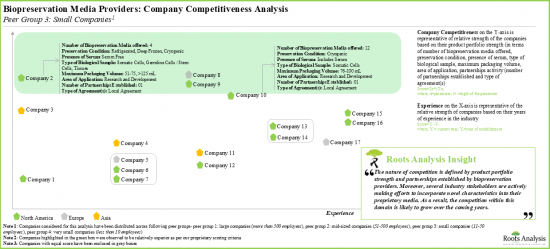
- Company Competitiveness Analysis: A comprehensive competitive analysis of biopreservation media providers, examining factors, such as [A] years of experience, [B] product portfolio strength and [C] partnership activity.
- Company Profiles: In-depth profiles of companies engaged in this domain, focusing on [A] company overview, and [B] recent developments and an informed future outlook.
- Partnerships and Collaborations: An insightful analysis of the deals inked by stakeholders in the biopreservation market, based on several parameters, such as [A] year of partnership, [B] type of partnership, [C] type of partner, [D] most active players (in terms of the number of partnerships signed) and [E] geography.
- Bowman Clock Pricing Strategy: In-depth analysis of a framework to understand the pricing strategy of the biopreservation media provided by the company along with its competitive position.
KEY QUESTIONS ANSWERED IN THIS REPORT
- How many companies are currently engaged in this market?
- Which are the leading companies in this market?
- What factors are likely to influence the evolution of this market?
- What is the current and future market size?
- What is the CAGR of this market?
- How is the current and future market opportunity likely to be distributed across key market segments?
REASONS TO BUY THIS REPORT
- The report provides a comprehensive market analysis, offering detailed revenue projections of the overall market and its specific sub-segments. This information is valuable to both established market leaders and emerging entrants.
- Stakeholders can leverage the report to gain a deeper understanding of the competitive dynamics within the market. By analyzing the competitive landscape, businesses can make informed decisions to optimize their market positioning and develop effective go-to-market strategies.
- The report offers stakeholders a comprehensive overview of the market, including key drivers, barriers, opportunities, and challenges. This information empowers stakeholders to stay abreast of market trends and make data-driven decisions to capitalize on growth prospects.
ADDITIONAL BENEFITS
- Complimentary PPT Insights Packs
- Complimentary Excel Data Packs for all Analytical Modules in the Report
- 15% Free Content Customization
- Detailed Report Walkthrough Session with Research Team
- Free Updated report if the report is 6-12 months old or older
TABLE OF CONTENTS
1. PREFACE
- 1.1. Scope of the Report
- 1.2. Research Methodology
- 1.2.1. Research Assumptions
- 1.2.2. Project Methodology
- 1.2.3. Forecast Methodology
- 1.2.4. Robust Quality Control
- 1.2.5. Key Considerations
- 1.2.5.1. Demographics
- 1.2.5.2. Economic Factors
- 1.2.5.3. Government Regulations
- 1.2.5.4. Supply Chain
- 1.2.5.5. COVID Impact / Related Factors
- 1.2.5.6. Market Access
- 1.2.5.7. Healthcare Policies
- 1.2.5.8. Industry Consolidation
- 1.3 Key Questions Answered
- 1.4. Chapter Outlines
2. EXECUTIVE SUMMARY
- 2.1. Chapter Overview
3. INTRODUCTION
- 3.1. Chapter Overview
- 3.2. Introduction to Biopreservation
- 3.3. Type of Biopreservation
- 3.3.1. Hypothermic Preservation
- 3.3.2. Cryopreservation
- 3.4. Applications of Biopreservation Media
- 3.5. Benefits and Limitations of Biopreservation Media
- 3.6. Concluding Remarks
4. MARKET LANDSCAPE
- 4.1. Chapter Overview
- 4.2. Biopreservation Media Providers: Service Providers Landscape
- 4.2.1. Analysis by Year of Establishment
- 4.2.2. Analysis by Company Size
- 4.2.3. Analysis by Type of Company
- 4.2.4. Analysis by Location of Headquarters
- 4.3. Biopreservation Media: Market Landscape
- 4.3.1. Analysis by Preservation Condition
- 4.3.2. Analysis by Type of Serum
- 4.3.3. Analysis by Type of Biological Sample
- 4.3.4. Analysis by Area of Application
- 4.3.5. Analysis by Type of Packaging Format
- 4.3.6. Analysis by Packaging Volume
- 4.3.7. Analysis by Product Price
5. KEY INSIGHTS
- 5.1. Chapter Overview
- 5.2. Analysis by Location of Headquarters (World Map Representation)
- 5.3. Analysis by Year of Establishment, Company Size, Number of Biopreservation Media Offered and Region (4D Bubble Chart)
- 5.4. Analysis by Preservation Condition and Area of Application (Treemap Representation)
- 5.5. Analysis by Company Size, Region, Preservation Condition, Type of Serum and Type of Biological Sample (Grid Representation)
- 5.6. Analysis by Minimum Packaging Volume and Minimum Price (Heat Map Representation)
6. COMPANY COMPETITIVENESS
- 6.1. Chapter Overview
- 6.2. Assumptions and Key Parameters
- 6.3. Methodology
- 6.4. Benchmarking of Product Portfolio Strength
- 6.5. Benchmarking of Partnership Activity
- 6.6. Biopreservation Media Providers: Company Competitiveness Analysis
- 6.6.1. Company Competitiveness Analysis: Very Small Companies
- 6.6.2. Company Competitiveness Analysis: Small Companies
- 6.6.3. Company Competitiveness Analysis: Mid-Sized Companies
- 6.6.4. Company Competitiveness Analysis: Large Companies
7. COMPANY PROFILES
- 7.1. Chapter Overview
- 7.2. BioLife Solutions
- 7.2.1. Company Overview
- 7.2.2. Recent Developments and Future Outlook
- 7.3. Cell Applications
- 7.3.1. Company Overview
- 7.3.2. Recent Developments and Future Outlook
- 7.4. HiMedia Laboratories
- 7.4.1. Company Overview
- 7.4.2. Recent Developments and Future Outlook
- 7.5. Merck
- 7.5.1. Company Overview
- 7.5.2. Recent Developments and Future Outlook
- 7.6. Thermo Fischer Scientific
- 7.6.1. Company Overview
- 7.6.2. Recent Developments and Future Outlook
- 7.7. United States Biological
- 7.7.1. Company Overview
- 7.7.2. Recent Developments and Future Outlook
- 7.8. ZenBio
- 7.8.1. Company Overview
- 7.8.2. Recent Developments and Future Outlook
8. PARTNERSHIPS AND COLLABORATIONS
- 8.1. Chapter Overview
- 8.2. Partnership Models
- 8.3. Biopreservation Media Providers: Partnerships and Collaborations
- 8.3.1. Analysis by Year of Partnership
- 8.3.2. Analysis by Type of Partnership
- 8.3.2.1. Analysis by Year and Type of Partnership
- 8.3.2.2. Analysis by Type of Partnership and Company Size
- 8.3.3. Analysis by Type of Partner
- 8.3.3.1. Analysis by Year of Partnership and Type of Partner
- 8.3.3.2. Analysis by Type of Partner and Type of Partnership
- 8.3.3.3. Analysis by Type of Partner and Company Size
- 8.3.4. Most Active Players: Analysis by Number of Partnerships
- 8.3.5. Regional Analysis
- 8.3.5.1. Local and International Deals
- 8.3.5.2. Intercontinental and Intracontinental Deals
- 8.3.5.3. Analysis by Location of Headquarters of Partner
- 8.3.5.4. Analysis by Location of Headquarters of Partner and Type of Partnership
9. BOWMAN CLOCK PRICING STRATEGY
- 9.1. Chapter Overview
- 9.2. Bowman Strategy Clock
- 9.2.1. Two Dimensions of Bowman Strategy Clock
- 9.2.2. Eight Positions on Bowman Strategy Clock
- 9.3. Roots Analysis Framework
- 9.3.1. Methodology
- 9.3.2. Theoretical Framework and Price Evaluation Hypothesis
- 9.3.3. Results and Interpretation
- 9.3.3.1. Product Price Evaluation Matrix: Information on Preservation Condition
- 9.3.3.2. Product Price Evaluation Matrix: Information on Type of Serum
- 9.3.3.3. Product Price Evaluation Matrix: Information on Type of Biological Sample
- 9.3.3.4. Product Price Evaluation Matrix: Information on Minimum Packaging Volume
- 9.3.3.5. Product Price Evaluation Matrix: Information on Maximum Packaging Volume
- 9.3.3.6. Product Price Evaluation Matrix: Information on Packaging Format
- 9.3.3.7. Product Price Evaluation Matrix: Information on Area of Application
- 9.3.4. Concluding Remarks
10. MARKET SIZING AND OPPORTUNITY ANALYSIS
- 10.1. Chapter Overview
- 10.2. Forecast Methodology and Key Assumptions
- 10.3. Biopreservation Media Providers Market, Till 2035
- 10.4. Biopreservation Media Providers Market: Distribution by Preservation Condition
- 10.4.1. Biopreservation Media Providers Market for Cryogenic / LN2 Vapor Phase, Till 2035
- 10.4.2. Biopreservation Media Providers Market for Frozen (Ultra-low) / Deep Frozen, Till 2035
- 10.4.3. Biopreservation Media Providers Market for Frozen / Cold Chain, Till 2035
- 10.4.4. Biopreservation Media Providers Market for Refrigerated, Till 2035
- 10.5. Biopreservation Media Providers Market: Distribution by Type of Serum
- 10.5.1. Biopreservation Media Providers Market for Fetal Bovine Serum Containing Media, Till 2035
- 10.5.2. Biopreservation Media Providers Market for Fetal Calf Serum Containing Media, Till 2035
- 10.5.3. Biopreservation Media Providers Market for Human Serum Containing Media, Till 2035
- 10.5.4. Biopreservation Media Providers Market for Serum Free Media, Till 2035
- 10.6. Biopreservation Media Providers Market: Distribution by Type of Biological Sample
- 10.6.1. Biopreservation Media Providers Market for Germline Cells / Stem Cells, Till 2035
- 10.6.2. Biopreservation Media Providers Market for Organs, Till 2035
- 10.6.3. Biopreservation Media Providers Market for Somatic Cells, Till 2035
- 10.6.4. Biopreservation Media Providers Market for Tissues, Till 2035
- 10.7. Biopreservation Media Providers Market: Distribution by Area of Application
- 10.7.1. Biopreservation Media Providers Market for Diagnostic Use, Till 2035
- 10.7.2. Biopreservation Media Providers Market for Research and Development, Till 2035
- 10.7.3. Biopreservation Media Providers Market for Therapeutic Use, Till 2035
- 10.8. Biopreservation Media Providers Market: Distribution by Type of Packaging Format
- 10.8.1. Biopreservation Media Providers Market for Bags, Till 2035
- 10.8.2. Biopreservation Media Providers Market for Bottles, Till 2035
- 10.8.3. Biopreservation Media Providers Market for Vials, Till 2035
- 10.8.4. Biopreservation Media Providers Market for Others, Till 2035
- 10.9. Biopreservation Media Providers Market: Distribution by End Users
- 10.9.1. Biopreservation Media Providers Market for Academic and Research Institutes, Till 2035
- 10.9.2. Biopreservation Media Providers Market for Biobanks / Genebanks, Till 2035
- 10.9.3. Biopreservation Media Providers Market for Hospitals, Till 2035
- 10.9.4. Biopreservation Media Providers Market for Pharmaceutical and Biotechnology Companies, Till 2035
- 10.9.5. Biopreservation Media Providers Market for Other End Users, Till 2035
- 10.10. Biopreservation Media Providers Market: Distribution by Region
- 10.10.1. Biopreservation Media Providers Market in North America, Till 2035
- 10.10.2. Biopreservation Media Providers Market in Europe, Till 2035
- 10.10.3. Biopreservation Media Providers Market in Asia, Till 2035
- 10.10.4. Biopreservation Media Providers Market in MENA, Till 2035
- 10.10.5. Biopreservation Media Providers Market in Latin America, Till 2035
- 10.10.6. Biopreservation Media Providers Market in Rest of the World, Till 2035
- 10.11. Concluding Remarks
11. CONCLUSION
- 11.1. Chapter Overview
12. EXECUTIVE INSIGHTS
- 12.1. Chapter Overview
- 12.2. Company A
- 12.2.1. Company Snapshot
- 12.2.2. Interview Transcript: Marketing Director
13. APPENDIX I: TABULATED DATA
14. APPENDIX II: LIST OF COMPANIES AND ORGANIZATION
- 発行日
- 発行
- Roots Analysis
- ページ情報
- 英文 197 Pages
- 納期
- 7~10営業日


