
検索拡張生成 (RAG) 市場 (~2035年):機能タイプ・応用分野・展開・技術・エンドユーザー・企業規模・地域別の分布・産業動向・世界の予測
Retrieval-Augmented Generation (RAG) Market Till 2035: Distribution by Type of Function, Areas of Application, Types of Deployment, Type of Technology, Type of End-Users, Company Size, and Key Geographical Regions: Industry Trends and Global Forecasts- 発行日
- ページ情報
- 英文 188 Pages
- 納期
- 7~10営業日
- 商品コード
- 1752098
- カスタマイズ可能 お客様のご希望に応じて、既存データの加工や未掲載情報(例:国別セグメント)の追加などの対応が可能です。詳細はお問い合わせください。
- 翻訳ツール提供対象 PDF対応AI翻訳ツールの無料貸し出しサービスのご利用が可能です
- 医薬品関連専門 医薬品関連専門を専門とする市場調査会社です。
概要
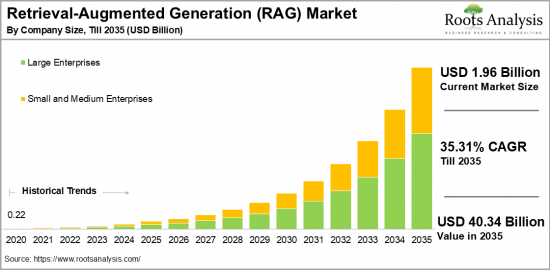
世界の検索拡張生成 (RAG) の市場規模は、2035年までの予測期間中に35.31%のCAGRで推移し、現在の19億6,000万米ドルから、2035年には403億4,000万米ドルに成長すると予測されています。
検索拡張生成 (RAG) の市場機会:セグメント別
機能別
- 文書検索
- レコメンデーションエンジン
- レスポンス生成
- 要約とレポーティング
応用分野別
- コンテンツ生成
- カスタマーサポート&チャットボット
- ナレッジマネジメント
- 法務・コンプライアンス
- マーケティング&セールス
- 研究開発
展開モード別
- クラウド
- オンプレミス
技術別
- ディープラーニング
- ナレッジグラフ
- 機械学習
- 自然言語処理 (NLP)
- 意味検索
- センチメント分析アルゴリズム
エンドユーザー別
- 教育
- 金融サービス
- ヘルスケア
- IT・通信
- メディア&エンターテイメント
- 小売&eコマース
- その他
企業規模別
- 大企業
- 中小企業
地域別
- 北米
- 米国
- カナダ
- メキシコ
- その他の北米諸国
- 欧州
- オーストリア
- ベルギー
- デンマーク
- フランス
- ドイツ
- アイルランド
- イタリア
- オランダ
- ノルウェー
- ロシア
- スペイン
- スウェーデン
- スイス
- 英国
- その他の欧州諸国
- アジア
- 中国
- インド
- 日本
- シンガポール
- 韓国
- その他のアジア諸国
- ラテンアメリカ
- ブラジル
- チリ
- コロンビア
- ベネズエラ
- その他のラテンアメリカ諸国
- 中東・北アフリカ
- エジプト
- イラン
- イラク
- イスラエル
- クウェート
- サウジアラビア
- アラブ首長国連邦
- その他のMENA諸国
- 世界のその他の地域
- オーストラリア
- ニュージーランド
- その他の国
検索拡張生成 (RAG) 市場:成長と動向
検索拡張生成 (RAG) は、外部データソースを活用することで、生成AIの能力を向上させ、より正確かつ文脈に即した出力を実現する最先端の手法です。この技術は、情報検索と自然言語生成の利点を組み合わせることで、単にテキストを生成するだけでなく、さまざまなデータベースからリアルタイムの情報にアクセスし、生成されるコンテンツを強化・補完することが可能となります。
RAGシステムは、企業が独自のデータベースから情報を抽出・生成する際に重要な役割を果たしており、専門職が即座にデータに基づく意思決定を行えるよう支援します。多くの組織が、カスタマーエクスペリエンスの向上や内部業務の効率化のため、チャットボット、バーチャルアシスタント、ナレッジマネジメントシステムといったアプリケーションへのRAG技術の組み込みに投資を進めています。さらに、クラウドベースのAIプラットフォームの登場によって、RAGソリューションの部門横断的な拡張性が高まりつつあります。
その結果、専門的なデータセットの可用性と品質の上昇を背景に、特定のニーズに対応するためにこれらのモデルを採用する企業が増えています。RAGは意思決定プロセスやコンテンツ配信を大きく向上させ、さまざまな業界においてその影響力を強めており、今後の市場成長を促進する要因となっています。
当レポートでは、世界の検索拡張生成 (RAG) の市場を調査し、 市場概要、背景、市場影響因子の分析、市場規模の推移・予測、各種区分・地域別の詳細分析、競合情勢、主要企業のプロファイルなどをまとめています。
目次
セクションI:レポート概要
第1章 序文
第2章 調査手法
第3章 市場力学
第4章 マクロ経済指標
セクションII:定性的洞察
第5章 エグゼクティブサマリー
第6章 イントロダクション
第7章 規制シナリオ
セクションIII:市場概要
第8章 主要企業の包括的データベース
第9章 競合情勢
第10章 ホワイトスペース分析
第11章 企業の競争力分析
第12章 検索拡張生成 (RAG) 市場におけるスタートアップエコシステム
セクションIV:企業プロファイル
第13章 企業プロファイル
- Amazon Web Services*
- Anthropic
- Clarifai
- Cohere
- Databricks
- Google DeepMind
- Hugging Face
- IBM
- Informatica
- Meta Platforms
- Microsoft
- Neeva
- NVIDIA
- OpenAI
- Semantic Scholar
セクションV:市場動向
第14章 メガトレンド分析
第15章 アンメットニーズ分析
第16章 特許分析
第17章 最近の動向
セクションVI:市場機会分析
第18章 世界の検索拡張生成 (RAG) 市場
第19章 機能別の市場機会
第20章 応用分野別の市場機会
第21章 展開別の市場機会
第22章 技術タイプ別の市場機会
第23章 エンドユーザー別の市場機会
第24章 北米におけるRAGの市場機会
第25章 欧州におけるRAGの市場機会
第26章 アジアにおけるRAGの市場機会
第27章 中東および北アフリカにおけるRAGの市場機会
第28章 ラテンアメリカにおけるRAGの市場機会
第29章 世界のその他の地域におけるRAGの市場機会
第30章 市場集中分析:主要企業別分布
第31章 隣接市場分析
セクションVII:戦略ツール
第32章 勝利の鍵となる戦略
第33章 ポーターのファイブフォース分析
第34章 SWOT分析
第35章 バリューチェーン分析
第36章 ROOTSによる戦略提言
セクションVIII:その他の独占的洞察
第37章 1次調査からの洞察
第38章 総論
セクションIX:付録
第39章 表形式データ
第40章 企業・団体一覧
第41章 カスタマイズの機会
第42章 ROOTSサブスクリプションサービス
第43章 著者詳細
目次
Retrieval-Augmented Generation Market Overview
As per Roots Analysis, the global retrieval-augmented generation market size is estimated to grow from USD 1.96 billion in the current year to USD 40.34 billion by 2035, at a CAGR of 35.31% during the forecast period, till 2035.
The opportunity for retrieval-augmented generation market has been distributed across the following segments:
Type of Function
- Document Retrieval
- Recommendation Engines
- Response Generation
- Summarization & Reporting
Areas of Application
- Content Generation
- Customer Support & Chatbots
- Knowledge Management
- Legal & Compliance
- Marketing & Sales
- Research & Development
Type of Deployment
- Cloud
- On-Premises
Type of Technology
- Deep Learning
- Knowledge Graphs
- Machine Learning
- Natural Language Processing (NLP)
- Semantic Search
- Sentiment Analysis Algorithms
Type of End-Users
- Education
- Financial Services
- Healthcare
- IT & Telecommunications
- Media & Entertainment
- Retail & E-Commerce
- Others
Company Size
- Large Enterprises
- Small and Medium Enterprises
Geographical Regions
- North America
- US
- Canada
- Mexico
- Other North American countries
- Europe
- Austria
- Belgium
- Denmark
- France
- Germany
- Ireland
- Italy
- Netherlands
- Norway
- Russia
- Spain
- Sweden
- Switzerland
- UK
- Other European countries
- Asia
- China
- India
- Japan
- Singapore
- South Korea
- Other Asian countries
- Latin America
- Brazil
- Chile
- Colombia
- Venezuela
- Other Latin American countries
- Middle East and North Africa
- Egypt
- Iran
- Iraq
- Israel
- Kuwait
- Saudi Arabia
- UAE
- Other MENA countries
- Rest of the World
- Australia
- New Zealand
- Other countries
RETRIEVAL-AUGMENTED GENERATION MARKET: GROWTH AND TRENDS
Retrieval-augmented generation (RAG) represents a cutting-edge method that boosts the capabilities of generative AI by incorporating external data sources, resulting in outputs that are more accurate and contextually relevant. This technology combines the advantages of information retrieval and natural language generation, enabling systems to not only create text but also access real-time information from various databases to enhance and support the content produced.
RAG systems are becoming crucial for extracting and generating information from proprietary databases, allowing professionals to make data-driven decisions instantly. Organizations are channeling investments into these technologies to improve customer experience and streamline internal operations by embedding them in applications such as chatbots, virtual assistants, and knowledge management systems. The emergence of cloud-based AI platforms further promotes the scalability of RAG solutions across different departments.
As a result, companies are increasingly adopting these models to address specific needs, backed by the rising availability and quality of specialized datasets. The effects of RAG are substantial, markedly enhancing decision-making processes and content distribution across various sectors, thereby propelling the growth of retrieval-augmented generation market during the forecast period.
RETRIEVAL-AUGMENTED GENERATION MARKET: KEY SEGMENTS
Market Share by Type of Function
Based on type of function, the global retrieval-augmented generation market is segmented into document retrieval, recommendation engines, response generation and summarization & reporting. According to our estimates, currently, document retrieval segment captures the majority share of the market. This can be attributed to its crucial role in providing accurate and contextually relevant information from large data repositories. Industries like legal, healthcare, and finance heavily rely on these systems to quickly access specific documents and information, a task that traditional AI models frequently struggle to perform efficiently.
However, recommendation engines segment is anticipated to grow at a relatively higher CAGR during the forecast period, driven by the rising demand for personalized user experiences in sectors such as e-commerce, entertainment, and online services.
Market Share by Areas of Application
Based on areas of application, the retrieval-augmented generation market is segmented into content generation, customer support & chatbots, knowledge management, legal & compliance, marketing & sales, research & development. According to our estimates, currently, content generation segment captures the majority of the market. This can be attributed to its capability to generate high-quality and contextually relevant content by utilizing retrieval techniques. This capability is vital for sectors like marketing, media, and education, where timely and pertinent content is critical.
However, customer support sector is anticipated to grow at a relatively higher CAGR during the forecast period. This increase can be ascribed to the demand for more sophisticated, real-time interactions with customers. RAG-augmented chatbots have the ability to extract specific, relevant information from databases, allowing them to deliver more precise responses compared to traditional AI solutions.
Market Share by Type of Deployment
Based on type of deployment, the retrieval-augmented generation market is segmented into cloud and on-premises. According to our estimates, currently, cloud segment captures the majority share of the market. This can be attributed to the ability of cloud deployment to provide scalability, flexibility, and cost savings, allowing businesses to implement RAG solutions swiftly and effectively. However, on-premises segment is anticipated to grow at a relatively higher CAGR during the forecast period.
Market Share by Type of Technology
Based on type of technology, the retrieval-augmented generation market is segmented into deep learning, knowledge graphs, machine learning, natural language processing (NLP), semantic search, and sentiment analysis algorithms. According to our estimates, currently, natural language processing (NLP) segment captures the majority share of the market. This can be attributed to its essential role in enabling machines to comprehend and produce human language efficiently.
However, the deep learning segment is expected to experience a higher compound annual growth rate (CAGR) during the forecast period. This growth is linked to its superior ability to process extensive datasets and enhance model precision.
Market Share by Type of End User
Based on type of end user, the retrieval-augmented generation market is segmented into education, financial services, healthcare, IT & telecommunications, media & entertainment, retail & e-commerce, and others. According to our estimates, currently, healthcare segment captures the majority share of the market. This can be attributed to the industry's demand for accurate, real-time access to large volumes of medical data, research papers, patient records, and clinical guidelines. However, retail and e-commerce sector is expected to experience a higher compound annual growth rate (CAGR) during the forecast period. This surge is linked to the growing need for tailored shopping experiences and adaptive content recommendations.
Market Share by Company Size
Based on company size, the retrieval-augmented generation market is segmented into large and small and medium enterprise. According to our estimates, currently, large enterprises segment captures the majority share of the market. However, small and medium enterprise segments is expected to experience a higher compound annual growth rate (CAGR) during the forecast period. This can be attributed to their agility, innovation, focus on specialized markets, and their capacity to adapt to evolving customer preferences and market dynamics.
Market Share by Geographical Regions
Based on geographical regions, the retrieval-augmented generation market is segmented into North America, Europe, Asia, Latin America, Middle East and North Africa, and the rest of the world. According to our estimates, currently, North America captures the majority share of the market. This can be attributed to the rising adoption of AI-driven technologies and the ongoing research and development of RAG models that prioritize ethical and transparent AI practices.
Example Players in Retrieval-Augmented Generation Market
- Amazon Web Services
- Anthropic
- Clarifai
- Cohere
- Databricks
- Google DeepMind
- Hugging Face
- IBM
- Informatica
- Meta Platforms
- Microsoft
- Neeva
- NVIDIA
- OpenAI
- Semantic Scholar
RETRIEVAL-AUGMENTED GENERATION MARKET: RESEARCH COVERAGE
The report on the retrieval-augmented generation market features insights on various sections, including:
- Market Sizing and Opportunity Analysis: An in-depth analysis of the retrieval-augmented generation market, focusing on key market segments, including [A] type of function, [B] areas of application, [C] types of deployment, [D] type of technology, [E] type of end-users, [F] company size, and [G] key geographical regions.
- Competitive Landscape: A comprehensive analysis of the companies engaged in the retrieval-augmented generation market, based on several relevant parameters, such as [A] year of establishment, [B] company size, [C] location of headquarters and [D] ownership structure.
- Company Profiles: Elaborate profiles of prominent players engaged in the retrieval-augmented generation market, providing details on [A] location of headquarters, [B]company size, [C] company mission, [D] company footprint, [E] management team, [F] contact details, [G] financial information, [H] operating business segments, [I] service / product portfolio, [J] moat analysis, [K] recent developments, and an informed future outlook.
- Megatrends: An evaluation of ongoing megatrends in retrieval-augmented generation industry.
- Patent Analysis: An insightful analysis of patents filed / granted in the retrieval-augmented generation domain, based on relevant parameters, including [A] type of patent, [B] patent publication year, [C] patent age and [D] leading players.
- Recent Developments: An overview of the recent developments made in the retrieval-augmented generation market, along with analysis based on relevant parameters, including [A] year of initiative, [B] type of initiative, [C] geographical distribution and [D] most active players.
- Porter's Five Forces Analysis: An analysis of five competitive forces prevailing in the retrieval-augmented generation market, including threats of new entrants, bargaining power of buyers, bargaining power of suppliers, threats of substitute products and rivalry among existing competitors.
- SWOT Analysis: An insightful SWOT framework, highlighting the strengths, weaknesses, opportunities and threats in the domain. Additionally, it provides Harvey ball analysis, highlighting the relative impact of each SWOT parameter.
KEY QUESTIONS ANSWERED IN THIS REPORT
- How many companies are currently engaged in retrieval-augmented generation market?
- Which are the leading companies in this market?
- What factors are likely to influence the evolution of this market?
- What is the current and future market size?
- What is the CAGR of this market?
- How is the current and future market opportunity likely to be distributed across key market segments?
REASONS TO BUY THIS REPORT
- The report provides a comprehensive market analysis, offering detailed revenue projections of the overall market and its specific sub-segments. This information is valuable to both established market leaders and emerging entrants.
- Stakeholders can leverage the report to gain a deeper understanding of the competitive dynamics within the market. By analyzing the competitive landscape, businesses can make informed decisions to optimize their market positioning and develop effective go-to-market strategies.
- The report offers stakeholders a comprehensive overview of the market, including key drivers, barriers, opportunities, and challenges. This information empowers stakeholders to stay abreast of market trends and make data-driven decisions to capitalize on growth prospects.
ADDITIONAL BENEFITS
- Complimentary Excel Data Packs for all Analytical Modules in the Report
- 15% Free Content Customization
- Detailed Report Walkthrough Session with Research Team
- Free Updated report if the report is 6-12 months old or older
TABLE OF CONTENTS
SECTION I: REPORT OVERVIEW
1. PREFACE
- 1.1. Introduction
- 1.2. Market Share Insights
- 1.3. Key Market Insights
- 1.4. Report Coverage
- 1.5. Key Questions Answered
- 1.6. Chapter Outlines
2. RESEARCH METHODOLOGY
- 2.1. Chapter Overview
- 2.2. Research Assumptions
- 2.3. Database Building
- 2.3.1. Data Collection
- 2.3.2. Data Validation
- 2.3.3. Data Analysis
- 2.4. Project Methodology
- 2.4.1. Secondary Research
- 2.4.1.1. Annual Reports
- 2.4.1.2. Academic Research Papers
- 2.4.1.3. Company Websites
- 2.4.1.4. Investor Presentations
- 2.4.1.5. Regulatory Filings
- 2.4.1.6. White Papers
- 2.4.1.7. Industry Publications
- 2.4.1.8. Conferences and Seminars
- 2.4.1.9. Government Portals
- 2.4.1.10. Media and Press Releases
- 2.4.1.11. Newsletters
- 2.4.1.12. Industry Databases
- 2.4.1.13. Roots Proprietary Databases
- 2.4.1.14. Paid Databases and Sources
- 2.4.1.15. Social Media Portals
- 2.4.1.16. Other Secondary Sources
- 2.4.2. Primary Research
- 2.4.2.1. Introduction
- 2.4.2.2. Types
- 2.4.2.2.1. Qualitative
- 2.4.2.2.2. Quantitative
- 2.4.2.3. Advantages
- 2.4.2.4. Techniques
- 2.4.2.4.1. Interviews
- 2.4.2.4.2. Surveys
- 2.4.2.4.3. Focus Groups
- 2.4.2.4.4. Observational Research
- 2.4.2.4.5. Social Media Interactions
- 2.4.2.5. Stakeholders
- 2.4.2.5.1. Company Executives (CXOs)
- 2.4.2.5.2. Board of Directors
- 2.4.2.5.3. Company Presidents and Vice Presidents
- 2.4.2.5.4. Key Opinion Leaders
- 2.4.2.5.5. Research and Development Heads
- 2.4.2.5.6. Technical Experts
- 2.4.2.5.7. Subject Matter Experts
- 2.4.2.5.8. Scientists
- 2.4.2.5.9. Doctors and Other Healthcare Providers
- 2.4.2.6. Ethics and Integrity
- 2.4.2.6.1. Research Ethics
- 2.4.2.6.2. Data Integrity
- 2.4.3. Analytical Tools and Databases
- 2.4.1. Secondary Research
3. MARKET DYNAMICS
- 3.1. Forecast Methodology
- 3.1.1. Top-Down Approach
- 3.1.2. Bottom-Up Approach
- 3.1.3. Hybrid Approach
- 3.2. Market Assessment Framework
- 3.2.1. Total Addressable Market (TAM)
- 3.2.2. Serviceable Addressable Market (SAM)
- 3.2.3. Serviceable Obtainable Market (SOM)
- 3.2.4. Currently Acquired Market (CAM)
- 3.3. Forecasting Tools and Techniques
- 3.3.1. Qualitative Forecasting
- 3.3.2. Correlation
- 3.3.3. Regression
- 3.3.4. Time Series Analysis
- 3.3.5. Extrapolation
- 3.3.6. Convergence
- 3.3.7. Forecast Error Analysis
- 3.3.8. Data Visualization
- 3.3.9. Scenario Planning
- 3.3.10. Sensitivity Analysis
- 3.4. Key Considerations
- 3.4.1. Demographics
- 3.4.2. Market Access
- 3.4.3. Reimbursement Scenarios
- 3.4.4. Industry Consolidation
- 3.5. Robust Quality Control
- 3.6. Key Market Segmentations
- 3.7. Limitations
4. MACRO-ECONOMIC INDICATORS
- 4.1. Chapter Overview
- 4.2. Market Dynamics
- 4.2.1. Time Period
- 4.2.1.1. Historical Trends
- 4.2.1.2. Current and Forecasted Estimates
- 4.2.2. Currency Coverage
- 4.2.2.1. Overview of Major Currencies Affecting the Market
- 4.2.2.2. Impact of Currency Fluctuations on the Industry
- 4.2.3. Foreign Exchange Impact
- 4.2.3.1. Evaluation of Foreign Exchange Rates and Their Impact on Market
- 4.2.3.2. Strategies for Mitigating Foreign Exchange Risk
- 4.2.4. Recession
- 4.2.4.1. Historical Analysis of Past Recessions and Lessons Learnt
- 4.2.4.2. Assessment of Current Economic Conditions and Potential Impact on the Market
- 4.2.5. Inflation
- 4.2.5.1. Measurement and Analysis of Inflationary Pressures in the Economy
- 4.2.5.2. Potential Impact of Inflation on the Market Evolution
- 4.2.6. Interest Rates
- 4.2.6.1. Overview of Interest Rates and Their Impact on the Market
- 4.2.6.2. Strategies for Managing Interest Rate Risk
- 4.2.7. Commodity Flow Analysis
- 4.2.7.1. Type of Commodity
- 4.2.7.2. Origins and Destinations
- 4.2.7.3. Values and Weights
- 4.2.7.4. Modes of Transportation
- 4.2.8. Global Trade Dynamics
- 4.2.8.1. Import Scenario
- 4.2.8.2. Export Scenario
- 4.2.9. War Impact Analysis
- 4.2.9.1. Russian-Ukraine War
- 4.2.9.2. Israel-Hamas War
- 4.2.10. COVID Impact / Related Factors
- 4.2.10.1. Global Economic Impact
- 4.2.10.2. Industry-specific Impact
- 4.2.10.3. Government Response and Stimulus Measures
- 4.2.10.4. Future Outlook and Adaptation Strategies
- 4.2.11. Other Indicators
- 4.2.11.1. Fiscal Policy
- 4.2.11.2. Consumer Spending
- 4.2.11.3. Gross Domestic Product (GDP)
- 4.2.11.4. Employment
- 4.2.11.5. Taxes
- 4.2.11.6. R&D Innovation
- 4.2.11.7. Stock Market Performance
- 4.2.11.8. Supply Chain
- 4.2.11.9. Cross-Border Dynamics
- 4.2.1. Time Period
SECTION II: QUALITATIVE INSIGHTS
5. EXECUTIVE SUMMARY
6. INTRODUCTION
- 6.1. Chapter Overview
- 6.2. Overview of Retrieval-Augmented Generation Market
- 6.2.1. Type of Function
- 6.2.2. Areas of Application
- 6.2.3. Type of Deployment
- 6.2.4. Type of Technology
- 6.2.5. Type of End-Users
- 6.3. Future Perspective
7. REGULATORY SCENARIO
SECTION III: MARKET OVERVIEW
8. COMPREHENSIVE DATABASE OF LEADING PLAYERS
9. COMPETITIVE LANDSCAPE
- 9.1. Chapter Overview
- 9.2. Retrieval-Augmented Generation Market: Overall Market Landscape
- 9.2.1. Analysis by Year of Establishment
- 9.2.2. Analysis by Company Size
- 9.2.3. Analysis by Location of Headquarters
- 9.2.4. Analysis by Ownership Structure
10. WHITE SPACE ANALYSIS
11. COMPANY COMPETITIVENESS ANALYSIS
12. STARTUP ECOSYSTEM IN THE RETRIEVAL-AUGMENTED GENERATION MARKET
- 12.1. Retrieval-Augmented Generation Market: Market Landscape of Startups
- 12.1.1. Analysis by Year of Establishment
- 12.1.2. Analysis by Company Size
- 12.1.3. Analysis by Company Size and Year of Establishment
- 12.1.4. Analysis by Location of Headquarters
- 12.1.5. Analysis by Company Size and Location of Headquarters
- 12.1.6. Analysis by Ownership Structure
- 12.2. Key Findings
SECTION IV: COMPANY PROFILES
13. COMPANY PROFILES
- 13.1. Chapter Overview
- 13.2. Amazon Web Services*
- 13.2.1. Company Overview
- 13.2.2. Company Mission
- 13.2.3. Company Footprint
- 13.2.4. Management Team
- 13.2.5. Contact Details
- 13.2.6. Financial Performance
- 13.2.7. Operating Business Segments
- 13.2.8. Service / Product Portfolio (project specific)
- 13.2.9. MOAT Analysis
- 13.2.10. Recent Developments and Future Outlook
- 13.3. Anthropic
- 13.4. Clarifai
- 13.5. Cohere
- 13.6. Databricks
- 13.7. Google DeepMind
- 13.8. Google
- 13.9. Hugging Face
- 13.10. IBM
- 13.11. Informatica
- 13.12. Meta Platforms
- 13.13. Microsoft
- 13.14. Neeva
- 13.15. NVIDIA
- 13.16. OpenAI
- 13.17. Semantic Scholar
SECTION V: MARKET TRENDS
14. MEGA TRENDS ANALYSIS
15. UNMET NEED ANALYSIS
16. PATENT ANALYSIS
17. RECENT DEVELOPMENTS
- 17.1. Chapter Overview
- 17.2. Recent Funding
- 17.3. Recent Partnerships
- 17.4. Other Recent Initiatives
SECTION VI: MARKET OPPORTUNITY ANALYSIS
18. GLOBAL RETRIEVAL-AUGMENTED GENERATION MARKET
- 18.1. Chapter Overview
- 18.2. Key Assumptions and Methodology
- 18.3. Trends Disruption Impacting Market
- 18.4. Demand Side Trends
- 18.5. Supply Side Trends
- 18.6. Global Retrieval-Augmented Generation Market, Historical Trends (Since 2020) and Forecasted Estimates (Till 2035)
- 18.7. Multivariate Scenario Analysis
- 18.7.1. Conservative Scenario
- 18.7.2. Optimistic Scenario
- 18.8. Investment Feasibility Index
- 18.9. Key Market Segmentations
19. MARKET OPPORTUNITIES BASED ON TYPE OF FUNCTION
- 19.1. Chapter Overview
- 19.2. Key Assumptions and Methodology
- 19.3. Revenue Shift Analysis
- 19.4. Market Movement Analysis
- 19.5. Penetration-Growth (P-G) Matrix
- 19.6. Retrieval-Augmented Generation Market for Document Retrieval: Historical Trends (Since 2020) and Forecasted Estimates (Till 2035)
- 19.7. Retrieval-Augmented Generation Market for Recommendation Engines: Historical Trends (Since 2020) and Forecasted Estimates (Till 2035)
- 19.8. Retrieval-Augmented Generation Market for Response Generation: Historical Trends (Since 2020) and Forecasted Estimates (Till 2035)
- 19.9. Retrieval-Augmented Generation Market for Summarization & Reporting: Historical Trends (Since 2020) and Forecasted Estimates (Till 2035)
- 19.10. Data Triangulation and Validation
- 19.10.1. Secondary Sources
- 19.10.2. Primary Sources
- 19.10.3. Statistical Modeling
20. MARKET OPPORTUNITIES BASED ON AREAS OF APPLICATION
- 20.1. Chapter Overview
- 20.2. Key Assumptions and Methodology
- 20.3. Revenue Shift Analysis
- 20.4. Market Movement Analysis
- 20.5. Penetration-Growth (P-G) Matrix
- 20.6. Retrieval-Augmented Generation Market for Content Generation: Historical Trends (Since 2020) and Forecasted Estimates (Till 2035)
- 20.7. Retrieval-Augmented Generation Market for Customer Support & Chatbots: Historical Trends (Since 2020) and Forecasted Estimates (Till 2035)
- 20.8. Retrieval-Augmented Generation Market for Knowledge Management: Historical Trends (Since 2020) and Forecasted Estimates (Till 2035)
- 20.9. Retrieval-Augmented Generation Market for Legal & Compliance: Historical Trends (Since 2020) and Forecasted Estimates (Till 2035)
- 20.10. Retrieval-Augmented Generation Market for Marketing & Sales: Historical Trends (Since 2020) and Forecasted Estimates (Till 2035)
- 20.11. Retrieval-Augmented Generation Market for Research & Development: Historical Trends (Since 2020) and Forecasted Estimates (Till 2035)
- 20.12. Data Triangulation and Validation
- 20.12.1. Secondary Sources
- 20.12.2. Primary Sources
- 20.12.3. Statistical Modeling
21. MARKET OPPORTUNITIES BASED ON TYPE OF DEPLOYMENT
- 21.1. Chapter Overview
- 21.2. Key Assumptions and Methodology
- 21.3. Revenue Shift Analysis
- 21.4. Market Movement Analysis
- 21.5. Penetration-Growth (P-G) Matrix
- 21.6. Retrieval-Augmented Generation Market for Cloud: Historical Trends (Since 2020) and Forecasted Estimates (Till 2035)
- 21.7. Retrieval-Augmented Generation Market for On-Premises: Historical Trends (Since 2020) and Forecasted Estimates (Till 2035)
- 21.8. Data Triangulation and Validation
- 21.8.1. Secondary Sources
- 21.8.2. Primary Sources
- 21.8.3. Statistical Modeling
22. MARKET OPPORTUNITIES BASED ON TYPE OF TECHNOLOGY
- 22.1. Chapter Overview
- 22.2. Key Assumptions and Methodology
- 22.3. Revenue Shift Analysis
- 22.4. Market Movement Analysis
- 22.5. Penetration-Growth (P-G) Matrix
- 22.6. Retrieval-Augmented Generation Market for Deep Learning: Historical Trends (Since 2020) and Forecasted Estimates (Till 2035)
- 22.7. Retrieval-Augmented Generation Market for Knowledge Graphs: Historical Trends (Since 2020) and Forecasted Estimates (Till 2035)
- 22.8. Retrieval-Augmented Generation Market for Machine Learning: Historical Trends (Since 2020) and Forecasted Estimates (Till 2035)
- 22.9. Retrieval-Augmented Generation Market for Natural Language Processing (NLP): Historical Trends (Since 2020) and Forecasted Estimates (Till 2035)
- 22.10. Retrieval-Augmented Generation Market for Semantic Search: Historical Trends (Since 2020) and Forecasted Estimates (Till 2035)
- 22.11. Retrieval-Augmented Generation Market for Sentiment Analysis Algorithms: Historical Trends (Since 2020) and Forecasted Estimates (Till 2035)
- 22.12. Data Triangulation and Validation
- 22.12.1. Secondary Sources
- 22.12.2. Primary Sources
- 22.12.3. Statistical Modeling
23. MARKET OPPORTUNITIES BASED ON TYPE OF END-USERS
- 23.1. Chapter Overview
- 23.2. Key Assumptions and Methodology
- 23.3. Revenue Shift Analysis
- 23.4. Market Movement Analysis
- 23.5. Penetration-Growth (P-G) Matrix
- 23.6. Retrieval-Augmented Generation Market for Education: Historical Trends (Since 2020) and Forecasted Estimates (Till 2035)
- 23.7. Retrieval-Augmented Generation Market for Financial Services: Historical Trends (Since 2020) and Forecasted Estimates (Till 2035)
- 23.8. Retrieval-Augmented Generation Market for Healthcare: Historical Trends (Since 2020) and Forecasted Estimates (Till 2035)
- 23.9. Retrieval-Augmented Generation Market for IT & Telecommunications: Historical Trends (Since 2020) and Forecasted Estimates (Till 2035)
- 23.10. Retrieval-Augmented Generation Market for Media & Entertainment: Historical Trends (Since 2020) and Forecasted Estimates (Till 2035)
- 23.11. Retrieval-Augmented Generation Market for Retail & E-Commerce: Historical Trends (Since 2020) and Forecasted Estimates (Till 2035)
- 23.12. Retrieval-Augmented Generation Market for Others: Historical Trends (Since 2020) and Forecasted Estimates (Till 2035)
- 23.13. Data Triangulation and Validation
- 23.13.1. Secondary Sources
- 23.13.2. Primary Sources
- 23.13.3. Statistical Modeling
24. MARKET OPPORTUNITIES FOR RETRIEVAL-AUGMENTED GENERATION IN NORTH AMERICA
- 24.1. Chapter Overview
- 24.2. Key Assumptions and Methodology
- 24.3. Revenue Shift Analysis
- 24.4. Market Movement Analysis
- 24.5. Penetration-Growth (P-G) Matrix
- 24.6. Retrieval-Augmented Generation Market in North America: Historical Trends (Since 2020) and Forecasted Estimates (Till 2035)
- 24.6.1. Retrieval-Augmented Generation Market in the US: Historical Trends (Since 2020) and Forecasted Estimates (Till 2035)
- 24.6.2. Retrieval-Augmented Generation Market in Canada: Historical Trends (Since 2020) and Forecasted Estimates (Till 2035)
- 24.6.3. Retrieval-Augmented Generation Market in Mexico: Historical Trends (Since 2020) and Forecasted Estimates (Till 2035)
- 24.6.4. Retrieval-Augmented Generation Market in Other North American Countries: Historical Trends (Since 2020) and Forecasted Estimates (Till 2035)
- 24.7. Data Triangulation and Validation
25. MARKET OPPORTUNITIES FOR RETRIEVAL-AUGMENTED GENERATION IN EUROPE
- 25.1. Chapter Overview
- 25.2. Key Assumptions and Methodology
- 25.3. Revenue Shift Analysis
- 25.4. Market Movement Analysis
- 25.5. Penetration-Growth (P-G) Matrix
- 25.6. Retrieval-Augmented Generation Market in Europe: Historical Trends (Since 2020) and Forecasted Estimates (Till 2035)
- 25.6.1. Retrieval-Augmented Generation Market in Austria: Historical Trends (Since 2020) and Forecasted Estimates (Till 2035)
- 25.6.2. Retrieval-Augmented Generation Market in Belgium: Historical Trends (Since 2020) and Forecasted Estimates (Till 2035)
- 25.6.3. Retrieval-Augmented Generation Market in Denmark: Historical Trends (Since 2020) and Forecasted Estimates (Till 2035)
- 25.6.4. Retrieval-Augmented Generation Market in France: Historical Trends (Since 2020) and Forecasted Estimates (Till 2035)
- 25.6.5. Retrieval-Augmented Generation Market in Germany: Historical Trends (Since 2020) and Forecasted Estimates (Till 2035)
- 25.6.6. Retrieval-Augmented Generation Market in Ireland: Historical Trends (Since 2020) and Forecasted Estimates (Till 2035)
- 25.6.7. Retrieval-Augmented Generation Market in Italy: Historical Trends (Since 2020) and Forecasted Estimates (Till 2035)
- 25.6.8. Retrieval-Augmented Generation Market in the Netherlands: Historical Trends (Since 2020) and Forecasted Estimates (Till 2035)
- 25.6.9. Retrieval-Augmented Generation Market in Norway: Historical Trends (Since 2020) and Forecasted Estimates (Till 2035)
- 25.6.10. Retrieval-Augmented Generation Market in Russia: Historical Trends (Since 2020) and Forecasted Estimates (Till 2035)
- 25.6.11. Retrieval-Augmented Generation Market in Spain: Historical Trends (Since 2020) and Forecasted Estimates (Till 2035)
- 25.6.12. Retrieval-Augmented Generation Market in Sweden: Historical Trends (Since 2020) and Forecasted Estimates (Till 2035)
- 25.6.13. Retrieval-Augmented Generation Market in Sweden: Historical Trends (Since 2020) and Forecasted Estimates (Till 2035)
- 25.6.14. Retrieval-Augmented Generation Market in Switzerland: Historical Trends (Since 2020) and Forecasted Estimates (Till 2035)
- 25.6.15. Retrieval-Augmented Generation Market in the UK: Historical Trends (Since 2020) and Forecasted Estimates (Till 2035)
- 25.6.16. Retrieval-Augmented Generation Market in Other European Countries: Historical Trends (Since 2020) and Forecasted Estimates (Till 2035)
- 25.7. Data Triangulation and Validation
26. MARKET OPPORTUNITIES FOR RETRIEVAL-AUGMENTED GENERATION IN ASIA
- 26.1. Chapter Overview
- 26.2. Key Assumptions and Methodology
- 26.3. Revenue Shift Analysis
- 26.4. Market Movement Analysis
- 26.5. Penetration-Growth (P-G) Matrix
- 26.6. Retrieval-Augmented Generation Market in Asia: Historical Trends (Since 2020) and Forecasted Estimates (Till 2035)
- 26.6.1. Retrieval-Augmented Generation Market in China: Historical Trends (Since 2020) and Forecasted Estimates (Till 2035)
- 26.6.2. Retrieval-Augmented Generation Market in India: Historical Trends (Since 2020) and Forecasted Estimates (Till 2035)
- 26.6.3. Retrieval-Augmented Generation Market in Japan: Historical Trends (Since 2020) and Forecasted Estimates (Till 2035)
- 26.6.4. Retrieval-Augmented Generation Market in Singapore: Historical Trends (Since 2020) and Forecasted Estimates (Till 2035)
- 26.6.5. Retrieval-Augmented Generation Market in South Korea: Historical Trends (Since 2020) and Forecasted Estimates (Till 2035)
- 26.6.6. Retrieval-Augmented Generation Market in Other Asian Countries: Historical Trends (Since 2020) and Forecasted Estimates (Till 2035)
- 26.7. Data Triangulation and Validation
27. MARKET OPPORTUNITIES FOR RETRIEVAL-AUGMENTED GENERATION IN MIDDLE EAST AND NORTH AFRICA (MENA)
- 27.1. Chapter Overview
- 27.2. Key Assumptions and Methodology
- 27.3. Revenue Shift Analysis
- 27.4. Market Movement Analysis
- 27.5. Penetration-Growth (P-G) Matrix
- 27.6. Retrieval-Augmented Generation Market in Middle East and North Africa (MENA): Historical Trends (Since 2020) and Forecasted Estimates (Till 2035)
- 27.6.1. Retrieval-Augmented Generation Market in Egypt: Historical Trends (Since 2020) and Forecasted Estimates (Till 205)
- 27.6.2. Retrieval-Augmented Generation Market in Iran: Historical Trends (Since 2020) and Forecasted Estimates (Till 2035)
- 27.6.3. Retrieval-Augmented Generation Market in Iraq: Historical Trends (Since 2020) and Forecasted Estimates (Till 2035)
- 27.6.4. Retrieval-Augmented Generation Market in Israel: Historical Trends (Since 2020) and Forecasted Estimates (Till 2035)
- 27.6.5. Retrieval-Augmented Generation Market in Kuwait: Historical Trends (Since 2020) and Forecasted Estimates (Till 2035)
- 27.6.6. Retrieval-Augmented Generation Market in Saudi Arabia: Historical Trends (Since 2020) and Forecasted Estimates (Till 2035)
- 27.6.7. Retrieval-Augmented Generation Market in United Arab Emirates (UAE): Historical Trends (Since 2020) and Forecasted Estimates (Till 2035)
- 27.6.8. Retrieval-Augmented Generation Market in Other MENA Countries: Historical Trends (Since 2020) and Forecasted Estimates (Till 2035)
- 27.7. Data Triangulation and Validation
28. MARKET OPPORTUNITIES FOR RETRIEVAL-AUGMENTED GENERATION IN LATIN AMERICA
- 28.1. Chapter Overview
- 28.2. Key Assumptions and Methodology
- 28.3. Revenue Shift Analysis
- 28.4. Market Movement Analysis
- 28.5. Penetration-Growth (P-G) Matrix
- 28.6. Retrieval-Augmented Generation Market in Latin America: Historical Trends (Since 2020) and Forecasted Estimates (Till 2035)
- 28.6.1. Retrieval-Augmented Generation Market in Argentina: Historical Trends (Since 2020) and Forecasted Estimates (Till 2035)
- 28.6.2. Retrieval-Augmented Generation Market in Brazil: Historical Trends (Since 2020) and Forecasted Estimates (Till 2035)
- 28.6.3. Retrieval-Augmented Generation Market in Chile: Historical Trends (Since 2020) and Forecasted Estimates (Till 2035)
- 28.6.4. Retrieval-Augmented Generation Market in Colombia Historical Trends (Since 2020) and Forecasted Estimates (Till 2035)
- 28.6.5. Retrieval-Augmented Generation Market in Venezuela: Historical Trends (Since 2020) and Forecasted Estimates (Till 2035)
- 28.6.6. Retrieval-Augmented Generation Market in Other Latin American Countries: Historical Trends (Since 2020) and Forecasted Estimates (Till 2035)
- 28.7. Data Triangulation and Validation
29. MARKET OPPORTUNITIES FOR RETRIEVAL-AUGMENTED GENERATION IN REST OF THE WORLD
- 29.1. Chapter Overview
- 29.2. Key Assumptions and Methodology
- 29.3. Revenue Shift Analysis
- 29.4. Market Movement Analysis
- 29.5. Penetration-Growth (P-G) Matrix
- 29.6. Retrieval-Augmented Generation Market in Rest of the World: Historical Trends (Since 2020) and Forecasted Estimates (Till 2035)
- 29.6.1. Retrieval-Augmented Generation Market in Australia: Historical Trends (Since 2020) and Forecasted Estimates (Till 2035)
- 29.6.2. Retrieval-Augmented Generation Market in New Zealand: Historical Trends (Since 2020) and Forecasted Estimates (Till 2035)
- 29.6.3. Retrieval-Augmented Generation Market in Other Countries
- 29.7. Data Triangulation and Validation
30. MARKET CONCENTRATION ANALYSIS: DISTRIBUTION BY LEADING PLAYERS
- 30.1. Leading Player 1
- 30.2. Leading Player 2
- 30.3. Leading Player 3
- 30.4. Leading Player 4
- 30.5. Leading Player 5
- 30.6. Leading Player 6
- 30.7. Leading Player 7
- 30.8. Leading Player 8
31. ADJACENT MARKET ANALYSIS
SECTION VII: STRATEGIC TOOLS
32. KEY WINNING STRATEGIES
33. PORTER'S FIVE FORCES ANALYSIS
34. SWOT ANALYSIS
35. VALUE CHAIN ANALYSIS
36. ROOTS STRATEGIC RECOMMENDATIONS
- 36.1. Chapter Overview
- 36.2. Key Business-related Strategies
- 36.2.1. Research & Development
- 36.2.2. Product Manufacturing
- 36.2.3. Commercialization / Go-to-Market
- 36.2.4. Sales and Marketing
- 36.3. Key Operations-related Strategies
- 36.3.1. Risk Management
- 36.3.2. Workforce
- 36.3.3. Finance
- 36.3.4. Others
SECTION VIII: OTHER EXCLUSIVE INSIGHTS
37. INSIGHTS FROM PRIMARY RESEARCH
38. REPORT CONCLUSION
SECTION IX: APPENDIX
39. TABULATED DATA
40. LIST OF COMPANIES AND ORGANIZATIONS
41. CUSTOMIZATION OPPORTUNITIES
42. ROOTS SUBSCRIPTION SERVICES
43. AUTHOR DETAILS
- 発行日
- 発行
- Roots Analysis
- ページ情報
- 英文 188 Pages
- 納期
- 7~10営業日


