
標的タンパク質分解市場:分解装置タイプ別、適応症別、主要地域別
Targeted Protein Degradation Market Distribution by Type of Degrader, Target Indication, Key Geographical Regions (North America, Europe, Asia-Pacific, and Rest of the World )- 発行日
- ページ情報
- 英文 450 Pages
- 納期
- 即日から翌営業日
- 商品コード
- 1737055
- カスタマイズ可能 お客様のご希望に応じて、既存データの加工や未掲載情報(例:国別セグメント)の追加などの対応が可能です。詳細はお問い合わせください。
- 翻訳ツール提供対象 PDF対応AI翻訳ツールの無料貸し出しサービスのご利用が可能です
- 医薬品関連専門 医薬品関連専門を専門とする市場調査会社です。
概要
世界の標的タンパク質分解の市場規模は、2035年までの予測期間中に32%のCAGRで拡大し、現在の4億8,000万米ドルから2035年までに69億4,000万米ドルに成長すると予測されています。
この市場セグメンテーションでは、市場規模と機会分析を以下のパラメータで区分しています:
分解装置タイプ別
- SERD
- プロタック
- 分子接着剤
適応症別
- 乳がん
- 多発性骨髄腫
主要地域別
- 北米(米国、カナダ)
- 欧州(英国、ドイツ、フランス、イタリア、スペイン)
- アジア太平洋(中国、韓国、日本、インド、オーストラリア)
- その他の地域(ブラジル、イスラエル)
標的タンパク質分解市場:成長と動向
標的タンパク質分解(TPD)は、治療困難な疾患の治療を可能にする可能性を秘めた新たな治療手段です。低分子阻害剤やモノクローナル抗体などの従来の医薬品がプロテオームの20%未満しか標的としないのに対し、TPDはプロテオーム内の未探索タンパク質の大部分にアクセスする新しいアプローチを提供します。TPDによって、有害なタンパク質の機能を調節したり阻害したりするのではなく、その量をコントロールすることで病気に対処することができます。タンパク質量の制御は、タンパク質分解剤と呼ばれる低分子薬物によって達成されます。TPDは、E3ユビキチンリガーゼを目的のタンパク質にリクルートし、ユビキチン化とそれに続くプロテアソームによるタンパク質分解を仲介する二機能性低分子です。
低分子を介した選択的TPDには、従来の創薬戦略にはない利点がいくつかあります。主な利点のひとつは、細胞機構における多層的な選択性を活用することによって、標的特異性を迅速に検証できることです。さらに、TPD分解分子が破壊されないという事実のおかげで、有害なタンパク質の多くのコピーを破壊し、全身的な薬物曝露を減らすことができます。さらに、タンパク質の機能を阻害することで、標的タンパク質の発現増加に対抗することができます。一つのタンパク質分解剤が、標的タンパク質のプロテアソーム分解を通じて、複数の病気の原因となるタンパク質を除去できる可能性があることは注目に値します。上記のような利点と現在進行中の技術進歩のペースにより、標的タンパク質分解市場は予測期間中に顕著な成長を遂げるものと思われます。
標的タンパク質分解市場:主要インサイト
当レポートでは、標的タンパク質分解市場の現状を掘り下げ、業界内の潜在的な成長機会を特定しています。当レポートの主な調査結果は以下の通りです:
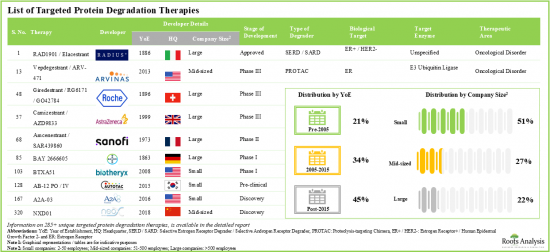
- 285以上の標的タンパク質分解療法が承認されているか、異なる開発段階で研究されています。市場情勢は、既存参入企業と新規参入企業の両方の存在を特徴としています。
- 評価されている標的タンパク質分解剤の20%以上が分子接着剤であり、そのうち70%以上ががん疾患の治療を目的としています。
- 35%以上の技術はPROTACsの開発に焦点を当てており、このうち38%はCADD解析を利用してターゲットを同定する能力を持っています。
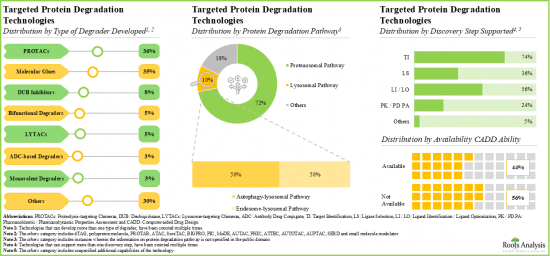
- 現在、約85の革新的な標的タンパク質分解技術が、安定的で有効な分解剤の開発に利用可能です。
- 現在、さまざまな地域にわたり、さまざまな疾患の治療を目的とした標的タンパク質分解療法を調査するため、約250件の臨床試験(登録患者数は約63,000人)が進行中です。
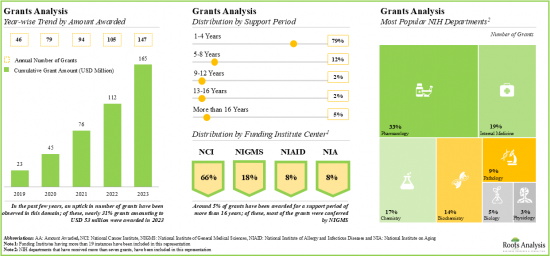
- 2019年以降、1億6,500万米ドル以上の助成金がNIHから授与されており、これらの助成金の~80%は1~4年の支援期間で授与されました。
- 過去5年間で、様々なインパクトのあるジャーナルに複数の論文が掲載され、このような論文はアジア太平洋地域でより多くの関心を集めています。
- この分野で生み出された知的財産を保護するため、産業界および非産業界の参入企業により、標的タンパク質分解剤および関連技術に関する特許が985件以上出願されています。
- 関心の高まりは、最近の様々な利害関係者間で結ばれた幅広いパートナーシップにも反映されており、取引の25%は新規タンパク質分解剤の研究開発に焦点を当てたものでした。
- いくつかの投資家は、標的タンパク質分解の領域における機会に気づき、過去6年間にさまざまな資金調達ラウンドで約135億米ドルを投資しました。
- 標的タンパク質分解市場は、治療不可能な標的を選択的に分解するタンパク質分解剤の能力により、今後10年間で年率32%の成長が見込まれています。
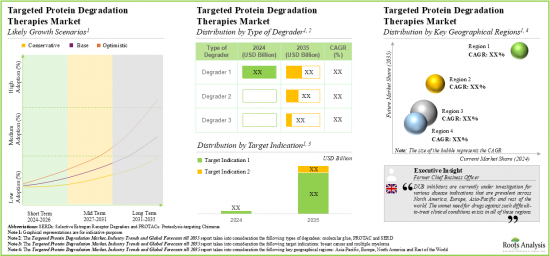
- 市場推計・予測は、特に米国、フランス、スペイン、英国、中国など、さまざまな国に分散すると予測されています。
標的タンパク質分解市場:主要セグメント
分解装置タイプ別では、市場はSERD、PROTAC、分子接着剤に区分されます。現在、転移性乳がんに対する経口SERDであるエラセストラント(ORSERDU)の承認により、標的タンパク質分解市場ではSERD分野が最大シェアを占めています。さらに、PROTACセグメントは予測期間中により速いペースで成長するとみられます。
標的適応症別では、市場は乳がんと多発性骨髄腫に区分されます。現在、標的タンパク質分解市場で最も高い割合を占めているのは乳がんです。この動向は、新たに診断される症例の12.5%以上を占める乳がんの有病率の増加により、今後も変わらないと思われます。さらに、乳がんセグメントの標的タンパク質分解市場は、予測期間中に比較的高いCAGRで成長する可能性が高いです。
主要地域別に見ると、市場は北米、欧州、アジア太平洋地域、その他の地域に区分されます。現在、北米が標的タンパク質分解市場を独占しており、最大の収益シェアを占めています。さらに、アジア太平洋地域の市場は、今後数年間でより高いCAGRで成長すると予想されています。
当レポートでは、世界の標的タンパク質分解市場について調査し、市場の概要とともに、分解装置タイプ別、適応症別、主要地域別の動向、および市場に参入する企業のプロファイルなどを提供しています。
目次
第1章 序文
第1章 1.市場概要
第2章 調査手法
第3章 経済的およびその他のプロジェクト特有の考慮事項
第4章 エグゼクティブサマリー
第5章 イントロダクション
- 章の概要
- 標的タンパク質分解の概要
- 標的タンパク質分解経路
- タンパク質分解剤の種類
- 対象治療領域
- 標的タンパク質分解に伴う利点と課題
- 将来の展望
第6章 市場情勢:標的タンパク質分解療法
- 章の概要
- 標的タンパク質分解療法:市場情勢
- 標的タンパク質分解療法の開発者:市場情勢
第7章 市場情勢:標的タンパク質分解技術
- 章の概要
- 標的タンパク質分解技術:市場情勢
第8章 企業プロファイル
- 章の概要
- 主要参入企業の詳細プロファイル
- Arvinas
- Bristol-Myers Squibb
- C4 Therapeutics
- Loxo Oncology
- Olema Oncology
- Radius Health
- AstraZeneca
- Roche
- その他の企業のプロファイル
- BeiGene
- InnoCare Pharma
- Kangpu Biopharmaceuticals
- Kintor Pharmaceuticals
- Medivir
- Monte Rosa Therapeutics
- Ranok Therapeutics
- Sanofi
- Zentalis Pharmaceuticals
- Eisai Therapeutics
第9章 臨床試験の分析
- 章の概要
- 範囲と調査手法
- 標的タンパク質分解:臨床試験分析
第10章 助成金分析
- 章の概要
- 範囲と調査手法
- 標的タンパク質分解:助成金分析
第11章 特許分析
- 章の概要
- 範囲と調査手法
- 標的タンパク質分解:特許分析
- 特許ベンチマーク分析
- 特許評価
- 引用数上位の特許
第12章 出版物の分析
第13章 パートナーシップとコラボレーション
第14章 資金調達と投資
第15章 市場影響分析:促進要因、抑制要因、機会、課題
第16章 世界の標的タンパク質分解市場
- 章の概要
- 主要な前提と調査手法
- 世界の標的タンパク質分解市場、予測(2035年まで)
- 主要な市場セグメンテーション
第17章 標的タンパク質分解市場(分解装置タイプ別)
第18章 標的タンパク質分解市場(標的適応症別)
第19章 標的タンパク質分解市場(主要地域別)
第20章 標的タンパク質分解市場、医薬品の売上予測
- 章の概要
- 主要な前提と調査手法
- 商業化された標的タンパク質分解市場:売上予測
- フェーズIII標的タンパク質分解市場:売上予測
- データの三角測量と検証
第21章 世界の標的タンパク質分解技術市場
第22章 エグゼクティブ洞察
第23章 結論
第24章 付録1:表形式データ
第25章 付録2:企業・団体一覧
第26章 付録3:資金調達と投資のリスト
図表
List of Tables
- Table 6.1 Targeted Protein Degradation Therapies: Information on Developer, Stage of Development and Type of Degrader
- Table 6.2 Targeted Protein Degradation Therapies: Information on Biological Target, Target Enzyme, Target Indication and Therapeutic Area
- Table 6.3 Targeted Protein Degradation Therapy Developers: Information on Year of Establishment, Company Size and Location of Headquarters
- Table 7.1 Targeted Protein Degradation Technologies: Information on Type of Degrader Developed, Protein Degradation Pathway and Site of Degraded Protein
- Table 7.2 Targeted Protein Degradation Technologies: Information on Therapeutic Area
- Table 7.3 Targeted Protein Degradation Technologies: Information on Discovery Step Supported and CADD Ability
- Table 7.4 Targeted Protein Degradation Technology Providers: Information on Year of Establishment, Company Size and Location of Headquarters
- Table 8.1 List of Targeted Protein Degradation Therapy Developers Profiled
- Table 8.2 Arvinas: Company Overview
- Table 8.3 Arvinas: Technology Portfolio
- Table 8.4 Arvinas: Pipeline Overview
- Table 8.5 Arvinas: Recent Developments and Future Outlook
- Table 8.6 Bristol-Myers Squibb: Company Overview
- Table 8.7 Bristol-Myers Squibb: Technology Portfolio
- Table 8.8 Bristol-Myers Squibb: Pipeline Overview
- Table 8.9 Bristol-Myers Squibb: Recent Developments and Future Outlook
- Table 8.10 C4 Therapeutics: Company Overview
- Table 8.11 C4 Therapeutics: Technology Portfolio
- Table 8.12 C4 Therapeutics: Pipeline Overview
- Table 8.13 C4 Therapeutics: Recent Developments and Future Outlook
- Table 8.14 Loxo Oncology: Company Overview
- Table 8.15 Loxo Oncology: Pipeline Overview
- Table 8.16 Olema Oncology: Company Overview
- Table 8.17 Olema Oncology: Pipeline Overview
- Table 8.18 Olema Oncology: Recent Developments and Future Outlook
- Table 8.19 Radius Health: Company Overview
- Table 8.20 Radius Health: Pipeline Overview
- Table 8.21 Radius Health: Recent Developments and Future Outlook
- Table 8.22 AstraZeneca: Company Overview
- Table 8.23 AstraZeneca: Pipeline Overview
- Table 8.24 Roche: Company Overview
- Table 8.25 Roche: Pipeline Overview
- Table 8.26 BeiGene: Company Overview
- Table 8.27 BeiGene: Pipeline Overview
- Table 8.28 InnoCare Pharma: Company Overview
- Table 8.29 InnoCare Pharma: Technology Portfolio
- Table 8.30 InnoCare Pharma: Pipeline Overview
- Table 8.31 Kangpu Biopharmaceuticals: Company Overview
- Table 8.32 Kangpu Biopharmaceuticals: Technology Portfolio
- Table 8.33 Kangpu Biopharmaceuticals: Pipeline Overview
- Table 8.34 Kintor Pharmaceutical: Company Overview
- Table 8.35 Kintor Pharmaceutical: Technology Portfolio
- Table 8.36 Kintor Pharmaceutical: Pipeline Overview
- Table 8.37 Medivir: Company Overview
- Table 8.38 Medivir: Technology Portfolio
- Table 8.39 Medivir: Pipeline Overview
- Table 8.40 Monte Rosa Therapeutics: Company Overview
- Table 8.41 Monte Rosa Therapeutics: Technology Portfolio
- Table 8.42 Monte Rosa Therapeutics: Pipeline Overview
- Table 8.43 Ranok Therapeutics: Company Overview
- Table 8.44 Ranok Therapeutics: Technology Portfolio
- Table 8.45 Ranok Therapeutics: Pipeline Overview
- Table 8.46 Sanofi: Company Overview
- Table 8.47 Sanofi: Pipeline Overview
- Table 8.48 Zentalis Pharmaceuticals: Company Overview
- Table 8.49 Zentalis Pharmaceuticals: Technology Portfolio
- Table 8.50 Zentalis Pharmaceuticals: Pipeline Overview
- Table 8.51 Eisai Therapeutics: Company Overview
- Table 8.52 Eisai Therapeutics: Pipeline Overview
- Table 11.1 Patent Analysis: Top CPC Sections
- Table 11.2 Patent Analysis: Top CPC Symbols
- Table 11.3 Patent Analysis: Top CPC Codes
- Table 11.4 Patent Analysis: Summary of Benchmarking Analysis
- Table 11.5 Patent Analysis: Categorization based on Weighted Valuation Scores
- Table 11.6 Patent Portfolio: List of Leading Patents (By Highest Relative Valuation)
- Table 11.7 Patent Portfolio: List of Leading Patents (By Number of Citations)
- Table 13.1 Targeted Protein Degradation: List of Partnerships and Collaborations
- Table 13.2 Partnerships and Collaborations: Information on Type of Agreement (Country and Region)
- Table 14.1 Targeted Protein Degradation: List of Funding and Investments, Since 2018
- Table 16.1 List of Targeted Protein Degradation Therapies Forecasted
- Table 21.1 Targeted Protein Degradation Technologies: Average Upfront Payment and Average Milestone Payment, Since 2015 (USD Million)
- Table 21.2 Library Licensing Deal: Tranches of Milestone Payments
- Table 22.1 GlycoEra: Company Snapshot
- Table 22.2 Polyprox Therapeutics: Company Snapshot
- Table 22.3 Xios Therapeutics: Company Snapshot
- Table 22.4 Mission Therapeutics: Company Snapshot
- Table 22.5 Ubiquigent: Company Snapshot
- Table 22.6 Almac Discovery: Company Snapshot
- Table 22.7 University of Delaware: Company Snapshot
- Table 22.8 Francis Crick Institute: Company Snapshot
- Table 22.9 Anonymous: Company Snapshot
- Table 22.10 Anonymous: Company Snapshot
- Table 24.1 Targeted Protein Degradation Therapies: Distribution by Stage of Development
- Table 24.2 Targeted Protein Degradation Technologies: Distribution by Type of Degrader
- Table 24.3 Targeted Protein Degradation Therapies: Distribution by Biological Target
- Table 24.4 Targeted Protein Degradation Therapies: Distribution by Target Enzyme
- Table 24.5 Targeted Protein Degradation Therapies: Distribution by Target Indication
- Table 24.6 Targeted Protein Degradation Therapies: Distribution by Therapeutic Area
- Table 24.7 Targeted Protein Degradation Therapy Developers: Distribution by Year of Establishment
- Table 24.8 Targeted Protein Degradation Therapy Developers: Distribution by Company Size
- Table 24.9 Targeted Protein Degradation Therapy Developers: Distribution by Location of Headquarters (Region)
- Table 24.10 Targeted Protein Degradation Therapy Developers: Distribution by Year of Establishment and Location of Headquarters (Region)
- Table 24.11 Targeted Protein Degradation Therapy Developers: Distribution by Company Size and Location of Headquarters (Region)
- Table 24.12 Most Active Developers: Distribution by Number of Therapies and Stage of Development
- Table 24.13 Targeted Protein Degradation Technologies: Distribution by Type of Degrader Developed
- Table 24.14 Targeted Protein Degradation Technologies: Distribution by Protein Degradation Pathway
- Table 24.15 Targeted Protein Degradation Technologies: Distribution by Site of Degraded Protein
- Table 24.16 Targeted Protein Degradation Therapies: Distribution by Therapeutic Area
- Table 24.17 Targeted Protein Degradation Therapies: Distribution by Discovery Step Supported
- Table 24.18 Targeted Protein Degradation Technologies: Distribution by Availability of Computational Modeling Ability
- Table 24.19 Targeted Protein Degradation Technology Providers: Distribution by Year of Establishment
- Table 24.20 Targeted Protein Degradation Technology Providers: Distribution by Company Size
- Table 24.21 Targeted Protein Degradation Technology Providers: Distribution by Location of Headquarters (Region)
- Table 24.22 Targeted Protein Degradation Technology Providers: Distribution by Year of Establishment and Location of Headquarters (Region)
- Table 24.23 Targeted Protein Degradation Technology Providers: Distribution by Company Size and Location of Headquarters (Region)
- Table 24.24 Arvinas: Annual Revenues, Since FY 2019 (USD Million)
- Table 24.25 Bristol-Myers Squibb: Annual Revenues, Since FY 2019 (USD Billion)
- Table 24.26 C4 Therapeutics: Annual Revenues, Since FY 2019 (USD Million)
- Table 24.27 Radius Health: Annual Revenues, Since FY 2019 (USD Million)
- Table 24.28 AstraZeneca: Annual Revenues, Since FY 2019 (USD Billion)
- Table 24.29 Roche: Annual Revenues, Since FY 2019 (CHF Billion)
- Table 24.30 Clinical Trial Analysis: Cumulative Year-wise Trend, Since 2019
- Table 24.31 Clinical Trial Analysis: Year-wise Trend of Patients Enrolled by Trial Registration Year, Since 2019
- Table 24.32 Clinical Trial Analysis: Distribution by Trial Phase
- Table 24.33 Clinical Trial Analysis: Distribution of Number of Patients Enrolled by Trial Phase
- Table 24.34 Clinical Trial Analysis: Distribution by Trial Registration Year and Trial Phase, Since 2019
- Table 24.35 Clinical Trial Analysis: Distribution by Trial Status
- Table 24.36 Clinical Trial Analysis: Distribution by Patient Gender
- Table 24.37 Clinical Trial Analysis: Distribution by Target Indication
- Table 24.38 Clinical Trial Analysis: Distribution by Type of Trial Masking
- Table 24.39 Clinical Trial Analysis: Distribution by Type of Intervention Model
- Table 24.40 Clinical Trial Analysis: Distribution by Trial Purpose
- Table 24.41 Clinical Trial Analysis: Distribution by Distribution by Design Allocation
- Table 24.42 Leading Industry Players: Distribution by Number of Registered Trials
- Table 24.43 Leading Non-Industry Players: Distribution by Number of Registered Trials
- Table 24.44 Clinical Trial Analysis: Distribution of Clinical Trials by Trial Status and Geography
- Table 24.45 Clinical Trial Analysis: Distribution of Patients Enrolled by Trial Status and Geography
- Table 24.46 Grants Analysis: Cumulative Year-wise Trend, Since 2019
- Table 24.47 Grants Analysis: Cumulative Year-wise Trend of Grants by Amount Awarded (USD Million)
- Table 24.48 Grants Analysis: Distribution by Funding Institute Center
- Table 24.49 Grants Analysis: Distribution by Funding Institute Center and Support Period
- Table 24.50 Grants Analysis: Distribution by Support Period
- Table 24.51 Grants Analysis: Distribution by Type of Grant Application
- Table 24.52 Grants Analysis: Distribution by Purpose of Grant Award
- Table 24.53 Grants Analysis: Distribution by Activity Code (Series)
- Table 24.54 Grants Analysis: Distribution by Activity Code
- Table 24.55 Grants Analysis: Distribution by Study Section Involved
- Table 24.56 Most Popular NIH Departments: Distribution by Number of Grants
- Table 24.57 Prominent Program Officers: Distribution by Number of Grants
- Table 24.58 Popular Recipient Organizations: Distribution by Number of Grants
- Table 24.59 Popular Recipient Organizations: Distribution by Grant Amount (USD Million)
- Table 24.60 Popular Recipient Organizations: Distribution by States in the US
- Table 24.61 Patent Analysis: Distribution by Type of Patent
- Table 24.62 Patent Analysis: Distribution by Patent Publication Year, Since 2019
- Table 24.63 Patent Analysis: Distribution by Patent Application Year, Since Pre-2019
- Table 24.64 Patent Analysis: Year-wise Distribution of Granted Patents and Patent Applications, Since 2019
- Table 24.65 Patent Analysis: Distribution by Patent Jurisdiction
- Table 24.66 Patent Analysis: Cumulative Year-wise Trend by Type of Applicant
- Table 24.67 Leading Industry Players: Distribution by Number of Patents
- Table 24.68 Leading Non-Industry Players: Distribution by Number of Patents
- Table 24.69 Leading Patent Assignees: Distribution by Number of Patents
- Table 24.70 Patent Analysis: Distribution by Patent Age
- Table 24.71 Patent Analysis: Patent Valuation
- Table 24.72 Publication Analysis: Distribution by Year of Publication, Since 2019
- Table 24.73 Publication Analysis: Distribution by Type of Publication
- Table 24.74 Key Journals: Distribution by Number of Publications
- Table 24.75 Key Journals: Distribution by Journal Impact Factor
- Table 24.76 Most Active Publisher: Distribution by Number of Publications
- Table 24.77 Most Active Copyright Holder: Distribution by Number of Publications
- Table 24.78 Publication Analysis: Emerging Focus Area
- Table 24.79 Publication Analysis: Distribution by Therapeutic Area
- Table 24.80 Publication Analysis: Distribution by Geography
- Table 24.81 Partnerships and Collaborations: Cumulative Year-wise Trend, Since Pre-2016
- Table 24.82 Partnerships and Collaborations: Distribution by Type of Partnership
- Table 24.83 Partnerships and Collaborations: Distribution by Year and Type of Partnership, Since Pre-2016
- Table 24.84 Partnerships and Collaborations: Distribution by Type of Partner
- Table 24.85 Partnerships and Collaborations: Distribution by Type of Degrader
- Table 24.86 Most Active Players: Distribution by Number of Partnerships
- Table 24.87 Partnerships and Collaborations: Local and International Agreements
- Table 24.88 Partnerships and Collaborations: Intercontinental and Intracontinental Agreements
- Table 24.89 Funding and Investment Analysis: Cumulative Year-wise Trend, Since 2014
- Table 24.90 Funding and Investment Analysis: Distribution by Amount Invested, Since 2014 (USD Million)
- Table 24.91 Funding and Investment Analysis: Distribution of Instances by Type of Funding, Since 2018
- Table 24.92 Funding and Investments: Distribution by Type of Funding and Amount Invested (USD Million)
- Table 24.93 Year wise Distribution of Amount Invested by Type of Funding, Since 2018
- Table 24.94 Funding and Investments: Distribution by Geography (Region)
- Table 24.95 Funding and Investments: Distribution by Geography (Country)
- Table 24.96 Most Active Players: Distribution by Number of Funding Instances
- Table 24.97 Most Active Players: Distribution by Amount Raised (USD Million)
- Table 24.98 Key Investors: Distribution by Number of Funding Instances
- Table 24.99 Funding and Investments Summary, Since 2018 (USD Million)
- Table 24.100 Global Targeted Protein Degradation Therapies Market, Conservative, Base and Optimistic Scenario, Till 2035 (USD Million)
- Table 24.101 Targeted Protein Degradation Therapies Market: Distribution by Type of Degrader
- Table 24.102 Targeted Protein Degradation Therapies Market for SERDs: Forecasted Estimates, Till 2035, Conservative, Base and Optimistic Scenario (USD Million)
- Table 24.103 Targeted Protein Degradation Therapies Market for PROTACs: Forecasted Estimates, Till 2035, Conservative, Base and Optimistic Scenario (USD Million)
- Table 24.104 Targeted Protein Degradation Therapies Market for Molecular Glues: Forecasted Estimates, Till 2035, Conservative, Base and Optimistic Scenario (USD Million)
- Table 24.105 Targeted Protein Degradation Therapies Market: Distribution by Target Indication
- Table 24.106 Targeted Protein Degradation Therapies Market for Breast Cancer: Forecasted Estimates, Till 2035, Conservative, Base and Optimistic Scenario (USD Million)
- Table 24.107 Targeted Protein Degradation Therapies Market for Multiple Myeloma: Forecasted Estimates, Till 2035, Conservative, Base and Optimistic Scenario (USD Million)
- Table 24.108 Targeted Protein Degradation Therapies Market: Distribution by Key Geographical Regions (USD Million)
- Table 24.109 Targeted Protein Degradation Therapies Market in North America: Forecasted Estimates, Till 2035, Conservative, Base and Optimistic Scenario (USD Million)
- Table 24.110 Targeted Protein Degradation Therapies Market in the US: Forecasted Estimates, Till 2035, Conservative, Base and Optimistic Scenario (USD Million)
- Table 24.111 Targeted Protein Degradation Therapies Market in Canada: Forecasted Estimates, Till 2035, Conservative, Base and Optimistic Scenario (USD Million)
- Table 24.112 Targeted Protein Degradation Therapies Market in Europe: Forecasted Estimates, Till 2035, Conservative, Base and Optimistic Scenario (USD Million)
- Table 24.113 Targeted Protein Degradation Therapies Market in the UK: Forecasted Estimates, Till 2035, Conservative, Base and Optimistic Scenario (USD Million)
- Table 24.114 Targeted Protein Degradation Therapies Market in Germany: Forecasted Estimates, Till 2035, Conservative, Base and Optimistic Scenario (USD Million)
- Table 24.115 Targeted Protein Degradation Therapies Market in France: Forecasted Estimates, Till 2035, Conservative, Base and Optimistic Scenario (USD Million)
- Table 24.116 Targeted Protein Degradation Therapies Market in Spain: Forecasted Estimates, Till 2035, Conservative, Base and Optimistic Scenario (USD Million)
- Table 24.117 Targeted Protein Degradation Therapies Market in Italy: Forecasted Estimates, Till 2035, Conservative, Base and Optimistic Scenario (USD Million)
- Table 24.118 Targeted Protein Degradation Therapies Market in Asia-Pacific: Forecasted Estimates, Till 2035, Conservative, Base and Optimistic Scenario (USD Million)
- Table 24.119 Targeted Protein Degradation Therapies Market in China: Forecasted Estimates, Till 2035, Conservative, Base and Optimistic Scenario (USD Million)
- Table 24.120 Targeted Protein Degradation Therapies Market in South Korea: Forecasted Estimates, Till 2035, Conservative, Base and Optimistic Scenario (USD Million)
- Table 24.121 Targeted Protein Degradation Therapies Market in India: Forecasted Estimates, Till 2035, Conservative, Base and Optimistic Scenario (USD Million)
- Table 24.122 Targeted Protein Degradation Therapies Market in Japan: Forecasted Estimates, Till 2035, Conservative, Base and Optimistic Scenario (USD Million)
- Table 24.123 Targeted Protein Degradation Therapies Market in Australia: Forecasted Estimates, Till 2035, Conservative, Base and Optimistic Scenario (USD Million)
- Table 24.124 Targeted Protein Degradation Therapies Market in Rest of the World: Forecasted Estimates, Till 2035, Conservative, Base and Optimistic Scenario (USD Million)
- Table 24.125 Targeted Protein Degradation Therapies Market in Brazil: Forecasted Estimates, Till 2035, Conservative, Base and Optimistic Scenario (USD Million)
- Table 24.126 Targeted Protein Degradation Therapies Market in Israel: Forecasted Estimates, Till 2035, Conservative, Base and Optimistic Scenario (USD Million)
- Table 24.127 Targeted Protein Degradation Therapies Market: RAD1901 / Elacestrant / Orserdu Sales Forecast, Till 2035, Conservative, Base and Optimistic Scenario (USD Million)
- Table 24.128 Targeted Protein Degradation Therapies Market: Vepedegestrant / ARV-471 Sales Forecast, Till 2035, Conservative, Base and Optimistic Scenario (USD Million)
- Table 24.129 Targeted Protein Degradation Therapies Market: OP-1250 / OP-1250-301 / Palazestrant Sales Forecast, Till 2035, Conservative, Base and Optimistic Scenario (USD Million)
- Table 24.130 Targeted Protein Degradation Therapies Market: LY3484356 / Imlunestrant Sales Forecast, Till 2035, Conservative, Base and Optimistic Scenario (USD Million)
- Table 24.131 Targeted Protein Degradation Therapies Market: CC-92480 / BMS-986348 / Mezigdomide Sales Forecast, Till 2035, Conservative, Base and Optimistic Scenario (USD Million)
- Table 24.132 Targeted Protein Degradation Therapies Market: Camizestrant / AZD9833 Sales Forecast, Till 2035, Conservative, Base and Optimistic Scenario (USD Million)
- Table 24.133 Global Targeted Protein Degradation Technologies Market, Historical Trends (Since 2018), Base Scenario (USD Million)
- Table 24.134 Global Targeted Protein Degradation Technologies Market, Forecasted Estimates (Till 2035), Conservative, Base and Optimistic Scenario (USD Million)
- Table 24.135 Targeted Protein Degradation Technologies Market: Distribution by Type of Payment Model Employed (USD Million)
- Table 24.136 Targeted Protein Degradation Technologies Market for Upfront Payments, Historical Trends Since 2018, Base Scenario (USD Million)
- Table 24.137 Targeted Protein Degradation Technologies Market for Upfront Payments, Forecasted Estimates, Till 2035, Conservative, Base and Optimistic Scenario (USD Million)
- Table 24.138 Targeted Protein Degradation Technologies Market for Milestone Payments, Historical Trends, Since 2018, Base Scenario (USD Million)
- Table 24.139 Targeted Protein Degradation Technologies Market for Milestone Payments, Forecasted Estimates, Till 2035, Conservative, Base and Optimistic Scenario (USD Million)
- Table 26.1 Targeted Protein Degradation: List of Funding and Investments, Since 2014
List of Figures
- Figure 2.1 Research Methodology: Project Methodology
- Figure 2.2 Research Methodology: Forecast Methodology
- Figure 2.3 Research Methodology: Robust Quality Control
- Figure 2.4 Research Methodology: Key Market Segmentations
- Figure 3.1 Lessons Learnt from Past Recessions
- Figure 4.1 Executive Summary: Targeted Protein Degradation Therapies Market Landscape
- Figure 4.2 Executive Summary: Targeted Protein Degradation Technologies Market Landscape
- Figure 4.3 Executive Summary: Clinical Trial Analysis
- Figure 4.4 Executive Summary: Grants Analysis
- Figure 4.5 Executive Summary: Patent Analysis
- Figure 4.6 Executive Summary: Publication Analysis
- Figure 4.7 Executive Summary: Partnerships and Collaborations
- Figure 4.8 Executive Summary: Funding and Investments
- Figure 4.9 Executive Summary: Therapies Market Forecast and Opportunity Analysis
- Figure 4.10 Executive Summary: Technologies Market Forecast and Opportunity Analysis
- Figure 5.1 Timeline of Induced Protein Degradation Field
- Figure 5.2 Ubiquitin-Proteasome System Pathway
- Figure 5.3 Types of Protein Degraders
- Figure 5.4 Mechanism of Action of PROTAC
- Figure 5.5 Advantages of PROTACs
- Figure 5.6 Mechanism of Action of ENDTAC
- Figure 5.7 Mechanism of Action of PHOTAC
- Figure 5.8 Mechanism of Action of Hydrophobic Tag
- Figure 5.9 Mechanism of Action of IMiD
- Figure 5.10 Mechanism of Action of Molecular Glue
- Figure 5.11 Mechanism of Action of SERD
- Figure 5.12 Mechanism of Action of SNIPER
- Figure 5.13 Protein Degradation: Targeted Therapeutic Areas
- Figure 6.1 Targeted Protein Degradation Therapies: Distribution by Stage of Development
- Figure 6.2 Targeted Protein Degradation Technologies: Distribution by Type of Degrader
- Figure 6.3 Targeted Protein Degradation Therapies: Distribution by Biological Target
- Figure 6.4 Targeted Protein Degradation Therapies: Distribution by Target Enzyme
- Figure 6.5 Targeted Protein Degradation Therapies: Distribution by Target Indication
- Figure 6.6 Targeted Protein Degradation Therapies: Distribution by Therapeutic Area
- Figure 6.7 Targeted Protein Degradation Therapy Developers: Distribution by Year of Establishment
- Figure 6.8 Targeted Protein Degradation Therapy Developers: Distribution by Company Size
- Figure 6.9 Targeted Protein Degradation Therapy Developers: Distribution by Location of Headquarters (Region)
- Figure 6.10 Targeted Protein Degradation Therapy Developers: Distribution by Year of Establishment and Location of Headquarters (Region)
- Figure 6.11 Targeted Protein Degradation Therapy Developers: Distribution by Company Size and Location of Headquarters (Region)
- Figure 6.12 Most Active Developers: Distribution by Number of Therapies and Stage of Development
- Figure 7.1 Targeted Protein Degradation Technologies: Distribution by Type of Degrader Developed
- Figure 7.2 Targeted Protein Degradation Technologies: Distribution by Protein Degradation Pathway
- Figure 7.3 Targeted Protein Degradation Technologies: Distribution by Site of Degraded Protein
- Figure 7.4 Targeted Protein Degradation Technologies: Distribution by Therapeutic Area
- Figure 7.5 Targeted Protein Degradation Technologies: Distribution by Discovery Step Supported
- Figure 7.6 Targeted Protein Degradation Technologies: Distribution by Availability of Computational Modeling Ability
- Figure 7.7 Targeted Protein Degradation Technology Providers: Distribution by Year of Establishment
- Figure 7.8 Targeted Protein Degradation Technology Providers: Distribution by Company Size
- Figure 7.9 Targeted Protein Degradation Technology Providers: Distribution by Location of Headquarters (Region)
- Figure 7.10 Targeted Protein Degradation Technology Providers: Distribution by Year of Establishment and Location of Headquarters (Region)
- Figure 7.11 Targeted Protein Degradation Technology Providers: Distribution by Company Size and Location of Headquarters (Region)
- Figure 8.1 Arvinas: Annual Revenues, Since FY 2019 (USD Million)
- Figure 8.2 Bristol-Myers Squibb: Annual Revenues, Since FY 2019 (USD Billion)
- Figure 8.3 C4 Therapeutics: Annual Revenues, Since FY 2019 (USD Million)
- Figure 8.4 Radius Health: Annual Revenues, Since FY 2019 (USD Million)
- Figure 8.5 AstraZeneca: Annual Revenues, Since FY 2019 (USD Billion)
- Figure 8.6 Roche: Annual Revenues, Since FY 2019 (CHF Billion)
- Figure 9.1 Clinical Trial Analysis: Cumulative Year-wise Trend, Since 2019
- Figure 9.2 Clinical Trial Analysis: Year-wise Trend of Patients Enrolled by Trial Registration Year, Since 2019
- Figure 9.3 Clinical Trial Analysis: Distribution by Trial Phase
- Figure 9.4 Clinical Trial Analysis: Distribution of Number of Patients Enrolled by Trial Phase
- Figure 9.5 Clinical Trial Analysis: Distribution by Trial Registration Year and Trial Phase, Since 2019
- Figure 9.6 Clinical Trial Analysis: Distribution by Trial Status
- Figure 9.7 Clinical Trial Analysis: Distribution by Patient Gender
- Figure 9.8 Clinical Trial Analysis: Distribution by Target Indication
- Figure 9.9 Clinical Trial Analysis: Distribution by Type of Trial Masking
- Figure 9.10 Clinical Trial Analysis: Distribution by Type of Intervention Model
- Figure 9.11 Clinical Trial Analysis: Distribution by Trial Purpose
- Figure 9.12 Clinical Trial Analysis: Distribution by Design Allocation
- Figure 9.13 Leading Industry Players: Distribution by Number of Registered Trials
- Figure 9.14 Leading Non-Industry Players: Distribution by Number of Registered Trials
- Figure 9.15 Clinical Trial Analysis: Distribution of Clinical Trials by Trial Status and Geography
- Figure 9.16 Clinical Trial Analysis: Distribution of Patients Enrolled by Trial Status and Geography
- Figure 10.1 Grants Analysis: Cumulative Year-wise Trend, Since 2019
- Figure 10.2 Grants Analysis: Cumulative Year-wise Trend of Grants by Amount Awarded (USD Million)
- Figure 10.3 Grants Analysis: Distribution by Funding Institute Center
- Figure 10.4 Grants Analysis: Distribution by Support Period
- Figure 10.5 Grants Analysis: Distribution by Funding Institute Center and Support Period
- Figure 10.6 Grants Analysis: Distribution by Type of Grant Application
- Figure 10.7 Grants Analysis: Distribution by Purpose of Grant Award
- Figure 10.8 Grants Analysis: Distribution by Activity Code (Series)
- Figure 10.9 Grants Analysis: Distribution by Activity Code
- Figure 10.10 Grants Analysis: Distribution by Study Section Involved
- Figure 10.11 Most Popular NIH Departments: Distribution by Number of Grants
- Figure 10.12 Prominent Program Officers: Distribution by Number of Grants
- Figure 10.13 Popular Recipient Organizations: Distribution by Number of Grants
- Figure 10.14 Popular Recipient Organizations: Distribution by Grant Amount (USD Million)
- Figure 10.15 Popular Recipient Organizations: Distribution by States in the US
- Figure 11.1 Patent Analysis: Distribution by Type of Patent
- Figure 11.2 Patent Analysis: Distribution by Patent Publication Year, Since 2019
- Figure 11.3 Patent Analysis: Distribution by Patent Application Year, Since Pre-2019
- Figure 11.4 Patent Analysis: Year-wise Distribution of Granted Patents and Patent Applications, Since 2019
- Figure 11.5 Patent Analysis: Distribution by Patent Jurisdiction
- Figure 11.6 Patent Analysis: Distribution by CPC Symbols
- Figure 11.7 Patent Analysis: Cumulative Year-wise Trend by Type of Applicant
- Figure 11.8 Leading Industry Players: Distribution by Number of Patents
- Figure 11.9 Leading Non-Industry Players: Distribution by Number of Patents
- Figure 11.10 Leading Patent Assignees: Distribution by Number of Patents
- Figure 11.11 Patent Benchmarking Analysis: Distribution of Patent Characteristics (CPC Codes) by Leading Industry Players
- Figure 11.12 Patent Benchmarking Analysis: Distribution of Leading Industry Players by Patent Characteristics (CPC Codes)
- Figure 11.13 Patent Analysis: Distribution by Patent Age
- Figure 11.14 Targeted Protein Degradation: Patent Valuation
- Figure 12.1 Publication Analysis: Distribution by Year of Publication, Since 2019
- Figure 12.2 Publication Analysis: Distribution by Type of Publication
- Figure 12.3 Key Journals: Distribution by Number of Publications
- Figure 12.4 Key Journals: Distribution by Journal Impact Factor
- Figure 12.5 Most Active Publisher: Distribution by Number of Publications
- Figure 12.6 Most Active Copyright Holder: Distribution by Number of Publications
- Figure 12.7 Publication Analysis: Emerging Focus Area
- Figure 12.8 Publication Analysis: Distribution by Therapeutic Area
- Figure 12.9 Publication Analysis: Distribution by Geography
- Figure 13.1 Partnerships and Collaborations: Cumulative Year-wise Trend, Since Pre-2016
- Figure 13.2 Partnerships and Collaborations: Distribution by Type of Partnership
- Figure 13.3 Partnerships and Collaborations: Distribution by Year and Type of Partnership, Since Pre-2016
- Figure 13.4 Partnerships and Collaborations: Distribution by Type of Partner
- Figure 13.5 Partnerships and Collaborations: Distribution by Type of Degrader
- Figure 13.6 Most Active Players: Distribution by Number of Partnerships
- Figure 13.7 Partnership and Collaborations: Local and International Agreements
- Figure 13.8 Partnerships and Collaborations: Intercontinental and Intracontinental Distribution
- Figure 14.1 Funding and Investment Analysis: Cumulative Year-wise Trend, Since 2014
- Figure 14.2 Funding and Investment Analysis: Distribution by Amount Invested, Since 2014 (USD Million)
- Figure 14.3 Funding and Investment Analysis: Distribution of Instances by Type of Funding, Since 2018
- Figure 14.4 Funding and Investment Analysis: Distribution by Amount Invested and Type of Funding (USD Million)
- Figure 14.5 Year-wise Distribution of Amount Invested by Type of Funding, Since 2018
- Figure 14.6 Funding and Investment Analysis: Distribution by Geography (Region)
- Figure 14.7 Funding and Investment Analysis: Distribution by Geography (Country)
- Figure 14.8 Most Active Players: Distribution by Number of Funding Instances
- Figure 14.9 Most Active Players: Distribution by Amount Invested (USD Million)
- Figure 14.10 Leading Investors: Distribution by Number of Funding Instances
- Figure 14.11 Funding and Investment Summary, Since 2018 (USD Million)
- Figure 15.1 Targeted Protein Degradation: Market Drivers
- Figure 15.2 Targeted Protein Degradation: Market Restraints
- Figure 15.3 Targeted Protein Degradation: Market Opportunities
- Figure 15.4 Targeted Protein Degradation: Market Challenges
- Figure 16.1 Global Targeted Protein Degradation Therapies Market, Till 2035 (USD Million)
- Figure 16.2 Global Targeted Protein Degradation Therapies Market, Till 2035: Conservative Scenario (USD Million)
- Figure 16.3 Global Targeted Protein Degradation Therapies Market, Till 2035: Optimistic Scenario (USD Million)
- Figure 17.1 Targeted Protein Degradation Therapies Market: Distribution by Type of Degrader
- Figure 17.2 Targeted Protein Degradation Therapies Market for SERDs: Forecasted Estimates (Till 2035) (USD Million)
- Figure 17.3 Targeted Protein Degradation Therapies Market for PROTACs: Forecasted Estimates (Till 2035) (USD Million)
- Figure 17.4 Targeted Protein Degradation Therapies Market for Molecular Glues: Forecasted Estimates (Till 2035) (USD Million)
- Figure 18.1 Targeted Protein Degradation Therapies Market: Distribution by Target Indication
- Figure 18.2 Targeted Protein Degradation Therapies Market for Breast Cancer: Forecasted Estimates (Till 2035) (USD Million)
- Figure 18.3 Targeted Protein Degradation Therapies Market for Multiple Myeloma: Forecasted Estimates (Till 2035) (USD Million)
- Figure 19.1 Targeted Protein Degradation Therapies Market: Distribution by Key Geographical Regions (USD Million)
- Figure 19.2 Targeted Protein Degradation Therapies Market in North America: Forecasted Estimates (Till 2035) (USD Million)
- Figure 19.3 Targeted Protein Degradation Therapies Market in the US: Forecasted Estimates (Till 2035) (USD Million)
- Figure 19.4 Targeted Protein Degradation Therapies Market in Canada: Forecasted Estimates (Till 2035) (USD Million)
- Figure 19.5 Targeted Protein Degradation Therapies Market in Europe: Forecasted Estimates (Till 2035) (USD Million)
- Figure 19.6 Targeted Protein Degradation Therapies Market in the UK: Forecasted Estimates (Till 2035) (USD Million)
- Figure 19.7 Targeted Protein Degradation Therapies Market in Germany: Forecasted Estimates (Till 2035) (USD Million)
- Figure 19.8 Targeted Protein Degradation Therapies Market in France: Forecasted Estimates (Till 2035) (USD Million)
- Figure 19.9 Targeted Protein Degradation Therapies Market in Spain: Forecasted Estimates (Till 2035) (USD Million)
- Figure 19.10 Targeted Protein Degradation Therapies Market in Italy: Forecasted Estimates (Till 2035) (USD Million)
- Figure 19.11 Targeted Protein Degradation Therapies Market in Asia-Pacific: Forecasted Estimates (Till 2035) (USD Million)
- Figure 19.12 Targeted Protein Degradation Therapies Market in China: Forecasted Estimates (Till 2035) (USD Million)
- Figure 19.13 Targeted Protein Degradation Therapies Market in South Korea: Forecasted Estimates (Till 2035) (USD Million)
- Figure 19.14 Targeted Protein Degradation Therapies Market in India: Forecasted Estimates (Till 2035) (USD Million)
- Figure 19.15 Targeted Protein Degradation Therapies Market in Japan: Forecasted Estimates (Till 2035) (USD Million)
- Figure 19.16 Targeted Protein Degradation Therapies Market in Australia: Forecasted Estimates (Till 2035) (USD Million)
- Figure 19.17 Targeted Protein Degradation Therapies Market in Rest of the World: Forecasted Estimates (Till 2035) (USD Million)
- Figure 19.18 Targeted Protein Degradation Therapies Market in Brazil: Forecasted Estimates (Till 2035) (USD Million)
- Figure 19.19 Targeted Protein Degradation Therapies Market in Israel: Forecasted Estimates (Till 2035) (USD Million)
- Figure 20.1 Targeted Protein Degradation Therapies Market: RAD1901 / Elacestrant / Orserdu Sales Forecast, Till 2035 (USD Million)
- Figure 20.2 Targeted Protein Degradation Therapies Market: Vepedegestrant / ARV-471 Sales Forecast, Till 2035 (USD Million)
- Figure 20.3 Targeted Protein Degradation Therapies Market: OP-1250 / OP-1250-301 / Palazestrant Sales Forecast, Till 2035 (USD Million)
- Figure 20.4 Targeted Protein Degradation Therapies Market: LY3484356 / Imlunestrant Sales Forecast, Till 2035 (USD Million)
- Figure 20.5 Targeted Protein Degradation Therapies Market: CC-92480 / BMS-986348 / Mezigdomide Sales Forecast, Till 2035 (USD Million)
- Figure 20.6 Targeted Protein Degradation Therapies Market: Camizestrant / AZD9833 Sales Forecast, Till 2035 (USD Million)
- Figure 21.1 Licensing Agreements: Distribution of Financial Components
- Figure 21.2 Licensing Agreements: Illustrative Scenario based Opportunity Estimation
- Figure 21.3 Global Targeted Protein Degradation Technologies Market, Historical Trends (Since 2018) and Forecasted Estimates (Till 2035) (USD Million)
- Figure 21.4 Global Targeted Protein Degradation Technologies Market, Till 2035: Conservative Scenario (USD Million)
- Figure 21.5 Global Targeted Protein Degradation Technologies Market, Till 2035: Optimistic Scenario (USD Million)
- Figure 21.6 Targeted Protein Degradation Technologies Market: Distribution by Type of Payment Model Employed
- Figure 21.7 Targeted Protein Degradation Technologies Market for Upfront Payments, Historical Trends (Since 2018) and Forecasted Estimates (Till 2035) (USD Million)
- Figure 21.8 Targeted Protein Degradation Technologies Market for Milestone Payments, Historical Trends (Since 2018) and Forecasted Estimates (Till 2035) (USD Million)
- Figure 23.1 Conclusion: Targeted Protein Degradation Therapies Market Landscape
- Figure 23.2 Conclusion: Targeted Protein Degradation Technologies Market Landscape
- Figure 23.3 Conclusion: Clinical Trial Analysis
- Figure 23.4 Conclusion: Grants Analysis
- Figure 23.5 Conclusion: Patent Analysis
- Figure 23.6 Conclusion: Publication Analysis
- Figure 23.7 Conclusion: Partnerships and Collaborations
- Figure 23.8 Conclusion: Funding and Investments
- Figure 23.9 Conclusion: Therapies Market Forecast and Opportunity Analysis
- Figure 23.10 Conclusion: Technologies Market Forecast and Opportunity Analysis
目次
TARGETED PROTEIN DEGRADATION MARKET: OVERVIEW
As per Roots Analysis, the global targeted protein degradation market is estimated to grow from USD 0.48 billion in the current year to USD 6.94 billion by 2035, at a CAGR of 32% during the forecast period, till 2035.
The market sizing and opportunity analysis has been segmented across the following parameters:
Type of Degrader
- SERD
- PROTAC
- Molecular Glue
Target Indication
- Breast Cancer
- Multiple Myeloma
Key Geographical Regions
- North America (US and Canada)
- Europe (UK, Germany, France, Italy and Spain)
- Asia-Pacific (China, South Korea, Japan, India and Australia)
- Rest of the World (Brazil and Israel)
TARGETED PROTEIN DEGRADATION MARKET: GROWTH AND TRENDS
Targeted protein degradation (TPD) is an emerging therapeutic modality that has the potential to enable the treatment of difficult-to-treat diseases. While conventional medicines, such as small molecule inhibitors and monoclonal antibodies, target less than 20% of the proteome, TPD provides a novel approach to access the vast majority of unexplored proteins within the proteome. Through TPD, a disease can be addressed by controlling the amount of harmful protein rather than trying to modulate or inhibit its function. The control of protein levels is accomplished with a small molecule drug, called a protein degrader. TPD is a bifunctional small molecule that recruits E3 ubiquitin ligases to the protein of interest and mediates its ubiquitination and subsequent proteolysis by the proteasome.
Small molecule-mediated selective TPD has several advantages over traditional drug discovery strategies. One of the primary advantages is the high degree of target specificity that can be rapidly validated by leveraging the multiple layers of selectivity in the cellular machinery. Moreover, owing to the fact that the TPD degrader molecules cannot be destroyed, they can cause the destruction of many copies of harmful proteins and reduce systemic drug exposure. In addition, it can counteract increased target protein expression by inhibiting the protein function. It is worth noting that a single protein degrader has the ability to potentially eliminate multiple disease-causing proteins through proteasome degradation of the target protein. Owing to the above-mentioned advantages and the ongoing pace of technological advancements, the targeted protein degradation market is poised to experience noteworthy growth during the forecast period.
TARGETED PROTEIN DEGRADATION MARKET: KEY INSIGHTS
The report delves into the current state of the targeted protein degradation market and identifies potential growth opportunities within industry. Some key findings from the report include:
- 285+ targeted protein degradation therapies are either approved or being investigated in different stages of development; the market landscape features the presence of both established players and new entrants.
- Over 20% of the targeted protein degraders being evaluated are molecular glues; of these, more than 70% are intended for the treatment of oncological disorders.
- Over 35% of the technologies are focused on developing PROTACs; of these, 38% have the capability to identify the targets utilizing CADD analysis.
- At present, around 85 innovative targeted protein degradation technologies are available for developing stable and efficacious degraders; further, majority of the technology providers are start-ups / small businesses.
- Around 250 clinical trials (with around 63,000 enrolled patients) are currently underway to investigate targeted protein degradation therapies intended for treatment of various diseases, across different geographies.
- Since 2019, grants worth over USD 165 million have been awarded by NIH; ~80% of these grants were awarded for a support period of 1-4 years.
- In the last five years, several articles have been published in various high-impact journals; such publications have garnered more interest in the Asia-Pacific region.
- More than 985 patents have been filed for targeted protein degraders and related technologies by industry and non-industry players, to protect intellectual property generated within this field.
- The rising interest is reflected in the wide array of partnerships established between various stakeholders in the recent past; 25% of the deals were focused on research and development of novel protein degraders.
- Several investors have realized the opportunity within the domain of targeted protein degradation and invested around USD 13.5 billion across various funding rounds in the past six years.
- Owing to the protein degraders ability to degrade the undruggable targets selectively, the targeted protein degradation therapies market is anticipated to witness an annualized growth of 32% over the next decade.
- The estimated market opportunity is projected to be distributed across different countries, especially in the US, France, Spain, the UK and China.
TARGETED PROTEIN DEGRADATION MARKET: KEY SEGMENTS
SERD Segment Occupies the Largest Share of the Targeted Protein Degradation Market
Based on the type of degrader, the market is segmented into SERD, PROTAC and molecular glue. At present, the SERD segment holds the maximum share of the targeted protein degradation market owing to the approval of elacestrant (ORSERDU), an oral SERD for metastatic breast cancer. Additionally, the PROTAC segment is likely to grow at a faster pace during the forecasted period.
By Target Indication, Breast Cancer is the Fastest Growing Segment of the Global Targeted Protein Degradation Market
Based on the target indication, the market is segmented into breast cancer and multiple myeloma. Currently, the breast cancer segment captures the highest proportion of the targeted protein degradation market. This trend is likely to remain the same in the future owing to the increasing prevalence of breast cancer, with over 12.5% of all newly diagnosed cases. Further, targeted protein degradation market for the breast cancer segment is likely to grow at a relatively higher CAGR during the forecast period.
North America Accounts for the Largest Share of the Market
Based on key geographical regions, the market is segmented into North America, Europe, Asia-Pacific and Rest of the World. Currently, North America dominates the targeted protein degradation market and accounts for the largest revenue share. Further, the market in Asia-Pacific is expected to grow at a higher CAGR in the coming years.
Example Players in the Targeted Protein Degradation Market
- Arvinas
- AstraZeneca
- BeiGene
- Bristol-Myers Squibb
- C4 Therapeutics
- Eisai Therapeutics
- InnoCare Pharma
- Kangpu Biopharmaceuticals
- Kintor Pharmaceutical
- Loxo Oncology
- Medivir
- Monte Rosa Therapeutics
- Olema Oncology
- Radius Health
- Ranok Therapeutics
- Roche
- Sanofi
- Zentalis Pharmaceuticals
TARGETED PROTEIN DEGRADATION MARKET: RESEARCH COVERAGE
- Market Sizing and Opportunity Analysis: The report features an in-depth analysis of the targeted protein degradation market, focusing on key market segments, including [A] type of degrader, [B] target indication, and [C] key geographical regions.
- Targeted Protein Degradation Therapies Market Landscape: A comprehensive evaluation of the companies engaged in targeted protein degradation therapies market, based on several relevant parameters, such as [A] stage of development, [B] type of degrader, [C] biological target, [D] target enzyme, [E] target indication and [F] therapeutic area. Additionally, a comprehensive evaluation of the targeted protein degradation therapy developers, based on several relevant parameters, such as [G] year of establishment, [H] company size, [I] location of headquarters and [J] most active players.
- Targeted Protein Degradation Technologies Market Landscape: A comprehensive evaluation of the companies engaged in targeted protein degradation technologies market, based on several relevant parameters, such as [A] type of degrader developed, [B] protein degradation pathway, [C] site of degraded protein, [D] therapeutic area, [E] discovery step supported and [F] availability of computational modeling ability. Additionally, a comprehensive evaluation of the companies offering targeted protein degradation technologies, based on several relevant parameters, such as [G] year of establishment, [H] company size and [I] location of headquarters.
- Company Profiles: In-depth profiles of key companies engaged in the targeted protein degradation market, focusing on [A] overview of the company, [B] financial information (if available), [C] technology portfolio, [D] pipeline overview and [E] recent developments and an [F] informed future outlook.
- Clinical Trial Analysis: An insightful analysis of clinical trials related to targeted protein degradation, based on several parameters, such as [A] trial registration year, [B] number of patients enrolled, [C] trial phase, [D] trial status, [E] patient gender, [F] target indication, [G] study design, [H] most active sponsor / collaborator and [I] geography.
- Grants Analysis: A comprehensive assessment of grants that have been awarded to research institutes in the targeted protein degradation domain, based on various relevant parameters, such as [A] year of grant award, [B] amount awarded, [C] funding institute centers, [D] support period, [E] type of grant application, [F] purpose of grant award, [G] activity code, [H] study section involved, [I] popular NIH departments, [J] prominent program officers, [k] popular recipient organizations and [L] distribution of popular recipient organizations by states in the US.
- Patent Analysis: An in-depth analysis of patents filed / granted till date in the targeted protein degradation domain, based on various relevant parameters, such as [A] type of patent, [B] patent application year, [C] patent publication year, [D] patent jurisdiction, [E] CPC symbols, [F] type of applicant, [G] individual patent assignees, [H] patent age, [I] patent benchmarking, and [J] patent valuation analysis.
- Publication Analysis: An insightful analysis of peer-reviewed scientific articles related to research on targeted protein degradation, based on various relevant parameters, such as [A] year of publication, [B] type of publication, [C] key journal, [D] most active publisher, [E] most active copyright holder, [F] most popular keywords, [G] therapeutic area and [H] key geographical regions.
- Partnerships and Collaborations: An insightful analysis of the deals inked by stakeholders in the targeted protein degradation market, based on several parameters, such as [A] year of partnership, [B] type of partnership, [C] type of partner, [D] type of degrader, [E] most active players and [F] geographical distribution of the partnership activity.
- Funding and Investments: An in-depth analysis of the fundings raised by targeted protein degradation companies, based on relevant parameters, such as [A] year-wise trend of funding instances, [B] amount invested, [C] type of funding, [D] geographical analysis, [E] leading players and [F] leading investors.
- Market Impact Analysis: A thorough analysis of various factors, such as drivers, restraints, opportunities, and existing challenges that are likely to impact market growth.
KEY QUESTIONS ANSWERED IN THIS REPORT
- How many companies are currently engaged in this market?
- Which are the leading companies in this market?
- What factors are likely to influence the evolution of this market?
- What is the current and future market size?
- What is the CAGR of this market?
- How is the current and future market opportunity likely to be distributed across key market segments?
REASONS TO BUY THIS REPORT
- The report provides a comprehensive market analysis, offering detailed revenue projections of the overall market and its specific sub-segments. This information is valuable to both established market leaders and emerging entrants.
- Stakeholders can leverage the report to gain a deeper understanding of the competitive dynamics within the market. By analyzing the competitive landscape, businesses can make informed decisions to optimize their market positioning and develop effective go-to-market strategies.
- The report offers stakeholders a comprehensive overview of the market, including key drivers, barriers, opportunities, and challenges. This information empowers stakeholders to stay abreast of market trends and make data-driven decisions to capitalize on growth prospects.
ADDITIONAL BENEFITS
- Complimentary PPT Insights Packs
- Complimentary Excel Data Packs for all Analytical Modules in the Report
- 15% Free Content Customization
- Detailed Report Walkthrough Session with Research Team
- Free Updated report if the report is 6-12 months old or older
TABLE OF CONTENTS
1. PREFACE
1.1. Market Overview
- 1.2. Market Share Insights
- 1.3. Key Market Insights
- 1.4. Report Coverage
- 1.5. Frequently Asked Questions
- 1.6. Chapter Outlines
2. RESEARCH METHODOLOGY
- 2.1. Chapter Overview
- 2.2. Research Assumptions
- 2.3. Project Methodology
- 2.4. Forecast Methodology
- 2.5. Robust Quality Control
- 2.6. Key Market Segmentations
- 2.7. Key Considerations
- 2.7.1. Demographics
- 2.7.2. Economic Factors
- 2.7.3. Government Regulations
- 2.7.4. Supply Chain
- 2.7.5. COVID Impact
- 2.7.6. Market Access
- 2.7.7. Healthcare Policies
- 2.7.8. Industry Consolidation
3. ECONOMIC AND OTHER PROJECT SPECIFIC CONSIDERATIONS
- 3.1. Chapter Overview
- 3.2. Market Dynamics
- 3.2.1. Time Period
- 3.2.1.1. Historical Trends
- 3.2.1.2. Current and Future Estimates
- 3.2.2. Currency Coverage and Foreign Exchange Rate
- 3.2.2.1. Major Currencies Affecting the Market
- 3.2.2.2. Factors affecting Currency Fluctuations and Foreign Exchange Rates
- 3.2.2.3. Impact of Foreign Exchange Rate Volatility on Market
- 3.2.2.4. Strategies For Mitigating Foreign Exchange Risk
- 3.2.3. Trade Policies
- 3.2.3.1. Impact of Trade Barriers on the Market
- 3.2.3.2. Strategies for Mitigating the Risks Associated with Trade Barriers
- 3.2.4. Recession
- 3.2.4.1. Historical Analysis of Past Recessions and Lessons Learnt
- 3.2.4.2. Assessment of Current Economic Conditions and Potential Impact on the Market
- 3.2.5. Inflation
- 3.2.5.1. Measurement and Analysis of Inflationary Pressures in the Economy
- 3.2.5.2. Potential Impact of Inflation on the Market Evolution
- 3.2.1. Time Period
4. EXECUTIVE SUMMARY
5. INTRODUCTION
- 5.1. Chapter Overview
- 5.2. Overview of Targeted Protein Degradation
- 5.2.1. Historical Evolution of Targeted Protein Degraders
- 5.3. Targeted Protein Degrader Pathway
- 5.4. Types of Protein Degraders
- 5.4.1. Proteolysis Targeting Chimeras (PROTACs)
- 5.4.2. Endosome Targeting Chimeras (ENDTACs)
- 5.4.3. Photochemically Targeted Chimeras (PHOTACs)
- 5.4.4. Hydrophobic Tags
- 5.4.5. Immunomodulatory Imide Drugs (IMiDs)
- 5.4.6. Molecular Glues
- 5.4.7. Selective Hormone Receptor Degraders (SHRDs)
- 5.4.8. Specific and Nongenetic inhibitor-of-apoptosis proteins (IAP)- Dependent Protein Erasers (SNIPERs)
- 5.4.9. DUB Inhibitors
- 5.4.10. Other Protein Degraders
- 5.5. Targeted Therapeutic Areas
- 5.6. Benefits and Challenges Associated with Targeted Protein Degradation
- 5.7. Future Perspectives
6. MARKET LANDSCAPE: TARGETED PROTEIN DEGRADATION THERAPIES
- 6.1. Chapter Overview
- 6.2. Targeted Protein Degradation Therapies: Overall Market Landscape
- 6.2.1. Analysis by Stage of Development
- 6.2.2. Analysis by Type of Degrader
- 6.2.3. Analysis by Biological Target
- 6.2.4. Analysis by Target Enzyme
- 6.2.5. Analysis by Target Indication
- 6.2.6. Analysis by Therapeutic Area
- 6.3. Targeted Protein Degradation Therapy Developers: Overall Market Landscape
- 6.3.1. Analysis by Year of Establishment
- 6.3.2. Analysis by Company Size
- 6.3.3. Analysis by Location of Headquarters (Region)
- 6.3.4. Analysis by Year of Establishment and Location of Headquarters (Region)
- 6.3.5. Analysis by Company Size and Location of Headquarters (Region)
- 6.3.6. Most Active Developers: Distribution by Number of Therapies and Stage of Development
7. MARKET LANDSCAPE: TARGETED PROTEIN DEGRADATION TECHNOLOGIES
- 7.1. Chapter Overview
- 7.2. Targeted Protein Degradation Technologies: Overall Market Landscape
- 7.2.1. Analysis by Type of Degrader Developed
- 7.2.2. Analysis by Protein Degradation Pathway
- 7.2.3. Analysis by Site of Degraded Protein
- 7.2.4. Analysis by Therapeutic Area
- 7.2.5. Analysis by Discovery Step Supported
- 7.2.6. Analysis by Availability of Computational Modeling Ability
- 7.2.7. Analysis by Year of Establishment
- 7.2.8. Analysis by Company Size
- 7.2.9. Analysis by Location of Headquarters (Region)
- 7.2.10. Analysis by Year of Establishment and Location of Headquarters (Region)
- 7.2.11. Analysis by Company Size and Location of Headquarters (Region)
8. COMPANY PROFILES
- 8.1. Chapter Overview
- 8.2. Detailed Company Profiles of Prominent Players
- 8.2.1. Arvinas
- 8.2.1.1. Company Overview
- 8.2.1.2. Financial Information
- 8.2.1.3. Technology Portfolio
- 8.2.1.4. Pipeline Overview
- 8.2.1.5. Recent Developments and Future Outlook
- 8.2.2. Bristol-Myers Squibb
- 8.2.2.1. Company Overview
- 8.2.2.2. Financial Information
- 8.2.2.3. Technology Portfolio
- 8.2.2.4. Pipeline Overview
- 8.2.2.5. Recent Developments and Future Outlook
- 8.2.3. C4 Therapeutics
- 8.2.3.1. Company Overview
- 8.2.3.2. Financial Information
- 8.2.3.3. Technology Portfolio
- 8.2.3.4. Pipeline Overview
- 8.2.3.5. Recent Developments and Future Outlook
- 8.2.4. Loxo Oncology
- 8.2.4.1. Company Overview
- 8.2.4.2. Pipeline Overview
- 8.2.4.3. Recent Developments and Future Outlook
- 8.2.5. Olema Oncology
- 8.2.5.1. Company Overview
- 8.2.5.2. Pipeline Overview
- 8.2.5.3. Recent Developments and Future Outlook
- 8.2.6. Radius Health
- 8.2.6.1. Company Overview
- 8.2.6.2. Financial Information
- 8.2.6.3. Pipeline Overview
- 8.2.6.4. Recent Developments and Future Outlook
- 8.2.7. AstraZeneca
- 8.2.7.1. Company Overview
- 8.2.7.2. Financial Information
- 8.2.7.3. Pipeline Overview
- 8.2.7.4. Recent Developments and Future Outlook
- 8.2.8. Roche
- 8.2.8.1. Company Overview
- 8.2.8.2. Financial Information
- 8.2.8.3. Pipeline Overview
- 8.2.8.4. Recent Developments and Future Outlook
- 8.2.1. Arvinas
- 8.3. Short Profiles of Other Prominent Players
- 8.3.1. BeiGene
- 8.3.1.1. Company Overview
- 8.3.1.2. Pipeline Overview
- 8.3.2. InnoCare Pharma
- 8.3.2.1. Company Overview
- 8.3.2.2. Technology Portfolio
- 8.3.2.3. Pipeline Overview
- 8.3.3. Kangpu Biopharmaceuticals
- 8.3.3.1. Company Overview
- 8.3.3.2. Technology Portfolio
- 8.3.3.3. Pipeline Overview
- 8.3.4. Kintor Pharmaceuticals
- 8.3.4.1. Company Overview
- 8.3.4.2. Technology Portfolio
- 8.3.4.3. Pipeline Overview
- 8.3.5. Medivir
- 8.3.5.1. Company Overview
- 8.3.5.2. Technology Portfolio
- 8.3.5.3. Pipeline Overview
- 8.3.6. Monte Rosa Therapeutics
- 8.3.6.1. Company Overview
- 8.3.6.2. Technology Portfolio
- 8.3.6.3. Pipeline Overview
- 8.3.7. Ranok Therapeutics
- 8.3.7.1. Company Overview
- 8.3.7.2. Technology Portfolio
- 8.3.7.3. Pipeline Overview
- 8.3.8. Sanofi
- 8.3.8.1. Company Overview
- 8.3.8.2. Pipeline Overview
- 8.3.9. Zentalis Pharmaceuticals
- 8.3.9.1. Company Overview
- 8.3.9.2. Technology Portfolio
- 8.3.9.3. Pipeline Overview
- 8.3.10. Eisai Therapeutics
- 8.3.10.1. Company Overview
- 8.3.10.2. Pipeline Overview
- 8.3.1. BeiGene
9. CLINICAL TRIAL ANALYSIS
- 9.1. Chapter Overview
- 9.2. Scope and Methodology
- 9.3. Targeted Protein Degradation: Clinical Trial Analysis
- 9.3.1. Analysis by Trial Registration Year
- 9.3.2. Analysis of Number of Patients Enrolled by Trial Registration Year
- 9.3.3. Analysis by Trial Phase
- 9.3.4. Analysis of Number of Patients Enrolled by Trial Phase
- 9.3.5. Analysis by Trial Registration Year and Trial Phase
- 9.3.6. Analysis by Trial Status
- 9.3.7. Analysis by Patient Gender
- 9.3.8. Analysis by Target Indication
- 9.3.9. Analysis by Study Design
- 9.3.9.1. Analysis by Type of Trial Masking
- 9.3.9.2. Analysis by Type of Intervention Model
- 9.3.9.3. Analysis by Trial Purpose
- 9.3.9.4. Analysis by Design Allocation
- 9.3.10. Most Active Sponsor / Collaborator: Analysis by Number of Registered Trials
- 9.3.10.1. Analysis by Leading Industry Players
- 9.3.10.2. Analysis by Leading Non-Industry Players
- 9.3.11. Analysis by Geography
- 9.3.11.1. Analysis of Clinical Trials by Trial Status and Geography
- 9.3.11.2. Analysis of Patients Enrolled by Trial Status and Geography
10. GRANTS ANALYSIS
- 10.1. Chapter Overview
- 10.2. Scope and Methodology
- 10.3. Targeted Protein Degradation: Grants Analysis
- 10.3.1. Analysis by Year of Grant Award
- 10.3.2. Analysis by Amount Awarded
- 10.3.3. Analysis by Funding Institute Center
- 10.3.4. Analysis by Support Period
- 10.3.5. Analysis by Funding Institute Center and Support Period
- 10.3.6. Analysis by Type of Grant Application
- 10.3.7. Analysis by Purpose of Grant Award
- 10.3.8. Analysis by Activity Code
- 10.3.9. Analysis by Study Section Involved
- 10.3.10. Most Popular NIH Departments: Analysis by Number of Grants
- 10.3.11. Prominent Program Officers: Analysis by Number of Grants
- 10.3.12. Popular Recipient Organizations: Analysis by Number of Grants
- 10.3.13. Popular Recipient Organizations: Analysis by Grant Amount
- 10.3.14. Popular Recipient Organizations: Analysis by States in the US
11. PATENT ANALYSIS
- 11.1. Chapter Overview
- 11.2. Scope and Methodology
- 11.3. Targeted Protein Degradation: Patents Analysis
- 11.3.1. Analysis by Patent Publication Year
- 11.3.2. Analysis by Patent Application Year
- 11.3.3. Analysis of Granted Patents and Patent Applications by Publication Year
- 11.3.4. Analysis by Patent Jurisdiction
- 11.3.5. Analysis by CPC Symbols
- 11.3.6. Analysis by Type of Applicant
- 11.3.7. Leading Industry Players: Analysis by Number of Patents
- 11.3.8. Leading Non-Industry Players: Analysis by Number of Patents
- 11.3.9. Leading Patent Assignees: Analysis by Number of Patents
- 11.4. Patent Benchmarking Analysis
- 11.4.1. Analysis of Patent Characteristics (CPC Codes) by Leading Industry Players
- 11.5. Patent Valuation
- 11.6. Leading Patents by Number of Citations
12. PUBLICATION ANALYSIS
- 12.1. Chapter Overview
- 12.2. Scope and Methodology
- 12.3. Targeted Protein Degradation: Publication Analysis
- 12.3.1. Analysis by Year of Publication
- 12.3.2. Analysis by Type of Publication
- 12.3.3. Key Journals: Analysis by Number of Publications
- 12.3.4. Key Journals: Analysis by Journal Impact Factor
- 12.3.5. Most Active Publisher: Analysis by Number of Publications
- 12.3.6. Most Active Copyright Holder: Analysis by Number of Publications
- 12.3.7. Analysis by Emerging Focus Area
- 12.3.8. Analysis by Therapeutic Area
- 12.3.9. Analysis by Geography
13. PARTNERSHIPS AND COLLABORATIONS
- 13.1. Chapter Overview
- 13.2. Partnership Models
- 13.3. Targeted Protein Degradation: Partnerships and Collaborations
- 13.3.1. Analysis by Year of Partnership
- 13.3.2. Analysis by Type of Partnership
- 13.3.3. Analysis by Year and Type of Partnership
- 13.3.4. Analysis by Type of Partner
- 13.3.5. Analysis by Type of Degrader
- 13.3.6. Most Active Players: Analysis by Number of Partnerships
- 13.4. Analysis by Geography
- 13.4.1. Local and International Agreements
- 13.4.2. Intercontinental and Intracontinental Agreements
14. FUNDING AND INVESTMENTS
- 14.1. Chapter Overview
- 14.2. Funding Models
- 14.3. Targeted Protein Degradation: Funding and Investments
- 14.3.1. Analysis by Year of Funding
- 14.3.2. Analysis by Amount Invested
- 14.3.3. Analysis by Type of Funding
- 14.3.4. Analysis by Amount Invested and Type of Funding
- 14.3.5. Analysis of Amount Invested by Year and Type of Funding
- 14.3.6. Analysis by Geography
- 14.3.7. Most Active Players
- 14.3.7.1. Analysis by Number of Funding Instances
- 14.3.7.2. Analysis by Amount Invested
- 14.3.8. Leading Investors: Analysis by Number of Funding Instances
- 14.4. Concluding Remarks
15. MARKET IMPACT ANALYSIS: DRIVERS, RESTRAINTS, OPPORTUNITIES AND CHALLENGES
- 15.1. Chapter Overview
- 15.2. Market Drivers
- 15.3. Market Restraints
- 15.4. Market Opportunities
- 15.5. Market Challenges
- 15.6. Conclusion
16. GLOBAL TARGETED PROTEIN DEGRADATION THERAPIES MARKET
- 16.1. Chapter Overview
- 16.2. Key Assumptions and Methodology
- 16.3. Global Targeted Protein Degradation Therapies Market, Forecasted Estimates (Till 2035)
- 16.3.1. Scenario Analysis
- 16.3.1.1. Conservative Scenario
- 16.3.1.2. Optimistic Scenario
- 16.3.1. Scenario Analysis
- 16.4. Key Market Segmentations
17. TARGETED PROTEIN DEGRADATION THERAPIES MARKET, BY TYPE OF DEGRADER
- 17.1. Chapter Overview
- 17.2. Key Assumptions and Methodology
- 17.3. Targeted Protein Degradation Therapies Market: Distribution by Type of Degrader
- 17.3.1. Targeted Protein Degradation Therapies Market for SERDs: Forecasted Estimates (Till 2035)
- 17.3.2. Targeted Protein Degradation Therapies Market for PROTACs: Forecasted Estimates (Till 2035)
- 17.3.3. Targeted Protein Degradation Therapies Market for Molecular Glues: Forecasted Estimates (Till 2035)
- 17.4. Data Triangulation and Validation
18. TARGETED PROTEIN DEGRADATION THERAPIES MARKET, BY TARGET INDICATION
- 18.1. Chapter Overview
- 18.2. Key Assumptions and Methodology
- 18.3. Targeted Protein Degradation Therapies Market: Distribution by Target Indication
- 18.3.1. Targeted Protein Degradation Therapies Market for Breast Cancer: Forecasted Estimates (Till 2035)
- 18.3.2. Targeted Protein Degradation Therapies Market for Multiple Myeloma: Forecasted Estimates (Till 2035)
- 18.4. Data Triangulation and Validation
19. TARGETED PROTEIN DEGRADATION THERAPIES MARKET, BY KEY GEOGRAPHICAL REGIONS
- 19.1. Chapter Overview
- 19.2. Key Assumptions and Methodology
- 19.3. Targeted Protein Degradation Therapies Market: Distribution by Key Geographical Regions
- 19.3.1. Targeted Protein Degradation Therapies Market in North America: Forecasted Estimates (Till 2035)
- 19.3.1.1. Targeted Protein Degradation Therapies Market in US: Forecasted Estimates (Till 2035)
- 19.3.1.2. Targeted Protein Degradation Therapies Market in Canada: Forecasted Estimates (Till 2035)
- 19.3.2. Targeted Protein Degradation Therapies Market in Europe: Forecasted Estimates (Till 2035)
- 19.3.2.1. Targeted Protein Degradation Therapies Market in UK: Forecasted Estimates (Till 2035)
- 19.3.2.2. Targeted Protein Degradation Therapies Market in Germany: Forecasted Estimates (Till 2035)
- 19.3.2.3. Targeted Protein Degradation Therapies Market in France: Forecasted Estimates (Till 2035)
- 19.3.2.4. Targeted Protein Degradation Therapies Market in Italy: Forecasted Estimates (Till 2035)
- 19.3.2.5. Targeted Protein Degradation Therapies Market in Spain: Forecasted Estimates (Till 2035)
- 19.3.3. Targeted Protein Degradation Therapies Market in Asia-Pacific: Forecasted Estimates (Till 2035)
- 19.3.3.1. Targeted Protein Degradation Therapies Market in China: Forecasted Estimates (Till 2035)
- 19.3.3.2. Targeted Protein Degradation Therapies Market in South Korea: Forecasted Estimates (Till 2035)
- 19.3.3.3. Targeted Protein Degradation Therapies Market in India: Forecasted Estimates (Till 2035)
- 19.3.3.4. Targeted Protein Degradation Therapies Market in Japan: Forecasted Estimates (Till 2035)
- 19.3.3.5. Targeted Protein Degradation Therapies Market in Australia: Forecasted Estimates (Till 2035)
- 19.3.4. Targeted Protein Degradation Therapies Market in Rest of the World: Forecasted Estimates (Till 2035)
- 19.3.4.1. Targeted Protein Degradation Therapies Market in Brazil: Forecasted Estimates (Till 2035)
- 19.3.4.2. Targeted Protein Degradation Therapies Market in Israel: Forecasted Estimates (Till 2035)
- 19.3.1. Targeted Protein Degradation Therapies Market in North America: Forecasted Estimates (Till 2035)
- 19.5. Data Triangulation and Validation
20. TARGETED PROTEIN DEGRADATION THERAPIES MARKET, SALES FORECAST OF DRUGS
- 20.1. Chapter Overview
- 20.2. Key Assumptions and Methodology
- 20.3. Commercialized Targeted Protein Degradation Therapies Market: Sales Forecast
- 20.3.1. RAD1901 / Elacestrant / Orserdu Sales Forecast
- 20.4. Phase III Targeted Protein Degradation Therapies Market: Sales Forecast
- 20.4.1. Vepdegestrant / ARV-471 Sales Forecast
- 20.4.2. Camizestrant / AZD9833 Sales Forecast
- 20.4.3. CC-92480 / BMS-986348 / Mezigdomide Sales Forecast
- 20.4.4. LY3484356 / Imlunestrant Sales Forecast
- 20.4.5. OP-1250 / OP-1250-301 / Palazestrant Sales Forecast
- 20.5. Data Triangulation and Validation
21. GLOBAL TARGETED PROTEIN DEGRADATION TECHNOLOGIES MARKET
- 21.1. Chapter Overview
- 21.2. Key Assumptions
- 21.3. Forecast Methodology
- 21.4. Global Targeted Protein Degradation Technologies Market, Historical Trends (Since 2018) and Forecasted Estimates (Till 2035)
- 21.4.1. Scenario Analysis
- 21.4.1.1. Conservative Scenario
- 21.4.1.2. Optimistic Scenario
- 21.4.1. Scenario Analysis
- 21.5. Targeted Protein Degradation Technologies Market: Distribution by Type of Payment Model Employed
- 21.5.1. Targeted Protein Degradation Technologies Market for Upfront Payments: Historical Trends (Since 2018) and Forecasted Estimates (Till 2035)
- 21.5.2. Targeted Protein Degradation Technologies Market for Milestone Payments: Historical Trends (Since 2018) and Forecasted Estimates (Till 2035)
- 21.6. Data Triangulation and Validation
22. EXECUTIVE INSIGHTS
- 22.1. Chapter Overview
- 22.2. GlycoEra
- 22.2.1. Company Snapshot
- 22.2.2. Interview Transcript: Ganesh Kaundinya, Chief Executive Officer and President
- 22.3. Polyprox Therapeutics
- 22.3.1. Company Snapshot
- 22.3.2. Interview Transcript: Laura Itzhaki, Chief Scientific Officer and Founder
- 22.4. Xios Therapeutics
- 22.4.1. Company Snapshot
- 22.4.2. Interview Transcript: Louise Bergeron, Former Chief Scientific Officer and Former Vice President, Research
- 22.5. Mission Therapeutics
- 22.5.1. Company Snapshot
- 22.5.2. Interview Transcript: Paul Wallace, Former Chief Business Officer
- 22.6. Ubiquigent
- 22.6.1. Company Snapshot
- 22.6.2. Interview Transcript: Jason Brown, Former Scientific and Business Development Director
- 22.7. Almac Discovery
- 22.7.1. Company Snapshot
- 22.7.2. Interview Transcript: Martin Wales, Former Vice President, Business Development and Licensing and Gerald Gavory, Former Vice President, Biology
- 22.8. University of Delaware
- 22.8.1. Company Snapshot
- 22.8.2. Interview Transcript: Zhihao Zhuang (Professor)
- 22.9 Francis Crick Institute
- 22.9.1. Company Snapshot
- 22.9.2. Interview Transcript: Katrin Rittinger (Group Leader)
- 22.10 Anonymous
- 22.10.1. Interview Transcript: Chief Scientific Officer
- 22.11 Anonymous
- 22.11.1. Interview Transcript: Director of Oncology Research
23. CONCLUSION
24. APPENDIX 1: TABULATED DATA
25. APPENDIX 2: LIST OF COMPANIES AND ORGANIZATIONS
26. APPENDIX 3: LIST OF FUNDING AND INVESTMENTS
- 発行日
- 発行
- Roots Analysis
- ページ情報
- 英文 450 Pages
- 納期
- 即日から翌営業日


