表紙:細胞治療製造市場:産業動向と世界予測 (~2035年) - 細胞治療タイプ別、細胞の由来別、事業規模別、製造業者タイプ別、地域別
市場調査レポート
商品コード
1549409

細胞治療製造市場:産業動向と世界予測 (~2035年) - 細胞治療タイプ別、細胞の由来別、事業規模別、製造業者タイプ別、地域別

Cell Therapy Manufacturing Market : Industry Trends and Global Forecasts, Till 2035 - Distribution by Type of Cell Therapy, Source of Cells, Scale of Operation, Type of Manufacturer and Geography

出版日: | 発行: Roots Analysis | ページ情報: 英文 678 Pages | 納期: 即日から翌営業日

● お客様のご希望に応じて、既存データの加工や未掲載情報(例:国別セグメント)の追加などの対応が可能です。  詳細はお問い合わせください。

価格
価格表記: USDを日本円(税抜)に換算
本日の銀行送金レート: 1USD=148.12円
細胞治療製造市場:産業動向と世界予測 (~2035年) - 細胞治療タイプ別、細胞の由来別、事業規模別、製造業者タイプ別、地域別
出版日: 2024年07月16日
発行: Roots Analysis
ページ情報: 英文 678 Pages
納期: 即日から翌営業日
  • 全表示
  • 概要
  • 図表
  • 目次
概要

細胞治療製造の市場規模は2024年に49億米ドルになるとみられ、予測期間の2024年~2035年に9.90%のCAGRで拡大すると予測されています。

現在、300以上の細胞治療が様々な臨床開発段階にあり、2019年以降、これらの候補に焦点を当てた1,930以上の臨床研究が開始されています。これらの商業化された細胞治療のいくつかは、ヘルスケア分野のトップセラー医薬品として浮上しています。例えば、Gilead SciencesはYescarta(R)が15億米ドルを超える売上を達成し、Tecartus(R)は2023年に3億7,000万米ドルの売上を達成したと報告しています。

細胞治療の臨床的有用性と治療の可能性を裏付ける多くの証拠があることから、利害関係者は現在、これらの治療薬の製造プロセスの最適化に注力しています。最近の動向では、数多くの高度な自動化技術やプラットフォームが開発され、製造コストを大幅に引き下げる可能性を示しています。注目すべき技術革新の一つであるGMP-In-A Boxは、スループットの向上、バッチ運転間のアイドル時間の短縮、手作業の減少など、いくつかの利点を提供しています。しかし、細胞治療製造には複雑なステップが伴うため、自動化プロセス全体が課題に直面しています。さらに、この分野の専門的なインフラや訓練を受けた人材の不足が、このセグメントの成長に大きな障害となっています。

当レポートでは、世界の細胞治療製造市場について調査し、市場の概要とともに、細胞治療タイプ別、細胞の由来別、事業規模別、製造業者タイプ別、地域別の動向、および市場に参入する企業のプロファイルなどを提供しています。

目次

第1章 序文

第2章 調査手法

第3章 経済およびその他のプロジェクト特有の考慮事項

第4章 エグゼクティブサマリー

第5章 イントロダクション

第6章 細胞治療メーカー(業界参入企業):市場情勢

第7章 細胞治療メーカー(非業界参入企業):市場情勢

第8章 規制状況

第9章 課題克服のためのロードマップ

第10章 細胞治療製造の自動化技術

  • 章の概要
  • 細胞治療製造プロセスの自動化
  • 成長の促進要因と障害
  • ケーススタディ
  • GMPインアボックス
  • 自動化および閉鎖型細胞治療処理システムのリスト
  • 手動プロセスと自動プロセスの比較分析

第11章 企業プロファイル:業界参入企業

  • 章の概要
  • 北米のサービスプロバイダー
  • 欧州のサービスプロバイダー
  • アジア太平洋のサービスプロバイダー

第12章 企業プロファイル:業界外企業

  • 章の概要
  • Center for Cell and Gene Therapy, Baylor College of Medicine
  • Centre for Cell Manufacturing Ireland, National University of Ireland
  • Clinical Cell and Vaccine Production Facility, University of Pennsylvania
  • Guy's and St. Thomas'GMP Facility, Guy's Hospital
  • Laboratory for Cell and Gene Medicine, Stanford University
  • Molecular and Cellular Therapeutics, University of Minnesota
  • Newcastle Cellular Therapies Facility, Newcastle University
  • Rayne Cell Therapy Suite, King's College London
  • Scottish National Blood Transfusion Services Cellular Therapy Facility, Scottish Centre for Regenerative Medicine
  • Sydney Cell and Gene Therapy

第13章 細胞治療製造における非営利団体

第14章 臨床試験の分析

第15章 パートナーシップとコラボレーション

第16章 最近の拡張

第17章 大手製薬会社の取り組み

第18章 容量分析

第19章 需要分析

第20章 原価分析

第21章 製造か購入かの意思意思決定の枠組み

第22章 細胞治療製造組織の総所有コスト

第23章 世界の細胞治療製造市場

第24章 細胞治療製造市場(細胞治療タイプ別)

第25章 細胞治療製造市場(細胞の由来別)

第26章 細胞治療製造市場(事業規模別)

第27章 細胞治療製造市場(製造業者タイプ別)

第28章 細胞治療製造市場(地域別)

第29章 SWOT分析

第30章 調査分析

第31章 結論

第32章 エグゼクティブ洞察

第33章 付録1:表形式のデータ

第34章 付録2:企業・団体一覧

図表

List of Tables

  • Table 5.2 Differences between Cell Therapy and Biotechnological Products
  • Table 5.3 Cell-based Therapies: Commercialized Products
  • Table 5.4 Assessments for Key Cell Therapy Manufacturing Steps
  • Table 5.5 Advantages and Disadvantages of Centralized and Decentralized Manufacturing Models
  • Table 6.1 Cell Therapy Manufacturing: List of Industry Players
  • Table 6.2 Industry Players: Information on Type of Manufacturer
  • Table 6.3 Industry Players: Information on Type of Cell Manufactured
  • Table 6.4 Industry Players: Information on Source of Cells and Type of Cells Culture System Used
  • Table 6.5 Industry Players: Information on Scale of Operation
  • Table 6.6 Industry Players: Information on Additional Services Offered
  • Table 7.1 Cell Therapy Manufacturing: List of Non-Industry Players
  • Table 7.2 Non-Industry Players: Information on Type of Cell Manufactured
  • Table 7.3 Non-Industry Players: Information on Source of Cells and Type of Cells Culture System Used
  • Table 7.4 Non-Industry Players: Information on Scale of Operation
  • Table 7.5 Non-Industry Players: Information on Additional Services Offered
  • Table 8.1 Cell Therapy Manufacturing (Industry Players): Regulatory Authorities
  • Table 8.2 Cell Therapy Manufacturing (Non-Industry Players): Regulatory Authorities
  • Table 8.3 Summary of Guidelines for Early-Stage Manufacturing of Cell Therapies
  • Table 9.1 Cell Therapy Manufacturing: Roadmap for the US
  • Table 9.2 Cell Processing: Challenges and Strategies
  • Table 9.3 Cell Preservation, Distribution and Handling: Challenges and Strategies
  • Table 9.4 Process Monitoring and Quality Control: Challenges and Strategies
  • Table 9.5 Standardization and Regulatory Support: Challenges and Strategies
  • Table 9.6 Workforce Development: Challenges and Strategies
  • Table 9.7 Supply Chain and Logistics: Challenges and Strategies
  • Table 9.8 Cell Therapy Manufacturing: Roadmap for the Asia Pacific Economic Cooperation (APEC)
  • Table 10.1 Cell Therapy Manufacturing: List of Automated and Closed Cell Therapy Processing Systems
  • Table 11.1 Cell Therapy Manufacturing Industry Players: List of Companies Profiled
  • Table 11.2 AGC Biologics: Company Snapshot
  • Table 11.3 AGC Biologics: Information on Manufacturing Facilities and Capabilities
  • Table 11.4 AGC Biologics: Recent Developments and Future Outlook
  • Table 11.5 Charles River Laboratories: Company Snapshot
  • Table 11.6 Charles River Laboratories: Information on Manufacturing Facilities and Capabilities
  • Table 11.7 Charles River Laboratories: Recent Developments and Future Outlook
  • Table 11.8 FUJIFILM Cellular Dynamics: Company Snapshot
  • Table 11.9 FUJIFILM Cellular Dynamics: Information on Manufacturing Facilities and Capabilities
  • Table 11.10 FUJIFILM Cellular Dynamics: Recent Developments and Future Outlook
  • Table 11.11 KBI Biopharma: Company Snapshot
  • Table 11.12 KBI Biopharma: Information on Manufacturing Facilities and Capabilities
  • Table 11.13 KBI Biopharma: Recent Developments and Future Outlook
  • Table 11.14 Thermo Fisher Scientific: Company Snapshot
  • Table 11.15 Thermo Fisher Scientific: Information on Manufacturing Facilities and Capabilities
  • Table 11.16 Thermo Fisher Scientific: Recent Developments and Future Outlook
  • Table 11.17 Wuxi Advanced Therapies: Company Snapshot
  • Table 11.18 Wuxi Advanced Therapies: Information on Manufacturing Facilities and Capabilities
  • Table 11.19 Wuxi Advanced Therapies: Recent Developments and Future Outlook
  • Table 11.20 BioNTech: Company Snapshot
  • Table 11.21 BioNTech: Information on Manufacturing Facilities and Capabilities
  • Table 11.22 BioNTech: Recent Developments and Future Outlook
  • Table 11.23 Cell and Gene Therapy Catapult: Company Snapshot
  • Table 11.24 Cell and Gene Therapy Catapult: Information on Manufacturing Facilities and Capabilities
  • Table 11.25 Cell and Gene Therapy Catapult: Recent Developments and Future Outlook
  • Table 11.26 Lonza: Company Snapshot
  • Table 11.27 Lonza: Information on Manufacturing Facilities and Capabilities
  • Table 11.28 Lonza: Recent Developments and Future Outlook
  • Table 11.29 RoslinCT: Company Snapshot
  • Table 11.30 RoslinCT: Information on Manufacturing Facilities and Capabilities
  • Table 11.31 RoslinCT: Recent Developments and Future Outlook
  • Table 11.32 Cell Therapies: Company Snapshot
  • Table 11.33 Cell Therapies: Information on Manufacturing Facilities and Capabilities
  • Table 11.34 Cell Therapies: Recent Developments and Future Outlook
  • Table 11.35 Minaris Regenerative Medicine: Company Snapshot
  • Table 11.36 Minaris Regenerative Medicine: Information on Manufacturing Facilities and Capabilities
  • Table 11.37 Minaris Regenerative Medicine: Recent Developments and Future Outlook
  • Table 11.38 MEDINET: Company Snapshot
  • Table 11.39 MEDINET: Information on Manufacturing Facilities and Capabilities
  • Table 11.40 Nikon CeLL Innovation: Company Snapshot
  • Table 11.41 Nikon CeLL Innovation: Information on Manufacturing Facilities and Capabilities
  • Table 12.1 Cell Therapy Manufacturing (Non-Industry Players): List of Organizations Profiled
  • Table 12.2 Center for Cell and Gene Therapy: Overview of Manufacturing Facilities and Capabilities
  • Table 12.3 Center for Cell Manufacturing Ireland: Overview of Manufacturing Facilities and Capabilities
  • Table 12.4 Clinical Cell and Vaccine Production Facility: Overview of Manufacturing Facilities and Capabilities
  • Table 12.5 Guy's and St. Thomas GMP Facility: Overview of Manufacturing Facilities and Capabilities
  • Table 12.6 Laboratory of Cell and Gene Medicine: Overview of Manufacturing Facilities and Capabilities
  • Table 12.7 Molecular and Cellular Therapeutics: Overview of Manufacturing Facilities and Capabilities
  • Table 12.8 Newcastle Advanced Therapies: Overview of Manufacturing Facilities and Capabilities
  • Table 12.9 Rayne Cell Therapy Suite: Overview of Manufacturing Facilities and Capabilities
  • Table 12.10 Scottish National Blood Transfusion Services: Overview of Manufacturing Services and Capabilities
  • Table 12.11 Sydney Cell and Gene Therapy: Overview of Manufacturing Facilities and Capabilities
  • Table 13.1 Cell Therapy Manufacturing: List of Non-Profit Organizations
  • Table 13.2 CellCAN: Overview
  • Table 13.3 Cell Therapy Manufacturing Cooperative Research Center: Overview
  • Table 13.4 National Cell Manufacturing Consortium: Overview
  • Table 13.5 California's Institute of Regenerative Medicine: Overview
  • Table 15.1 Cell Therapy Manufacturing: List of Partnerships and Collaborations
  • Table 15.2 Partnerships and Collaborations: Information on Type of Cells
  • Table 15.3 Partnerships and Collaborations: Information on Types of T Cells and Stem Cells
  • Table 15.4 Partnerships and Collaborations: Information on Scale of Operation
  • Table 15.5 Cell Therapy Manufacturing: List of Mergers and Acquisitions
  • Table 16.1 Cell Therapy Manufacturing: List of Expansions
  • Table 16.2 Recent Expansions: Information on Type of Cell Manufactured
  • Table 16.3 Recent Expansions: Information on Scale of Operation
  • Table 17.1 Big Pharma Players: List of Cell Therapy Manufacturing Focused Initiatives, 2017-2022
  • Table 17.2 Big Pharma Players: Information on Type of Cells Manufactured
  • Table 17.3 Big Pharma Players: Information on Scale of Operation
  • Table 18.1 Average Installed Cell Therapy Manufacturing Capacity (Number of Cleanrooms): Sample Data Set for Industry Players
  • Table 18.2 Average Installed Cell Therapy Manufacturing Capacity (Cleanroom Area): Sample Data Set for Industry Players
  • Table 18.3 Installed Global Cell Therapy Manufacturing Capacity of Industry Players (Number of Cleanrooms): Distribution by Company Size
  • Table 18.4 Installed Global Cell Therapy Manufacturing Capacity of Industry Players (Cleanroom Area): Distribution by Company Size
  • Table 18.5 Median Installed Cell Therapy Manufacturing Capacity (Number of Cleanrooms): Data Set for Non-Industry Players
  • Table 18.6 Median Installed Cell Therapy Manufacturing Capacity (Cleanroom Area): Dat Set for Non-Industry Players
  • Table 20.1 Costs Associated with Manufacturing Stem Cell Therapies
  • Table 20.2 Pricing Model: Price of Marketed Drugs (Antibody Drug Conjugates and Monoclonal Antibodies)
  • Table 20.3 T-Cell Immunotherapies: Expert Opinions on Pricing
  • Table 20.4 CAR-T Cell Therapies: Reimbursement Landscape
  • Table 22.1 Total Cost of Ownership: Sample Dataset
  • Table 23.1 Active Clinical Studies for Cell Therapies
  • Table 23.2 Active Clinical Studies for Cell Therapies: Distribution by Patients Enrolled
  • Table 30.1 Survey Insights: Overview of Respondents
  • Table 30.2 Survey Insights: Designations and Seniority Levels
  • Table 30.3 Survey Insights: Type of Cell Therapy
  • Table 30.4 Survey Insights: Scale of Operation
  • Table 30.5 Survey Insights: Source of Cells
  • Table 30.6 Survey Insights: Cell Culture System
  • Table 30.7 Survey Insights: Availability of Fill / Finish Services
  • Table 33.1 Industry Players: Distribution by Year of Establishment
  • Table 33.2 Industry Players: Distribution by Company Size
  • Table 33.3 Industry Players: Distribution by Location of Headquarters (Region)
  • Table 33.4 Industry Players: Distribution by Location of Headquarters (Country)
  • Table 33.5 Industry Players: Distribution by Company Size and Location of Headquarters
  • Table 33.6 Industry Players: Distribution by Location of Manufacturing Facilities (Region)
  • Table 33.7 Industry Players: Distribution by Location of Manufacturing Facilities (Country)
  • Table 33.8 Industry Players: Distribution by Type of Manufacturer
  • Table 33.9 Industry Players: Distribution by Location of Headquarters and Type of Manufacturer
  • Table 33.10 Industry Players: Distribution by Type of Cells Manufactured
  • Table 33.11 Industry Players: Distribution by Type of Immune Cell Manufactured
  • Table 33.12 Industry Players: Distribution by Type of Stem Cell Manufactured
  • Table 33.13 Industry Players: Distribution by Location of Headquarters and Type of Cell Manufactured
  • Table 33.14 Industry Players: Distribution by Source of Cells
  • Table 33.15 Industry Players: Distribution by Type of Cell Manufactured and Source of Cells
  • Table 33.16 Industry Players: Distribution by Scale of Operation
  • Table 33.17 Industry Players: Distribution by Additional Services Offered
  • Table 33.18 Industry Players: Distribution by Company Size and Additional Services Offered
  • Table 33.19 Non-Industry Players: Distribution by Year of Establishment
  • Table 33.20 Non-Industry Players: Distribution by Location of Headquarters (Region)
  • Table 33.21 Non-Industry Players: Distribution by Location of Headquarters (Country)
  • Table 33.22 Non-Industry Players: Distribution by Location of Manufacturing Facility (Region)
  • Table 33.23 Non-Industry Players: Distribution by Location of Manufacturing Facility (Country)
  • Table 33.24 Non-Industry Players: Distribution by Type of Manufacturer
  • Table 33.25 Non-Industry Players: Distribution by Location of Headquarters and Type of Manufacturer
  • Table 33.26 Non-Industry Players: Distribution by Type of Cell Manufactured
  • Table 33.27 Non-Industry Players: Distribution by Type of Immune Cell Manufactured
  • Table 33.28 Non-Industry Players: Distribution by Type of Stem Cell Manufactured
  • Table 33.29 Non-Industry Players: Distribution by Location of Headquarters and Type of Cell Manufactured
  • Table 33.30 Non-Industry Players: Distribution by Source of Cells
  • Table 33.31 Non-Industry Players: Distribution by Type of Cell Manufactured and Source of Cells
  • Table 33.32 Non-Industry Players: Distribution by Scale of Operation
  • Table 33.33 Non-Industry Players: Distribution by Additional Services Offered
  • Table 33.34 AGC Biologics: Annual Revenues, FY 2020- Q1 FY 2024 (Billion YEN)
  • Table 33.35 Charles River Laboratories: Annual Revenues, FY 2020-Q1 FY 2024 (USD Billion)
  • Table 33.36 Thermo Fisher Scientific: Annual Revenues, FY 2020-Q1 FY 2024 (USD Billion)
  • Table 33.37 Lonza: Annual Revenues, FY 2019-FY 2023 (CHF Million)
  • Table 33.38 Clinical Trial Analysis: Distribution by Trial Registration Year, 2018-2024
  • Table 33.39 Clinical Trial Analysis: Distribution by Trial Registration Year and Enrolled Patient Population, 2018-2024
  • Table 33.40 Clinical Trial Analysis: Distribution by Trial Status
  • Table 33.41 Clinical Trial Analysis: Distribution by Trial Registration Year and Trial Status
  • Table 33.42 Clinical Trial Analysis: Distribution by Trial Phase
  • Table 33.43 Clinical Trial Analysis: Distribution of Trial Phase by Number of Trials and Enrolled Patient Population
  • Table 33.44 Clinical Trial Analysis: Distribution by Type of Sponsor / Collaborator
  • Table 33.45 Clinical Trial Analysis: Distribution by Patient Segment
  • Table 33.46 Clinical Trial Analysis: Distribution by Study Design
  • Table 33.47 Most Active Industry Players: Distribution by Number of Registered Trials
  • Table 33.48 Most Active Non-Industry Players: Distribution by Number of Registered Trials
  • Table 33.49 Clinical Trial Analysis: Distribution by Number of Trials and Geography
  • Table 33.50 Clinical Trial Analysis: Distribution by Number of Trials, Trial Status and Geography
  • Table 33.51 Clinical Trial Analysis: Distribution by Enrolled Patient Population, Trial Status and Geography
  • Table 33.52 Partnerships and Collaborations: Cumulative Year-wise Trend, 2016-2022
  • Table 33.53 Partnerships and Collaborations: Distribution by Type of Partnership
  • Table 33.54 Partnerships and Collaborations: Distribution by Year and Type of Partnership
  • Table 33.55 Partnerships and Collaborations: Distribution by Type of Cell
  • Table 33.56 Heat Map: Distribution by Year and Type of Cell
  • Table 33.57 Partnerships and Collaborations: Distribution by Type of T Cell
  • Table 33.58 Partnerships and Collaborations: Distribution by Type of Stem Cell
  • Table 33.59 Partnerships and Collaborations: Distribution by Scale of Operation
  • Table 33.60 Partnerships and Collaborations: Distribution by Type of Cell and Scale of Operation
  • Table 33.61 Partnerships and Collaborations: Country-wise Distribution
  • Table 33.62 Partnerships and Collaborations: Continent-wise Distribution
  • Table 33.63 Most Active Players: Distribution by Number of Partnerships and Collaborations
  • Table 33.64 Mergers and Acquisitions: Cumulative Year-wise Trend, 2016-2022
  • Table 33.65 Mergers and Acquisitions: Distribution by Type of Agreement
  • Table 33.66 Mergers and Acquisitions: Year-wise Distribution by Type of Cell
  • Table 33.67 Mergers and Acquisitions: Country-wise Distribution
  • Table 33.68 Mergers and Acquisitions: Continent-wise Distribution
  • Table 33.69 Mergers and Acquisitions: Intercontinental and Intracontinental Deals
  • Table 33.70 Mergers and Acquisitions: Ownership Change Matrix
  • Table 33.71 Recent Expansions: Cumulative Year-wise Trend, 2016-2022
  • Table 33.72 Recent Expansions: Distribution by Type of Expansion
  • Table 33.73 Recent Expansions: Distribution by Year and Type of Expansion
  • Table 33.74 Recent Expansions: Distribution by Type of Cell Manufactured
  • Table 33.75 Recent Expansions: Distribution by Type of Expansion and Type of Cell Manufactured
  • Table 33.76 Recent Expansions: Distribution by Scale of Operation
  • Table 33.77 Recent Expansions: Distribution by Location of Expanded Facility (Region)
  • Table 33.78 Recent Expansions: Distribution by Location of Expanded Facility (Country)
  • Table 33.79 Recent Expansions: Distribution by Type of Expansion and Location of Expanded Facility
  • Table 33.80 Most Active Players: Distribution by Number of Expansions
  • Table 33.81 Most Active Players: Distribution by Area of Expansion (in sq ft)
  • Table 33.82 Big Pharma Initiatives: Distribution by Number of Cell Therapy Manufacturing Focused Initiatives
  • Table 33.83 Big Pharma Initiatives: Cumulative Distribution by Year of Initiative
  • Table 33.84 Big Pharma Initiatives: Distribution by Type of Initiative
  • Table 33.85 Big Pharma Initiatives: Distribution by Type of Partnership
  • Table 33.86 Big Pharma Initiatives: Distribution by Type of Expansion
  • Table 33.87 Big Pharma Initiatives: Distribution by Type of Cells Manufactured
  • Table 33.88 Big Pharma Initiatives: Distribution by Scale of Operation
  • Table 33.89 Big Pharma Initiatives: Distribution of Big Pharma Players by Year and Number of Initiatives
  • Table 33.90 Big Pharma Initiatives: Distribution of Big Pharma Players by Year and Type of Initiative
  • Table 33.91 Big Pharma Players: Distribution by Scale of Operation and Big Pharma Players
  • Table 33.92 Installed Global Cell Therapy Manufacturing Capacity of Industry Players (Number of Cleanrooms): Distribution by Company Size
  • Table 33.93 Installed Global Cell Therapy Manufacturing Capacity of Industry Players (Number of Cleanrooms): Distribution by Scale of Operation
  • Table 33.94 Installed Global Cell Therapy Manufacturing Capacity of Industry Players (Number of Cleanrooms): Distribution by Location of Manufacturing Facility
  • Table 33.95 Installed Global Cell Therapy Manufacturing Capacity of Industry Players (Number of Cleanrooms): Distribution by Scale of Operation and Location of Manufacturing Facility
  • Table 33.96 Installed Global Capacity of Industry Players for Cell Therapy Manufacturing (Number of Cleanrooms): Distribution by Scale of Operation and Location of Manufacturing Facility
  • Table 33.97 Installed Global Cell Therapy Manufacturing Capacity of Industry Players (Cleanroom Area): Distribution by Company Size
  • Table 33.98 Installed Global Cell Therapy Manufacturing Capacity of Industry Players (Cleanroom Area): Distribution by Scale of Operation
  • Table 33.99 Installed Global Cell Therapy Manufacturing Capacity of Industry Players (Cleanroom Area): Distribution by Location of Manufacturing Facility
  • Table 33.100 Installed Global Cell Therapy Manufacturing Capacity of Industry Players (Cleanroom Area): Distribution by Company Size and Location of Manufacturing Facility
  • Table 33.101 Installed Global Cell Therapy Manufacturing Capacity of Industry Players (Cleanroom Area): Distribution by Scale of Operation and Location of Manufacturing Facility
  • Table 33.102 Installed Global Cell Therapy Manufacturing Capacity of Non-Industry Players (Number of Cleanrooms): Distribution by Scale of Operation
  • Table 33.103 Installed Global Cell Therapy Manufacturing Capacity of Non-Industry Players (Number of Cleanrooms): Distribution by Location of Manufacturing Facility
  • Table 33.104 Installed Global Cell Therapy Manufacturing Capacity of Non-Industry Players (Cleanroom Area): Distribution by Scale of Operation
  • Table 33.105 Installed Global Cell Therapy Manufacturing Capacity of Non-Industry Players (Cleanroom Area): Distribution by Location of Manufacturing Facility
  • Table 33.106 Global Demand for Cell Therapies, 2024-2035 (Number of Patients)
  • Table 33.107 Global Demand for Cell Therapies, 2024-2035 (Billion Cells)
  • Table 33.108 Global Clinical Demand for Cell Therapies, 2024-2035 (Number of Patients)
  • Table 33.109 Global Clinical Demand for Cell Therapies, 2024-2035: Distribution by Type of Cell Therapy (Number of Patients)
  • Table 33.110 Global Clinical Demand for Cell Therapies, 2024-2035: Distribution by Geography (Number of Patients)
  • Table 33.111 Global Commercial Demand for Cell Therapies, 2024-2035 (Number of Patients)
  • Table 33.112 Global Commercial Demand for Cell Therapies, 2024-2035: Distribution by Type of Cell Therapy (Number of Patients)
  • Table 33.113 Global Commercial Demand for Cell Therapies, 2024-2035: Distribution by Geography (Number of Patients)
  • Table 33.114 Total Cost of Ownership for Mid-sized Cell Therapy Manufacturing Organizations, Y0-Y20 (USD Million)
  • Table 33.115 Total Cost of Ownership for Mid-sized Cell Therapy Manufacturing Organizations: Distribution by CAPEX and OPEX, Y0 and Y20 (USD Million)
  • Table 33.116 Total Cost of Ownership for Mid-sized Cell Therapy Manufacturing Organizations, Y0: Distribution of CAPEX (USD Million)
  • Table 33.117 Total Cost of Ownership for Mid-sized Cell Therapy Manufacturing Organizations, Y1-Y20: Distribution by OPEX (USD Million)
  • Table 33.118 Global Cell Therapy Manufacturing Market, Historical Trends (2022-2023) and Forecasted Estimates (2024-2035) (USD Billion)
  • Table 33.119 Cell Therapy Manufacturing Market: Distribution by Type of Cell Therapy, 2022, 2024 and 2035 (USD Million)
  • Table 33.120 Cell Therapy Manufacturing Market for T Cell Therapies: Historical Trends (2022-2023) and Forecasted Estimates (2024-2035) (USD Million)
  • Table 33.121 T Cell Therapy Manufacturing Market for CAR-T Cell Therapies: Historical Trends (2022-2023) and Forecasted Estimates (2024-2035) (USD Million)
  • Table 33.122 T Cell Therapy Manufacturing Market for TCR Cell Therapies: Historical Trends (2022-2023) and Forecasted Estimates (2024-2035) (USD Million)
  • Table 33.123 T Cell Therapy Manufacturing Market for TIL Cell Therapies: Historical Trends (2022-2023) and Forecasted Estimates (2024-2035) (USD Million)
  • Table 33.124 Cell Therapy Manufacturing Market for Stem Cell Therapies: Historical Trends (2022-2023) and Forecasted Estimates (2024-2035) (USD Million)
  • Table 33.125 Cell Therapy Manufacturing Market for Dendritic Cell Therapies: Historical Trends (2022-2023) and Forecasted Estimates (2024-2035) (USD Million)
  • Table 33.126 Cell Therapy Manufacturing Market for NK Cell Therapies: Historical Trends (2022-2023) and Forecasted Estimates (2024-2035) (USD Million)
  • Table 33.127 Cell Therapy Manufacturing Market: Distribution by Source of Cells, 2022, 2024, 2035 (USD Million)
  • Table 33.128 Cell Therapy Manufacturing Market for Autologous Source of Cells: Historical Trends (2022-2023) and Forecasted Estimates (2024-2035) (USD Million)
  • Table 33.129 Cell Therapy Manufacturing Market for Allogeneic Source of Cells: Historical Trends (2022-2023) and Forecasted Estimates (2024-2035) (USD Million)
  • Table 33.130 Cell Therapy Manufacturing Market for Unspecified Source of Cells: Historical Trends (2022-2023) and Forecasted Estimates (2024-2035) (USD Million)
  • Table 33.131 Cell Therapy Manufacturing Market: Distribution by Scale of Operation, 2022, 2024 and 2035
  • Table 33.132 Cell Therapy Manufacturing Market for Clinical Scale: Historical Trends (2022-2023) and Forecasted Estimates (2024-2035) (USD Million)
  • Table 33.133 Clinical Scale Manufacturing Market for T Cell Therapies, 2022-2035 (USD Million)
  • Table 33.134 Clinical Scale Manufacturing Market for T Cell Therapies: Distribution by Type of Therapy, 2022-2035 (USD Million)
  • Table 33.135 Clinical Scale Manufacturing Market for T Cell Therapies: Distribution by Source of Cells, 2022-2035 (USD Million)
  • Table 33.136 Clinical Scale Manufacturing Market for T Cell Therapies: Distribution by Geography, 2022-2035 (USD Million)
  • Table 33.137 Clinical Scale Manufacturing Market for NK Cell Therapies, 2022-2035 (USD Million)
  • Table 33.138 Clinical Scale Manufacturing Market for NK Cell Therapies: Distribution by Source of Cells, 2022-2035 (USD Million)
  • Table 33.139 Clinical Scale Manufacturing Market for NK Cell Therapies: Distribution by Geography, 2022-2035 (USD Million)
  • Table 33.140 Clinical Scale Manufacturing Market for Dendritic Cell Therapies, 2022-2035 (USD Million)
  • Table 33.141 Clinical Scale Manufacturing Market for Dendritic Cell Therapies: Distribution by Source of Cells, 2022-2035 (USD Million)
  • Table 33.142 Clinical Scale Manufacturing Market for Dendritic Cell Therapies: Distribution by Geography, 2022-2035 (USD Million)
  • Table 33.143 Clinical Scale Manufacturing Market for Stem Cell Therapies, 2022-2035 (USD Million)
  • Table 33.144 Clinical Scale Manufacturing Market for Stem Cell Therapies: Distribution by Source of Cells, 2022-2035 (USD Million)
  • Table 33.145 Clinical Scale Manufacturing Market for Stem Cell Therapies: Distribution by Geography, 2022-2035 (USD Million)
  • Table 33.146 Cell Therapy Manufacturing Market for Commercial Scale: Historical Trends (2022-2023) and Forecasted Estimates (2024-2035) (USD Million)
  • Table 33.147 Commercial Scale Manufacturing Market for T Cell Therapies, 2022-2035 (USD Million)
  • Table 33.148 Commercial Scale Manufacturing Market for T Cell Therapies: Distribution by Type of Therapy, 2022-2035 (USD Million)
  • Table 33.149 Commercial Scale Manufacturing Market for T Cell Therapies: Distribution by Source of Cells, 2022-2035 (USD Million)
  • Table 33.150 Commercial Scale Manufacturing Market for T Cell Therapies: Distribution by Geography, 2022-2035 (USD Million)
  • Table 33.151 Commercial Scale Manufacturing Market for Dendritic Cell Therapies, 2022-2035 (USD Million)

Table 33. 152 Commercial Scale Manufacturing Market for Dendritic Cell Therapies: Distribution by Geography, 2022-2035 (USD Million)

  • Table 33.153 Commercial Scale Manufacturing Market for Stem Cell Therapies, 2022-2035 (USD Million)
  • Table 33.154 Commercial Scale Manufacturing Market for Stem Cell Therapies: Distribution by Source of Cells, 2022-2035 (USD Million)
  • Table 33.155 Commercial Scale Manufacturing Market for Stem Cell Therapies: Distribution by Geography, 2022-2035 (USD Million)
  • Table 33.156 Cell Therapy Manufacturing Market: Distribution by Type of Manufacturer, 2022, 2024 and 2035
  • Table 33.157 Cell Therapy Manufacturing Market for In-house Manufacturers: Historical Trends (2022-2023) and Forecasted Estimates (2024-2035) (USD Million)
  • Table 33.158 Cell Therapy Manufacturing Market for contract manufacturing organizations: Historical Trends (2022-2023) and Forecasted Estimates (2024-2035) (USD Million)
  • Table 33.159 Cell Therapy Manufacturing Market: Distribution by Geography, 2022, 2024 and 2035
  • Table 33.160 Cell Therapy Manufacturing Market in North America: Historical Trends (2022-2023) and Forecasted Estimates (2024-2035) (USD Million)
  • Table 33.161 Cell Therapy Manufacturing Market in Europe: Historical Trends (2022-2023) and Forecasted Estimates (2024-2035) (USD Million)
  • Table 33.162 Cell Therapy Manufacturing Market in Asia Pacific: Historical Trends (2022-2023) and Forecasted Estimates (2024-2035) (USD Million)
  • Table 33.163 Cell Therapy Manufacturing Market in Rest of the World: Historical Trends (2022-2023) and Forecasted Estimates (2024-2035) (USD Million)
  • Table 33.164 Survey Insights: Distribution of Respondents by Type of Organization
  • Table 33.165 Survey Insights: Distribution of Respondents by Location of Manufacturing Facility
  • Table 33.166 Survey Insights: Distribution by Designation and Seniority Level
  • Table 33.167 Survey Insights: Distribution by Type of Cell Therapy
  • Table 33.168 Survey Insights: Distribution by Scale of Operation
  • Table 33.169 Survey Insights: Distribution by Source of Cells
  • Table 33.170 Survey Insights: Distribution by Fill / Finish Services

List of Figures

  • Figure 2.1 Research Methodology: Project Methodology
  • Figure 2.2 Research Methodology: Forecast Methodology
  • Figure 2.3 Research Methodology: Robust Quality Control
  • Figure 2.4 Research Methodology: Key Market Segmentations
  • Figure 3.1 Economic and Other Project Specific Consideration: Lesson Learnt from Past Recessions
  • Figure 4.1 Executive Summary: Market Landscape
  • Figure 4.2 Executive Summary: Clinical Trial Analysis
  • Figure 4.3 Executive Summary: Partnerships and Collaborations
  • Figure 4.4 Executive Summary: Mergers and Acquisitions
  • Figure 4.5 Executive Summary: Recent Expansions
  • Figure 4.6 Executive Summary: Big Pharma Initiatives
  • Figure 4.7 Executive Summary: Capacity Analysis
  • Figure 4.8 Executive Summary: Demand Analysis
  • Figure 4.9 Executive Summary: Market Sizing and Opportunity Analysis
  • Figure 5.1 Classification of Advanced Therapy Medicinal Products (ATMPs)
  • Figure 5.2 Decentralized Manufacturing: Process Model
  • Figure 5.3 Cell Therapy Manufacturing: Type of Manufacturers
  • Figure 5.4 Cell Therapies: Challenges and Drivers
  • Figure 5.5 Cell Therapies: Potency as a Critical Quality Attribute
  • Figure 5.6 Cell Therapy Manufacturing: Supply Chain Model
  • Figure 6.1 Industry Players: Distribution by Year of Establishment
  • Figure 6.2 Industry Players: Distribution by Company Size
  • Figure 6.3 Industry Players: Distribution by Location of Headquarters (Region)
  • Figure 6.4 Industry Players: Distribution by Location of Headquarters (Country)
  • Figure 6.5 Industry Players: Distribution by Company Size and Location of Headquarters (Region)
  • Figure 6.6 Industry Players: Distribution by Location of Manufacturing Facilities (Region)
  • Figure 6.7 Industry Players: Distribution by Location of Manufacturing Facilities (Country)
  • Figure 6.8 Industry Players: Distribution by Type of Manufacturer
  • Figure 6.9 Industry Players: Distribution by Location of Headquarters and Type of Manufacturer
  • Figure 6.10 Industry Players: Distribution by Type of Cell Manufactured
  • Figure 6.11 Industry Players: Distribution by Type of Immune Cell Manufactured
  • Figure 6.12 Industry Players: Distribution by Type of Stem Cell Manufactured
  • Figure 6.13 Industry Players: Distribution by Location of Headquarters and Type of Cell Manufactured
  • Figure 6.14 Industry Players: Distribution by Source of Cells
  • Figure 6.15 Industry Players: Distribution by Type of Cell Manufactured and Source of Cells
  • Figure 6.16 Industry Players: Distribution by Scale of Operation
  • Figure 6.17 Industry Players: Distribution by Additional Services Offered
  • Figure 6.18 Industry Players: Distribution by Company Size and Additional Services Offered
  • Figure 7.1 Non-Industry Players: Distribution by Year of Establishment
  • Figure 7.2 Non-Industry Players: Distribution by Location of Headquarters (Region)
  • Figure 7.3 Non-Industry Players: Distribution by Location of Headquarters (Country)
  • Figure 7.4 Non-Industry Players: Distribution by Location of Manufacturing Facility (Region)
  • Figure 7.5 Non-Industry Players: Distribution by Location of Manufacturing Facility (Country)
  • Figure 7.6 Non-Industry Players: Distribution by Type of Manufacturer
  • Figure 7.7 Non-Industry Players: Distribution by Location of Headquarters and Type of Manufacturer
  • Figure 7.8 Non-Industry Players: Distribution by Type of Cell Manufactured
  • Figure 7.9 Non-Industry Players: Distribution by Type of Immune Cell Manufactured
  • Figure 7.10 Non-Industry Players: Distribution by Type of Stem Cell Manufactured
  • Figure 7.11 Non-Industry Players: Distribution by Location of Headquarters and Type of Cell Manufactured
  • Figure 7.12 Non-Industry Players: Distribution by Source of Cells
  • Figure 7.13 Non-Industry Players: Distribution by Type of Cell Manufactured and Source of Cells
  • Figure 7.14 Non-Industry Players: Distribution by Scale of Operation
  • Figure 7.15 Non-Industry Players: Distribution by Additional Services Offered
  • Figure 8.1 Industry Players: Distribution of Manufacturing Facilities by Regulatory Authorities
  • Figure 8.2 Cell Therapy Manufacturing (Non-Industry Players): Regulatory Authorities
  • Figure 10.1 Key Considerations for Automating Cell Therapy Manufacturing Process
  • Figure 10.2 Requirements to Implement Closed Systems in Cell Therapy Manufacturing Processes
  • Figure 10.3 Functions of Automated and Closed Systems at Each Step of the Cell Therapy Manufacturing Process
  • Figure 10.4 Advantages and Disadvantages of Single-Use System
  • Figure 10.5 Growth Drivers and Roadblocks to the Automated and Closed Systems
  • Figure 10.6 Cell Therapy Manufacturing: Roadmap for Developing an Automated Device
  • Figure 10.7 Cell Therapy Manufacturing: Comparison Between Manual and Automated Processes
  • Figure 10.8 Cell Therapy Manufacturing: Comparative Analysis of Manual and Automated Processes Based on Affiliated Costs
  • Figure 11.1 AGC Biologics: Annual Revenues, FY 2020- Q1 FY 2024 (YEN Billion)
  • Figure 11.2 Charles River Laboratories: Annual Revenues, FY 2020-Q1 FY 2024 (USD Billion)
  • Figure 11.3 Thermo Fisher Scientific: Annual Revenues, FY 2020-Q1 FY 2024 (USD Billion)
  • Figure 11.4 Lonza: Annual Revenues, FY 2019-FY 2023 (CHF Million)
  • Figure 12.1 Center for Cell and Gene Therapy: Service Portfolio
  • Figure 12.2 Center for Cell Manufacturing Ireland: Service Portfolio
  • Figure 12.3 Clinical Cell and Vaccine Production Facility: Service Portfolio
  • Figure 12.4 Guy's and St Thomas' GMP Facility: Service Portfolio
  • Figure 12.5 Laboratory for Cell and Gene Medicine: Service Portfolio
  • Figure 12.6 Molecular and Cellular Therapeutics: Service Portfolio
  • Figure 12.7 Newcastle Cellular Therapies Facility: Service Portfolio
  • Figure 12.8 Rayne Cell Therapy Suite, King's College London: Service Portfolio
  • Figure 12.9 Scottish National Blood Transfusion Services Cellular Therapy Facility, Scottish Center for Regenerative Medicine: Service Portfolio
  • Figure 12.10 Sydney Cell and Gene Therapy: Service Portfolio
  • Figure 14.1 Clinical Trial Analysis: Scope and Methodology
  • Figure 14.2 Clinical Trial Analysis: Distribution by Trial Registration Year, 2018-2024
  • Figure 14.3 Clinical Trial Analysis: Distribution by Trial Registration Year and Enrolled Patient Population, 2018-2024
  • Figure 14.4 Clinical Trial Analysis: Distribution by Trial Status
  • Figure 14.5 Clinical Trial Analysis: Distribution by Trial Registration Year and Trial Status
  • Figure 14.6 Clinical Trial Analysis: Distribution by Trial Phase
  • Figure 14.7 Clinical Trial Analysis: Distribution of Trial Phase by Number of Trials and Enrolled Patient Population
  • Figure 14.8 Clinical Trial Analysis: Distribution by Type of Sponsor / Collaborator
  • Figure 14.9 Clinical Trial Analysis: Distribution by Patient Segment
  • Figure 14.10 Clinical Trial Analysis: Distribution by Study Design
  • Figure 14.11 Most Active Industry Players: Distribution by Number of Registered Trials
  • Figure 14.12 Most Active Non-Industry Players: Distribution by Number of Registered Trials
  • Figure 14.13 Clinical Trial Analysis: Distribution by Number of Trials and Geography
  • Figure 14.14 Clinical Trial Analysis: Distribution by Number of Trials, Trial Status and Geography
  • Figure 14.15 Clinical Trial Analysis: Distribution by Enrolled Patient Population, Trial Status and Geography
  • Figure 15.1 Partnerships and Collaborations: Cumulative Year-wise Trend, 2016-2022
  • Figure 15.2 Partnerships and Collaborations: Distribution by Type of Partnership
  • Figure 15.3 Partnerships and Collaborations: Distribution by Year and Type of Partnership
  • Figure 15.4 Partnerships and Collaborations: Distribution by Type of Cells
  • Figure 15.5 Heat Map: Distribution by Year and Type of Cells
  • Figure 15.6 Partnerships and Collaborations: Distribution by Type of T-Cells
  • Figure 15.7 Partnerships and Collaborations: Distribution by Type of Stem Cells
  • Figure 15.8 Partnerships and Collaborations: Distribution by Scale of Operation
  • Figure 15.9 Partnerships and Collaborations: Distribution by Type of Cells and Scale of Operation
  • Figure 15.10 Partnerships and Collaborations: Country-wise Distribution
  • Figure 15.11 Partnerships and Collaborations: Continent-wise Distribution
  • Figure 15.12 Most Active Players: Distribution by Number of Partnerships
  • Figure 15.13 Mergers and Acquisitions: Cumulative Year-wise Trend, 2016-2022 (till June)
  • Figure 15.14 Mergers and Acquisitions: Distribution by Type of Agreement
  • Figure 15.15 Mergers and Acquisitions: Year-wise Distribution by Type of Cells
  • Figure 15.16 Mergers and Acquisitions: Country-wise Distribution
  • Figure 15.17 Mergers and Acquisitions: Continent-wise Distribution
  • Figure 15.18 Mergers and Acquisitions: Intercontinental and Intracontinental Deals
  • Figure 15.19 Mergers and Acquisitions: Ownership Change Matrix
  • Figure 16.1 Recent Expansions: Cumulative Year-wise Trend, 2017-2024
  • Figure 16.2 Recent Expansions: Distribution by Type of Expansion
  • Figure 16.3 Recent Expansions: Distribution by Year and Type of Expansion
  • Figure 16.4 Recent Expansions: Distribution by Type of Cells Manufactured
  • Figure 16.5 Recent Expansions: Distribution by Type of Expansion and Type of Cells Manufactured
  • Figure 16.6 Recent Expansions: Distribution by Scale of Operation
  • Figure 16.7 Recent Expansions: Distribution by Location of Expanded Facility (Region)
  • Figure 16.8 Recent Expansions: Distribution by Location of Expanded Facility (Country)
  • Figure 16.9 Recent Expansions: Distribution by Type of Expansion and Location of Expanded Facility
  • Figure 16.10 Most Active Players: Distribution by Number of Expansions
  • Figure 16.11 Most Active Players: Distribution by Area of Expansion (in sq ft)
  • Figure 16.12 Recent Expansions: Distribution by Year and Location of Manufacturing Facility
  • Figure 17.1 Big Pharma Players: Distribution by Number of Cell Therapy Manufacturing Focused Initiatives
  • Figure 17.2 Big Pharma Players: Distribution by Year of Initiative
  • Figure 17.3 Big Pharma Initiatives: Distribution by Type of Initiative
  • Figure 17.4 Big Pharma Players: Distribution by Type of Partnership
  • Figure 17.5 Big Pharma Players: Distribution by Type of Expansion
  • Figure 17.6 Big Pharma Players: Distribution by Type of Cells
  • Figure 17.7 Big Pharma Players: Distribution by Scale of Operation
  • Figure 17.8 Big Pharma Players: Distribution of Big Pharma Players by Year and Number of Initiatives
  • Figure 17.9 Big Pharma Players: Distribution by Year and Type of Initiative
  • Figure 17.10 Big Pharma Players: Distribution of Type of Cells Manufactured
  • Figure 17.11 Big Pharma Players: Distribution by Scale of Operation
  • Figure 17.12 Harvey Ball Analysis: Big Pharma Initiatives Summary
  • Figure 17.13 Spider Web Analysis: Big Pharmaceutical Players
  • Figure 18.1 Sample Dataset Capacity of Industry Players for Cell Therapy Manufacturing (Number of Cleanrooms): Distribution by Company Size and Range of Installed Capacity
  • Figure 18.2 Sample Dataset Capacity of Industry Players for Cell Therapy Manufacturing (Cleanroom Area, sq. ft.): Distribution by Company Size and Range of Installed Capacity
  • Figure 18.3 Installed Global Cell Therapy Manufacturing Capacity of Industry Players (Number of Cleanrooms): Distribution by Company Size
  • Figure 18.4 Installed Global Cell Therapy Manufacturing Capacity of Industry Players (Number of Cleanrooms): Distribution by Scale of Operation
  • Figure 18.5 Installed Global Cell Therapy Manufacturing Capacity of Industry Players (Number of Cleanrooms): Distribution by Location of Manufacturing Facility
  • Figure 18.6 Installed Global Cell Therapy Manufacturing Capacity of Industry Players (Number of Cleanrooms): Distribution by Company Size and Location of Manufacturing Facility
  • Figure 18.7 Installed Global Cell Therapy Manufacturing Capacity of Industry Players (Number of Cleanrooms): Distribution by Scale of Operation and Location of Manufacturing Facility
  • Figure 18.8 Installed Global Cell Therapy Manufacturing Capacity of Industry Players (Cleanroom Area): Distribution by Company Size
  • Figure 18.9 Installed Global Cell Therapy Manufacturing Capacity of Industry Players (in terms of Cleanroom Area): Distribution by Scale of Operation
  • Figure 18.10 Installed Global Cell Therapy Manufacturing Capacity of Industry Players (Cleanroom Area): Distribution by Location of Manufacturing Facility
  • Figure 18.11 Installed Global Cell Therapy Manufacturing Capacity of Industry Players (Cleanroom Area): Distribution by Company Size and Location of Manufacturing Facility
  • Figure 18.12 Installed Global Cell Therapy Manufacturing Capacity of Industry Players (Cleanroom Area): Distribution by Scale of Operation and Location of Manufacturing Facility
  • Figure 18.13 Installed Global Cell Therapy Manufacturing Capacity of Non-Industry Players (Number of Cleanrooms): Distribution by Range of Installed Capacity
  • Figure 18.14 Installed Global Cell Therapy Manufacturing Capacity of Non-Industry Players (Number of Cleanrooms): Distribution by Scale of Operation
  • Figure 18.15 Installed Global Cell Therapy Manufacturing Capacity of Non-Industry Players (Number of Cleanrooms): Distribution by Location of Manufacturing Facility
  • Figure 18.16 Installed Global Cell Therapy Manufacturing Capacity of Non-Industry Players (Cleanroom Area): Distribution by Range of Installed Capacity
  • Figure 18.17 Installed Global Cell Therapy Manufacturing Capacity of Non-Industry Players (Cleanroom Area): Distribution by Scale of Operation
  • Figure 18.18 Installed Global Cell Therapy Manufacturing Capacity of Non-Industry Players (Cleanroom Area): Distribution by Location of Manufacturing Facility
  • Figure 19.1 Global Demand for Cell Therapies, 2024-2035 (in terms of Number of Patients)
  • Figure 19.2 Global Demand for Cell Therapies, 2024-2035 (in terms of Billion Cells)
  • Figure 19.3 Global Clinical Demand for Cell Therapies, 2024-2035 (in terms of Number of Patients)
  • Figure 19.4 Global Clinical Demand for Cell Therapies: Distribution by Type of Cell Therapy, 2024-2035 (in terms of Number of Patients)
  • Figure 19.5 Global Clinical Demand for Cell Therapies: Distribution by Geography, 2024-2035 (in terms of Number of Patients)
  • Figure 19.6 Global Commercial Demand for Cell Therapies, 2024-2035 (in terms of Number of Patients)
  • Figure 19.7 Global Commercial Demand for Cell Therapies: Distribution by Type of Cell Therapy, 2024-2035 (in terms of Number of Patients)
  • Figure 19.8 Global Commercial Demand for Cell Therapies: Distribution by Geography, 2024-2035 (in terms of Number of Patients)
  • Figure 20.1 Targeted Therapies: Pricing Model Based on Patient Segment
  • Figure 21.1 Make versus Buy Decision Making Framework
  • Figure 21.2 Make versus Buy Decision Making: Possible Scenario Descriptions
  • Figure 22.1 Total Cost of Ownership: Capital Expenditures (CAPEX)
  • Figure 22.2 Total Cost of Ownership: Operational Expenditures (OPEX)
  • Figure 22.3 Total Cost of Ownership for Mid-sized Cell Therapy Manufacturing Organizations, Y0-Y20 (USD Million)
  • Figure 22.4 Total Cost of Ownership for Mid-sized Cell Therapy Manufacturing Organizations: Distribution by CAPEX and OPEX, Y0 and Y20 (USD Million)
  • Figure 22.5 Total Cost of Ownership for Mid-sized Cell Therapy Manufacturing Organizations, Y0: Distribution by CAPEX (USD Million)
  • Figure 22.6 Total Cost of Ownership for Mid-sized Cell Therapy Manufacturing Organizations, Y1-Y20: Distribution by OPEX (USD Million)
  • Figure 23.1 Global Cell Therapy Manufacturing Market, Historical Trends (2022-2023) and Forecasted Estimates (2024-2035) (USD Billion)
  • Figure 23.2 Global Cell Therapy Manufacturing Market, Forecasted Estimates (2024-2035): Conservative Scenario (USD Billion)
  • Figure 23.3 Global Cell Therapy Manufacturing Market, Forecasted Estimates (2024-2035): Optimistic Scenario (USD Billion)
  • Figure 24.1 Cell Therapy Manufacturing Market: Distribution by Type of Cell Therapy, 2022, 2024 and 2035
  • Figure 24.2 Cell Therapy Manufacturing Market for T Cell Therapies: Historical Trends (2022-2023) and Forecasted Estimates (2024-2035) (USD Million)
  • Figure 24.3 T Cell Therapy Manufacturing Market for CAR-T Cell Therapies: Historical Trends (2022-2023) and Forecasted Estimates (2024-2035) (USD Million)
  • Figure 24.4 T Cell Therapy Manufacturing Market for TCR Cell Therapies: Historical Trends (2022-2023) and Forecasted Estimates (2024-2035) (USD Million)
  • Figure 24.5 T Cell Therapy Manufacturing Market for TIL Cell Therapies: Historical Trends (2022-2023) and Forecasted Estimates (2024-2035) (USD Million)
  • Figure 24.6 Cell Therapy Manufacturing Market for Stem Cell Therapies: Historical Trends (2022-2023) and Forecasted Estimates (2024-2035) (USD Million)
  • Figure 24.7 Cell Therapy Manufacturing Market for Dendritic Cell Therapies: Historical Trends (2022-2023) and Forecasted Estimates (2024-2035) (USD Million)
  • Figure 24.8 Cell Therapy Manufacturing Market for NK Cell Therapies: Historical Trends (2022-2023) and Forecasted Estimates (2024-2035) (USD Million)
  • Figure 25.1 Cell Therapy Manufacturing Market: Distribution by Source of Cells, 2022, 2024 and 2035
  • Figure 25.2 Cell Therapy Manufacturing Market for Autologous Source of Cells: Historical Trends (2022-2023) and Forecasted Estimates (2024-2035) (USD Million)
  • Figure 25.3 Cell Therapy Manufacturing Market for Allogeneic Source of Cells: Historical Trends (2022-2023) and Forecasted Estimates (2024-2035) (USD Million)
  • Figure 25.4 Cell Therapy Manufacturing Market for Unspecified Source of Cells: Historical Trends (2022-2023) and Forecasted Estimates (2024-2035) (USD Million)
  • Figure 26.1 Cell Therapy Manufacturing Market: Distribution by Scale of Operation, 2022, 2024 and 2035
  • Figure 26.2 Cell Therapy Manufacturing Market for Clinical Scale: Historical Trends (2022-2023) and Forecasted Estimates (2024-2035) (USD Million)
  • Figure 26.3 Clinical Scale Manufacturing Market for T Cell Therapies, 2022-2035 (USD Million)
  • Figure 26.4 Clinical Scale Manufacturing Market for T Cell Therapies: Distribution by Type of Therapy, 2022-2035 (USD Million)
  • Figure 26.5 Clinical Scale Manufacturing Market for T Cell Therapies: Distribution by Source of Cells, 2022-2035 (USD Million)
  • Figure 26.6 Clinical Scale Manufacturing Market for T Cell Therapies: Distribution by Geography, 2022-2035 (USD Million)
  • Figure 26.7 Clinical Scale Manufacturing Market for NK Cell Therapies, 2022-2035 (USD Million)
  • Figure 26.8 Clinical Scale Manufacturing Market for NK Cell Therapies: Distribution by Source of Cells, 2022-2035 (USD Million)
  • Figure 26.9 Clinical Scale Manufacturing Market for NK Cell Therapies: Distribution by Geography, 2022-2035 (USD Million)
  • Figure 26.10 Clinical Scale Manufacturing Market for Dendritic Cell Therapies, 2022-2035 (USD Million)
  • Figure 26.11 Clinical Scale Manufacturing Market for Dendritic Cell Therapies: Distribution by Source of Cells, 2022-2035 (USD Million)
  • Figure 26.12 Clinical Scale Manufacturing Market for Dendritic Cell Therapies: Distribution by Geography, 2022-2035 (USD Million)
  • Figure 26.13 Clinical Scale Manufacturing Market for Stem Cell Therapies, 2022-2035 (USD Million)
  • Figure 26.14 Clinical Scale Manufacturing Market for Stem Cell Therapies: Distribution by Source of Cells, 2022-2035 (USD Million)
  • Figure 26.15 Clinical Scale Manufacturing Market for Stem Cell Therapies: Distribution by Geography, 2022-2035 (USD Million)
  • Figure 26.16 Cell Therapy Manufacturing Market for Commercial Scale: Historical Trends (2022-2023) and Forecasted Estimates (2024-2035) (USD Million)
  • Figure 26.17 Commercial Scale Manufacturing Market for T Cell Therapies, 2022-2035 (USD Million)
  • Figure 26.18 Commercial Scale Manufacturing Market for T Cell Therapies: Distribution by Type of Therapy, 2022-2035 (USD Million)
  • Figure 26.19 Commercial Scale Manufacturing Market for T Cell Therapies: Distribution by Source of Cells, 2022-2035 (USD Million)
  • Figure 26.20 Commercial Scale Manufacturing Market for T Cell Therapies: Distribution by Geography, 2022-2035 (USD Million)
  • Figure 26.21 Commercial Scale Manufacturing Market for Dendritic Cell Therapies, 2022-2035 (USD Million)
  • Figure 26.22 Commercial Scale Manufacturing Market for Dendritic Cell Therapies: Distribution by Geography, 2022-2035 (USD Million)
  • Figure 26.23 Commercial Scale Manufacturing Market for Stem Cell Therapies, 2022-2035 (USD Million)
  • Figure 26.24 Commercial Scale Manufacturing Market for Stem Cell Therapies: Distribution by Source of Cells, 2022-2035 (USD Million)
  • Figure 26.25 Commercial Scale Manufacturing Market for Stem Cell Therapies: Distribution by Geography, 2022-2035 (USD Million
  • Figure 27.1 Cell Therapy Manufacturing Market: Distribution by Type of Manufacturer, 2022, 2024 and 2035
  • Figure 27.2 Cell Therapy Manufacturing Market for In-house Manufacturers: Historical Trends (2022-2023) and Forecasted Estimates (2024-2035) (USD Million)
  • Figure 27.3 Cell Therapy Manufacturing Market for Contract Manufacturing Organizations: Historical Trends (2022-2023) and Forecasted Estimates (2024-2035) (USD Million)
  • Figure 28.1 Cell Therapy Manufacturing Market: Distribution by Geography, 2022, 2024 and 2035
  • Figure 28.2 Cell Therapy Manufacturing Market in North America: Historical Trends (2022-2023) and Forecasted Estimates (2024-2035) (USD Million)
  • Figure 28.3 Cell Therapy Manufacturing Market in Europe: Historical Trends (2022-2023) and Forecasted Estimates (2024-2035) (USD Million)
  • Figure 28.4 Cell Therapy Manufacturing Market in Asia Pacific: Historical Trends (2022-2023) and Forecasted Estimates (2024-2035) (USD Million)
  • Figure 28.5 Cell Therapy Manufacturing Market in Rest of the World: Historical Trends (2022-2023) and Forecasted Estimates (2024-2035) (USD Million
  • Figure 29.1 Cell Therapy Manufacturing: SWOT Analysis
  • Figure 29.2 Comparison of SWOT Factors: Harvey Ball Analysis
  • Figure 30.1 Survey Insights: Distribution of Respondents by Type of Organization
  • Figure 30.2 Survey Insights: Distribution of Respondents by Location of Manufacturing Facility
  • Figure 30.3 Survey Insights: Distribution by Designation and Seniority of Respondents
  • Figure 30.4 Survey Insights: Distribution by Type of Cell Therapy
  • Figure 30.5 Survey Insights: Distribution by Scale of Operation
  • Figure 30.6 Survey Insights: Distribution by Source of Cells
  • Figure 30.7 Survey Insights: Distribution by Cell Culture System
  • Figure 30.8 Survey Insights: Distribution by Availability of Fill / Finish Services
  • Figure 31.1 Concluding Remarks: Market Landscape
  • Figure 31.2 Concluding Remarks: Partnerships and Collaborations
  • Figure 31.3 Concluding Remarks: Mergers and Acquisitions
  • Figure 31.4 Concluding Remarks: Recent Expansions
  • Figure 31.5 Concluding Remarks: Big Pharma Initiatives
  • Figure 31.6 Concluding Remarks: Capacity Analysis
  • Figure 31.7 Concluding Remarks: Demand Analysis
  • Figure 31.8 Concluding Remarks: Total Cost of Ownership
  • Figure 31.9 Concluding Remarks: Market Sizing and Opportunity Analysis (1/2)
  • Figure 31.10 Concluding Remarks: Market Sizing and Opportunity Analysis (2/2)
目次
Product Code: RA100392

The cell therapy manufacturing market is valued at USD 4.90 billion in 2024 growing at a CAGR of 9.90% during the forecast period 2024-2035.

Currently, over 300 cell therapies are in various stages of clinical development, with more than 1,930 clinical studies initiated since 2019 focusing on these candidates. Several of these commercialized cell therapies have emerged as top-selling drugs in the healthcare sector. For example, Gilead Sciences reported that Yescarta(R) achieved sales exceeding USD 1.5 billion, while Tecartus(R) generated sales of USD 370 million in 2023.

Given the substantial evidence supporting the clinical benefits and therapeutic potential of cell therapies, stakeholders are now concentrating on optimizing the manufacturing processes for these therapies. In recent years, numerous advanced automation technologies and platforms have been developed, demonstrating the potential to significantly lower manufacturing costs, thus making these products more affordable. One notable innovation, GMP-In-A Box, offers several advantages, including increased throughput, reduced idle time between batch runs, and decreased manual labor. However, the overall automation process faces challenges due to the complex steps involved in cell therapy manufacturing. Additionally, the lack of specialized infrastructure and trained personnel in this field poses significant obstacles to the growth of this segment.

Key Market Segments

Type of Cell Therapy

  • T Cell Therapies
  • NK Cell Therapies
  • Dendritic Cell Therapies
  • Stem Cell Therapies

Source of Cells

  • Autologous
  • Allogeneic
  • Unspecified

Scale of Operation

  • Clinical
  • Commercial

Type of Manufacturer

  • In-house Manufacturing
  • Contract Manufacturing Organization

Geography

  • North America
  • Europe
  • Asia-Pacific
  • Rest of the World

Research Coverage:

  • A general introduction to cell therapies, along with information on the key challenges and factors influencing the cell therapy manufacturing market. It provides details on the automation tools and technologies being utilized for improving manufacturing processes and the future prospects in this domain.
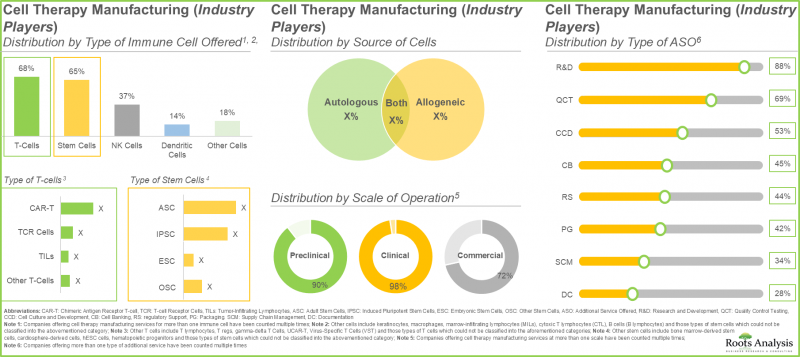
  • An overview of the current market landscape with respect to the industry players engaged in the manufacturing of cell-based therapies. It features information on their company size, year of establishment, location of headquarters, location of manufacturing facilities, type of manufacturer (in-house manufacturers and contract manufacturing organizations), type of cell manufactured (immune cells, stem cells and others), source of cells (autologous and allogeneic), scale of operation (preclinical, clinical and commercial) and additional services offered (research and development, cell culture development, cell banking, documentation, testing, packaging, supply chain management and regulatory support).
  • An overview of the current cell therapy manufacturing market landscape with respect to the non-industry players engaged in the manufacturing of cell-based therapies. It features information on their year of establishment, location of headquarters, location of manufacturing facilities, type of manufacturer (in-house manufacturers and contract manufacturing organizations), type of cell manufactured (immune cells, stem cells and others), source of cells (autologous and allogeneic), scale of operation (preclinical, clinical and commercial) and additional services offered (research and development, cell culture development, cell banking, documentation, testing, packaging, supply chain management and regulatory support).
  • A discussion on cell therapy manufacturing related regulations across various geographies, including North America (focusing on the US), Europe and Asia (focusing on Japan and China), featuring an analysis of the diverse certifications / accreditations awarded to the manufacturing facilities by important regulatory bodies across the globe.
  • An overview of the several roadmaps published by different agencies across the globe in order to provide strategies to advance cell therapy manufacturing process.
  • An elaborate discussion on the role of technology automation in cell therapy manufacturing in order to optimize the current manufacturing practices with the use of closed and single use systems. Further, it features a roadmap that provides information on the steps to develop automation devices, supported by two case studies. It also presents a qualitative analysis on the cost incurred while manufacturing cell-based therapies using manual versus automated manufacturing approaches. In addition, it features a list of organizations that offer automated technologies for manufacturing operations or provide services to therapy developers to automate their cell therapy production process.
  • Elaborate profiles of industry players involved in cell therapy manufacturing. Each profile features a brief overview of the company, along with details related to its service portfolio, its manufacturing capabilities and facilities, recent developments and an informed future outlook.
  • Elaborate profiles of non-industry players involved in cell therapy manufacturing, featuring an overview of the organization, along with details related to their service portfolio and manufacturing facilities.
  • A discussion on non-profit organizations in cell therapy manufacturing, featuring a list of organizations that are actively involved in the development and production of cell-based therapies, across different geographical locations, along with information on various international / national societies that help in disseminating knowledge about the advancement of these therapies to the general community.
  • An analysis of completed, ongoing and planned clinical trial, based on several relevant parameters, such as trial registration year, enrolled patient population, trial status, trial phase, type of sponsor / collaborator, patient segment, study design, most active players (in terms of number of clinical trials conducted) and geographical distribution of trials.
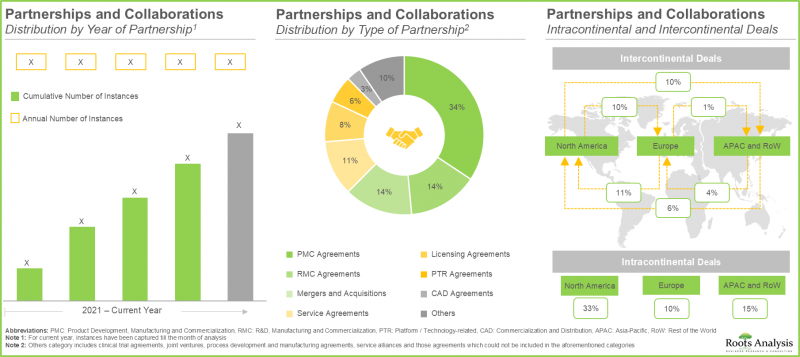
  • A detailed analysis of the recent partnerships and collaborations inked by players focused on the manufacturing of cell-based therapies, since 2016, based on several relevant parameters, such as the year of partnership, type of partnership, type of cells manufactured, scale of operation, most active players (in terms of number of partnerships) and geographical distribution.
  • An analysis of the various expansion initiatives undertaken by service providers engaged in this domain in order to augment their respective cell therapy manufacturing capabilities, during the period 2017-2024, based on several relevant parameters, such as year of expansion, type of expansion, type of cell manufactured, scale of operation, location of expanded manufacturing facility, and most active players (in terms of number of expansion initiatives undertaken).
  • An in-depth analysis of the various cell therapy manufacturing focused initiatives undertaken by big pharma players, based on several relevant parameters, such as number of initiatives, year of initiative, purpose of initiative, type of initiative, scale of operation and type of cell manufactured.
  • An estimate of the overall, installed capacity for the manufacturing of cell-based therapies, based on information reported by various industry and non-industry stakeholders in the public domain, highlighting the distribution of the available capacity (in terms of cleanroom area and number of cleanrooms) on the basis of scale of operation (preclinical, clinical and commercial), and key geographical regions (North America, Europe, Asia Pacific and Rest of the World).
  • Informed estimates of the annual commercial and clinical demand for cell therapies (in terms of number of patients), based on type of cell therapy and key geographical regions.
  • A detailed analysis of various factors that are likely to influence the price of cell-based therapies, featuring different models / approaches adopted by manufacturers in order to determine the price of their proprietary offerings.
  • A qualitative analysis that highlights the various factors that need to be taken into consideration by cell therapy developers, while deciding whether to manufacture their respective products in-house or engage the services of a CMO.
  • A detailed total cost of ownership analysis based on company size, for cell therapy manufacturing organizations, over a period of 20 years.
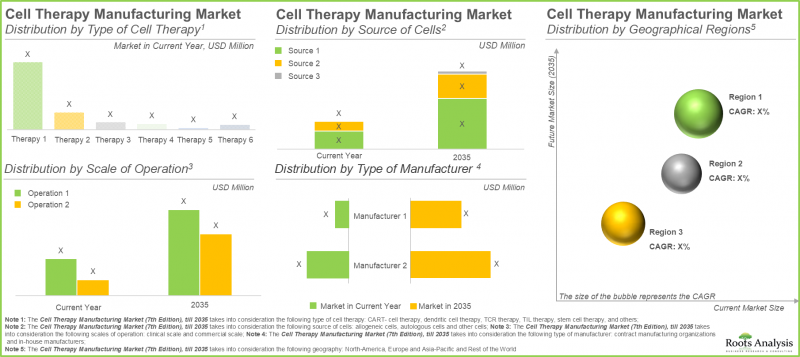
  • A detailed cell therapy manufacturing market forecast analysis in order to estimate the existing market size and future opportunity over the next decade. Based on multiple parameters, such as number of ongoing / planned clinical studies, cell therapy manufacturing costs, target patient population, and anticipated adoption of such therapies, we have provided informed estimates on the evolution of the market in the short to mid-term and mid to long-term, for the forecast period 2024-2035. The report also features the likely distribution of the current and forecasted opportunity within the market. Further, in order to account for future uncertainties and to add robustness to our model, we have provided three forecast scenarios, namely conservative, base and optimistic scenarios, representing different tracks of the industry's growth.
  • Detailed projections of the current and future cell therapy manufacturing market across different types of cell therapy, such as T cell therapies, NK cell therapies, dendritic cell therapies, and stem cell therapies.
  • Detailed projections of the current and future cell therapy manufacturing industry across different sources of cell, such as autologous, allogeneic and unspecified.
  • Detailed projections of the current and future cell therapy manufacturing market across different scales of operation, such as clinical and commercial.
  • Detailed projections of the current and future cell therapy manufacturing revenue across different types of manufacturers, such as in-house manufacturers and contract manufacturing organizations.
  • Detailed projections of the current and future cell therapy manufacturing market across various geographies, such as North America, Europe, Asia Pacific, and Rest of the World.
  • A discussion on affiliated trends, key drivers and challenges, which are likely to impact the industry's evolution, under an elaborate SWOT framework, along with a Harvey ball analysis, highlighting the relative effect of each SWOT parameter on the overall market dynamics.
  • Insights generated in a market-wide survey, featuring inputs solicited from experts who are directly / indirectly involved in the development and / or manufacturing of cell-based therapies.

Key Benefits of Buying this Report

  • The report offers market leaders and newcomers valuable insights into revenue estimations for both the overall market and its sub-segments.
  • Stakeholders can utilize the report to enhance their understanding of the competitive landscape, allowing for improved business positioning and more effective go-to-market strategies.
  • The report provides stakeholders with a pulse on the Cell Therapy Manufacturing Market, furnishing them with essential information on significant market drivers, barriers, opportunities, and challenges.

Leading Market Companies

  • AGC Biologics
  • BioNTech Innovative Manufacturing Services
  • Cell and Gene Therapy Catapult
  • Cell Therapies
  • Center for Cell and Gene Therapy, Baylor College of Medicine
  • Centre for Cell Manufacturing Ireland, National University of Ireland
  • Charles River Laboratories
  • Clinical Cell and Vaccine Production Facility, University of Pennsylvania
  • FUJIFILM Cellular Dynamics
  • Guy's and St. Thomas' GMP Facility, Guy's Hospital
  • KBI Biopharma
  • Laboratory for Cell and Gene Medicine, Stanford University
  • Lonza

MEDINET

  • Minaris Regenerative Medicine
  • Molecular and Cellular Therapeutics, University of Minnesota
  • Newcastle Cellular Therapies Facility, Newcastle University
  • Nikon CeLL Innovation
  • Rayne Cell Therapy Suite, King's College London
  • RoslinCT
  • Scottish National Blood Transfusion Services Cellular Therapy Facility, Scottish Centre for Regenerative Medicine
  • Sydney Cell and Gene Therapy
  • Thermo Fisher Scientific
  • WuXi AppTec

TABLE OF CONTENTS

1. PREFACE

  • 1.1. Introduction
  • 1.2. Market Share Insights
  • 1.3. Key Market Insights
  • 1.4. Report Coverage
  • 1.5. Key Questions Answered
  • 1.6. Chapter Outlines

2. RESEARCH METHODOLOGY

  • 2.1. Chapter Overview
  • 2.2. Research Assumptions
  • 2.3. Project Methodology
  • 2.4. Forecast Methodology
  • 2.5. Robust Quality Control
  • 2.6. Key Market Segmentations
  • 2.7. Key Considerations
    • 2.7.1. Demographics
    • 2.7.2. Economic Factors
    • 2.7.3. Government Regulations
    • 2.7.4. Supply Chain
    • 2.7.5. COVID Impact / Related Factors
    • 2.7.6. Market Access
    • 2.7.7. Healthcare Policies
    • 2.7.8. Industry Consolidation

3. ECONOMIC AND OTHER PROJECT SPECIFIC CONSIDERATIONS

  • 3.1. Chapter Overview
  • 3.2. Market Dynamics
    • 3.2.1. Time Period
      • 3.2.1.1. Historical Trends
      • 3.2.1.2. Current and Forecasted Estimates
    • 3.2.2. Currency Coverage
      • 3.2.2.1. Overview of Major Currencies Affecting the Market
      • 3.2.2.2. Impact of Currency Fluctuations on the Industry
    • 3.2.3. Foreign Exchange Impact
      • 3.2.3.1. Evaluation of Foreign Exchange Rates and their Impact on Market
      • 3.2.3.2. Strategies for Mitigating Foreign Exchange Risk
    • 3.2.4. Recession
      • 3.2.4.1. Historical Trends Analysis of Past Recessions and Lessons Learnt
      • 3.2.4.2. Assessment of Current Economic Conditions and Potential Impact on the Market
    • 3.2.5. Inflation
      • 3.2.5.1. Measurement and Analysis of Inflationary Pressures in the Economy
      • 3.2.5.2. Potential Impact of Inflation on the Market Evolution

4. EXECUTIVE SUMMARY

5. INTRODUCTION

  • 5.1. Chapter Overview
  • 5.2. Introduction to Cell-based Therapies
    • 5.2.1. Comparison of Cell-based Therapies and Other Biotechnological Products
    • 5.2.2. Classification of Advanced Therapy Medicinal Products (ATMPs)
    • 5.2.3. Current Market Landscape of ATMPs
  • 5.3. Overview of Cell Therapy Manufacturing
  • 5.4. Cell Therapy Manufacturing Models
    • 5.4.1. Centralized Manufacturing
    • 5.4.2. Decentralized Manufacturing
  • 5.5. Scalability of Cell Therapy Manufacturing Processes
    • 5.5.1. Scale-up
    • 5.5.2. Scale-out
  • 5.6. Types of Cell Therapy Manufacturers
  • 5.7. Key Challenges for Manufacturing Cell Therapies
  • 5.8. Key Factors Influencing Cell Therapy Manufacturing
    • 5.8.1. Characterization
    • 5.8.2. Cost of Goods
  • 5.9. Automation of Cell Therapy Manufacturing Processes
  • 5.10. Cell Therapy Manufacturing Supply Chain
  • 5.11. Future Perspectives

6. CELL THERAPY MANUFACTURERS (INDUSTRY PLAYERS): MARKET LANDSCAPE

  • 6.1. Chapter Overview
  • 6.2. Industry Players: Overall Market Landscape
    • 6.2.1. Analysis by Year of Establishment
    • 6.2.2. Analysis by Company Size
    • 6.2.3. Analysis by Location of Headquarters
    • 6.2.4. Analysis by Company Size and Location of Headquarters
    • 6.2.5. Analysis by Location of Manufacturing Facility
    • 6.2.6. Analysis by Type of Manufacturer
    • 6.2.7. Analysis by Location of Headquarters and Type of Manufacturer
    • 6.2.8. Analysis by Type of Cell Manufactured
    • 6.2.9. Analysis by Location of Headquarters and Type of Cell Manufactured
    • 6.2.10. Analysis by Source of Cells
    • 6.2.11. Analysis by Type of Cell Manufactured and Source of Cells
    • 6.2.12. Analysis by Scale of Operation
    • 6.2.13. Analysis by Additional Services Offered
    • 6.2.14. Analysis by Company Size and Additional Services Offered

7. CELL THERAPY MANUFACTURERS (NON-INDUSTRY PLAYERS): MARKET LANDSCAPE

  • 7.1. Chapter Overview
  • 7.2. Non-Industry Players: Overall Market Landscape
    • 7.2.1. Analysis by Year of Establishment
    • 7.2.2. Analysis by Location of Headquarters
    • 7.2.3. Analysis by Location of Manufacturing Facility
    • 7.2.4. Analysis by Type of Manufacturer
    • 7.2.5. Analysis by Location of Headquarters and Type of Manufacturer
    • 7.2.6. Analysis by Type of Cell Manufactured
    • 7.2.7. Analysis by Location of Headquarters and Type of Cell Manufactured
    • 7.2.8. Analysis by Source of Cells
    • 7.2.9. Analysis by Type of Cell Manufactured and Source of Cells
    • 7.2.10. Analysis by Scale of Operation
    • 7.2.11. Analysis by Additional Services Offered

8. REGULATORY LANDSCAPE

  • 8.1. Chapter Overview
  • 8.2. Current Scenario
    • 8.2.1. Regulatory Guidelines in North America
    • 8.2.2. Regulatory Guidelines in Europe
    • 8.2.3. Regulatory Guidelines in Asia Pacific
      • 8.2.3.1. Regulatory Guidelines in Japan
      • 8.2.3.2. Regulatory Guidelines in China
    • 8.2.4. Conditional Approvals
  • 8.3. Regulatory Authorities for Cell Therapy Manufacturing
    • 8.3.1. Cell Therapy Manufacturing (Industry Players): Regulatory Authorities
  • 8.4. Summary of Guidelines for Early-Stage Manufacturing of Cell Therapies
  • 8.5. Existing Challenges to Early-Stage Manufacturing of Cell Therapies
  • 8.6. Variability in Regulatory Guidelines across Different Geographies

9. ROADMAPS FOR OVERCOMING CHALLENGES

  • 9.1. Chapter Overview
  • 9.2. Roadmap for the US
    • 9.2.1. Cell Processing
    • 9.2.2. Cell Preservation, Distribution and Handling
    • 9.2.3. Process Automation and Data Analytics
    • 9.2.4. Process Monitoring and Quality Control
    • 9.2.5. Standardization and Regulatory Support
    • 9.2.6. Workforce Development
    • 9.2.7. Supply Chain and Logistics
  • 9.3. Roadmaps for Other Geographies
    • 9.3.1. Europe
    • 9.3.2. Asia Pacific

10. AUTOMATION TECHNOLOGIES FOR CELL THERAPY MANUFACTURING

  • 10.1. Chapter Overview
  • 10.2. Automation of Cell Therapy Manufacturing Processes
    • 10.2.1. Closed Systems
    • 10.2.2. Single-use Systems
    • 10.2.3. Modular Systems
  • 10.3. Growth Drivers and Roadblocks
  • 10.4. Case Studies
    • 10.4.1. Roadmap to Develop an Automated Cell Manufacturing / Processing Device
    • 10.4.2. Automating the Cell Therapy Manufacturing Process
  • 10.5. GMP-in-a-Box
  • 10.6. List of Automated and Closed Cell Therapy Processing Systems
  • 10.7. Comparative Analysis of Manual and Automated Processes

11. COMPANY PROFILES: INDUSTRY PLAYERS

  • 11.1. Chapter Overview
  • 11.2. Service Providers in North America
    • 11.2.1. AGC Biologics
      • 11.2.1.1. Company Overview
      • 11.2.1.2. Financial Information
      • 11.2.1.3. Service Portfolio
      • 11.2.1.4. Manufacturing Facilities and Capabilities
      • 11.2.1.5. Recent Developments and Future Outlook
    • 11.2.2. Charles River Laboratories
      • 11.2.2.1. Company Overview
      • 11.2.2.2. Financial Information
      • 11.2.2.3. Service Portfolio
      • 11.2.2.4. Manufacturing Facilities and Capabilities
      • 11.2.2.5. Recent Developments and Future Outlook
    • 11.2.3. FUJIFILM Cellular Dynamics
      • 11.2.3.1. Company Overview
      • 11.2.3.2. Service Portfolio
      • 11.2.3.3. Manufacturing Facilities and Capabilities
      • 11.2.3.4. Recent Developments and Future Outlook
    • 11.2.4. KBI Biopharma
      • 11.2.4.1. Company Overview
      • 11.2.4.2. Financial Information
      • 11.2.4.3. Service Portfolio
      • 11.2.4.4. Manufacturing Facilities and Capabilities
      • 11.2.4.5. Recent Developments and Future Outlook
    • 11.2.5. Thermo Fisher Scientific
      • 11.2.5.1. Company Overview
      • 11.2.5.2. Financial Information
      • 11.2.5.3. Service Portfolio
      • 11.2.5.4. Manufacturing Facilities and Capabilities
      • 11.2.5.5. Recent Developments and Future Outlook
    • 11.2.6. WuXi Advanced Therapies
      • 11.2.6.1. Company Overview
      • 11.2.6.2. Service Portfolio
      • 11.2.6.3. Manufacturing Facilities and Capabilities
      • 11.2.6.4. Recent Developments and Future Outlook
  • 11.3. Service Providers in Europe
    • 11.3.1. BioNTech Innovative Manufacturing Services
      • 11.3.1.1. Company Overview
      • 11.3.1.2. Service Portfolio
      • 11.3.1.3. Manufacturing Facilities and Capabilities
      • 11.3.1.4. Recent Developments and Future Outlook
    • 11.3.2. Cell and Gene Therapy Catapult
      • 11.3.2.1. Company Overview
      • 11.3.2.2. Service Portfolio
      • 11.3.2.3. Manufacturing Facilities and Capabilities
      • 11.3.2.4. Recent Developments and Future Outlook
    • 11.3.3. Lonza
      • 11.3.3.1. Company Overview
      • 11.3.3.2. Financial Information
      • 11.3.3.3. Service Portfolio
      • 11.3.3.4. Manufacturing Facilities and Capabilities
      • 11.3.3.5. Recent Developments and Future Outlook
    • 11.3.4. RoslinCT
      • 11.3.4.1. Company Overview
      • 11.3.4.2. Service Portfolio
      • 11.3.4.3. Manufacturing Facilities and Capabilities
      • 11.3.4.4. Recent Developments and Future Outlook
  • 11.4. Service Providers in Asia Pacific
    • 11.4.1. Cell Therapies
      • 11.4.1.1. Company Overview
      • 11.4.1.2. Service Portfolio
      • 11.4.1.3. Manufacturing Facilities and Capabilities
      • 11.4.1.4. Recent Developments and Future Outlook
    • 11.4.2. Minaris Regenerative Medicine
      • 11.4.2.1. Company Overview
      • 11.4.2.2. Service Portfolio
      • 11.4.2.3. Manufacturing Facilities and Capabilities
      • 11.4.2.4. Recent Developments and Future Outlook
    • 11.4.3. MEDINET
      • 11.4.3.1. Company Overview
      • 11.4.3.2. Service Portfolio
      • 11.4.3.3. Manufacturing Facilities and Capabilities
      • 11.4.3.4. Recent Developments and Future Outlook
    • 11.4.4. Nikon CeLL Innovation
      • 11.4.4.1. Company Overview
      • 11.4.4.2. Service Portfolio
      • 11.4.4.3. Manufacturing Facilities and Capabilities
      • 11.4.4.4. Recent Developments and Future Outlook

12. COMPANY PROFILES: NON-INDUSTRY PLAYERS

  • 12.1. Chapter Overview
  • 12.2. Center for Cell and Gene Therapy, Baylor College of Medicine
    • 12.2.1. Overview
    • 12.2.2. Service Portfolio
    • 12.2.3. Manufacturing Facilities and Capabilities
  • 12.3. Centre for Cell Manufacturing Ireland, National University of Ireland
    • 12.3.1. Overview
    • 12.3.2. Service Portfolio
    • 12.3.3. Manufacturing Facilities and Capabilities
  • 12.4. Clinical Cell and Vaccine Production Facility, University of Pennsylvania
    • 12.4.1. Overview
    • 12.4.2. Service Portfolio
    • 12.4.3. Manufacturing Facilities and Capabilities
  • 12.5. Guy's and St. Thomas' GMP Facility, Guy's Hospital
    • 12.5.1. Overview
    • 12.5.2. Service Portfolio
    • 12.5.3. Manufacturing Facilities and Capabilities
  • 12.6. Laboratory for Cell and Gene Medicine, Stanford University
    • 12.6.1. Overview
    • 12.6.2. Service Portfolio
    • 12.6.3. Manufacturing Facilities and Capabilities
  • 12.7. Molecular and Cellular Therapeutics, University of Minnesota
    • 12.7.1. Overview
    • 12.7.2. Service Portfolio
    • 12.7.3. Manufacturing Facilities and Capabilities
  • 12.8. Newcastle Cellular Therapies Facility, Newcastle University
    • 12.8.1. Overview
    • 12.8.2. Service Portfolio
    • 12.8.3. Manufacturing Facilities and Capabilities
  • 12.9. Rayne Cell Therapy Suite, King's College London
    • 12.9.1. Overview
    • 12.9.2. Service Portfolio
    • 12.9.3. Manufacturing Facilities and Capabilities
  • 12.10. Scottish National Blood Transfusion Services Cellular Therapy Facility, Scottish Centre for Regenerative Medicine
    • 12.10.1. Overview
    • 12.10.2. Service Portfolio
    • 12.10.3. Manufacturing Facilities and Capabilities
  • 12.11. Sydney Cell and Gene Therapy
    • 12.11.1. Overview
    • 12.11.2. Service Portfolio
    • 12.11.3. Manufacturing Facilities and Capabilities

13. NON-PROFIT ORGANIZATIONS IN CELL THERAPY MANUFACTURING

  • 13.1. Chapter Overview
  • 13.2. Cell Therapy Manufacturing: Non-Profit Organizations
    • 13.2.1. CellCAN
    • 13.2.2. Cell Therapy Manufacturing Cooperative Research Center
    • 13.2.3. National Cell Manufacturing Consortium (NCMC)
    • 13.2.4. California Institute of Regenerative Medicine (CIRM)
  • 13.3. Cell Therapy Manufacturing: International Societies

14. CLINICAL TRIAL ANALYSIS

  • 14.1. Chapter Overview
  • 14.2. Scope and Methodology
  • 14.3. Cell Therapies: Clinical Trial Analysis
    • 14.3.1. Analysis by Trial Registration Year
    • 14.3.2. Analysis by Tria Registration Year and Enrolled Patient Population
    • 14.3.3. Analysis by Trial Status
    • 14.3.4. Analysis by Trial Registration Year and Trial Status
    • 14.3.5. Analysis by Trial Phase
    • 14.3.6. Analysis of Number of Clinical Trials and Enrolled Patient Population by Trial Phase
    • 14.3.7. Analysis by Type of Sponsor / Collaborator
    • 14.3.8. Analysis by Patient Segment
    • 14.3.9. Analysis by Study Design
    • 14.3.10. Most Active Players: Analysis by Number of Registered Trials
    • 14.3.11. Analysis by Number of Trials and Geography
    • 14.3.12. Analysis by Number of Trials, Trial Status and Geography
    • 14.3.13. Analysis by Enrolled Patient Population, Trial Status and Geography

15. PARTNERSHIPS AND COLLABORATIONS

  • 15.1. Chapter Overview
  • 15.2. Partnership Models
  • 15.3. Cell Therapy Manufacturing: List of Partnerships
    • 15.3.1. Analysis by Year of Partnership
    • 15.3.2. Analysis by Type of Partnership
    • 15.3.3. Analysis by Year and Type of Partnership
  • 15.4. Analysis by Type of Cells
  • 15.5. Analysis by Scale of Operation
  • 15.6. Analysis by Region
    • 15.6.1. Country-wise Distribution
    • 15.6.2. Continent-wise Distribution
  • 15.7. Most Active Players: Analysis by Number of Partnerships
  • 15.8. Cell Therapy Manufacturing: List of Mergers and Acquisitions
    • 15.8.1. Analysis by Year of Agreement
    • 15.8.2. Analysis by Type of Agreement
    • 15.8.3. Analysis by Year of Acquisition and Type of Cells
    • 15.8.4. Analysis by Region
      • 15.8.4.1. Country-wise Distribution
      • 15.8.4.2. Continent-wise Distribution
      • 15.8.4.3. Intercontinental and Intracontinental Deals
    • 15.8.5. Ownership Change Matrix

16. RECENT EXPANSIONS

  • 16.1. Chapter Overview
  • 16.2. Cell Therapy Manufacturing: List of Expansions
    • 16.2.1. Analysis by Year of Expansion
    • 16.2.2. Analysis by Type of Expansion
    • 16.2.3. Analysis by Type of Cell Manufactured
    • 16.2.4. Analysis by Scale of Operation
    • 16.2.5. Analysis by Location of Manufacturing Facility
    • 16.2.6. Analysis by Type of Expansion and Location of Manufacturing Facility
    • 16.2.7. Most Active Players: Analysis by Number of Expansions
    • 16.2.8. Most Active Players: Analysis by Area of Expansion
    • 16.2.9. Analysis by Year and Location of Manufacturing Facility

17. BIG PHARMA INITIATIVES

  • 17.1. Chapter Overview
  • 17.2. List of Cell Therapy Manufacturing Focused Initiatives of Big Pharma Players
    • 17.2.1. Analysis by Number of Initiatives
    • 17.2.2. Analysis by Year of Initiative
    • 17.2.3. Analysis by Type of Initiative
      • 17.2.3.1. Analysis by Type of Partnership
      • 17.2.3.2. Analysis by Type of Expansion
    • 17.2.4. Analysis by Types of Cells Manufactured
    • 17.2.5. Analysis by Scale of Operation
    • 17.2.6. Analysis of Big Pharma Players by Year of Initiative
    • 17.2.7. Analysis by Year and Type of Initiative
    • 17.2.8. Analysis of Big Pharma Players by Types of Cells Manufactured
    • 17.2.9. Analysis of Big Pharma Players by Scale of Operation
  • 17.3. Competitive Benchmarking of Big Pharmaceutical Players
    • 17.3.1. Harvey Ball Analysis: Big Pharma Initiatives Summary
    • 17.3.2. Spider Web Analysis: Big Pharmaceutical Players

18. CAPACITY ANALYSIS

  • 18.1. Chapter Overview
  • 18.2. Industry Players: Key Assumptions and Methodology
    • 18.2.1. Cell Therapy Manufacturing: Installed Global Capacity (Number of Cleanrooms)
      • 18.2.1.1. Analysis by Company Size
      • 18.2.1.2. Analysis by Scale of Operation
      • 18.2.1.3. Analysis by Location of Manufacturing Facility
      • 18.2.1.4. Analysis by Company Size and Location of Manufacturing Facility
      • 18.2.1.5. Analysis by Scale of Operation and Location of Manufacturing Facility
    • 18.2.2. Cell Therapy Manufacturing: Installed Global Capacity (Cleanroom Area)
      • 18.2.2.1. Analysis by Company Size
      • 18.2.2.2. Analysis by Scale of Operation
      • 18.2.2.3. Analysis by Location of Manufacturing Facility
      • 18.2.2.4. Analysis by Company Size and Location of Manufacturing Facility
      • 18.2.2.5. Analysis by Scale of Operation and Location of Manufacturing Facility
  • 18.3. Non- Industry Players: Key Assumptions and Methodology
    • 18.3.1. Cell Therapy Manufacturing: Installed Global Capacity (Number of Cleanrooms)
      • 18.3.1.1. Analysis by Scale of Operation
      • 18.3.1.2. Analysis by Location of Manufacturing Facility
    • 18.3.2. Cell Therapy Manufacturing: Installed Global Capacity (Cleanroom Area)
      • 18.3.2.1. Analysis by Scale of Operation
      • 18.3.2.2. Analysis by Location of Manufacturing Facility
  • 18.4. Concluding Remarks

19. DEMAND ANALYSIS

  • 19.1. Chapter Overview
  • 19.2. Scope and Methodology
  • 19.3 Global Demand for Cell Therapy Manufacturing
  • 19.4. Global Clinical Demand for Cell Therapy Manufacturing
    • 19.4.1. Analysis by Type of Cell Therapy
    • 19.4.2. Analysis by Geography
  • 19.5. Global Commercial Demand for Cell Therapy Manufacturing
    • 19.5.1. Commercial Demand: Analysis by Type of Cell Therapy
    • 19.5.2. Commercial Demand: Analysis by Geography

20. COST PRICE ANALYSIS

  • 20.1. Chapter Overview
  • 20.2. Factors Contributing to the High Price of Cell Therapies
  • 20.3. Pricing Models for Cell Therapies
    • 20.3.1. Based on Associated Costs for T-Cell Therapies
    • 20.3.2. Based on Associated Costs for Stem Cell Therapies
    • 20.3.3. Based on Availability of Competing Products
    • 20.3.4. Based on Target Patient Segment
    • 20.3.5. Based on the Opinions of Industry Experts
  • 20.4. Cell Therapy Cost Optimization
    • 20.4.1. Role of Cost of Goods Sold
    • 20.4.2. Role of Automation
  • 20.5. Role of Cell Therapy Contract Manufacturing Organizations
  • 20.6. Reimbursement-related Considerations for Cell Therapies
    • 20.6.1. Case Study: The National Institute for Health and Care Excellence's (NICE) Appraisal of CAR-T Therapies

21. MAKE VERSUS BUY DECISION MAKING FRAMEWORK

  • 21.1. Chapter Overview
  • 21.2. Assumptions and Key Parameters
  • 21.3. Cell Therapy Manufacturing: Make versus Buy Decision Making
    • 21.3.1. Scenario 1
    • 21.3.2. Scenario 2
    • 21.3.3. Scenario 3
    • 21.3.4. Scenario 4
  • 21.4. Concluding Remarks

22. TOTAL COST OF OWNERSHIP FOR CELL THERAPY MANUFACTURING ORGANIZATIONS

  • 22.1. Chapter Overview
  • 22.2. Key Parameters
  • 22.3. Assumptions and Methodology
  • 22.4. Sample Dataset for the Estimation of Total Cost of Ownership
  • 22.5. Total Cost of Ownership for Mid-sized Cell Therapy Manufacturing Organizations, Y0-Y20
  • 22.6. Total Cost of Ownership for Mid-sized Cell Therapy Manufacturing Organizations: Analysis by CAPEX and OPEX, Y0 and Y20
    • 22.6.1. Total Cost of Ownership for Mid-sized Cell Therapy Manufacturing Organizations: Analysis by CAPEX, Y0
    • 22.6.2. Total Cost of Ownership for Mid-sized Cell Therapy Manufacturing Organizations: Analysis by OPEX, Y1-Y20

23. GLOBAL CELL THERAPY MANUFACTURING MARKET

  • 23.1. Chapter Overview
  • 23.2. Scope of the Forecast
  • 23.3. Input Data and Key Assumptions
  • 23.4. Forecast Methodology
  • 23.5. Global Cell Therapy Manufacturing Market, Historical Trends (2022-2023) and Forecasted Estimates (2024-2035)
    • 23.5.1. Scenario Analysis
      • 23.5.1.1. Conservative Scenario
      • 23.5.1.2. Optimistic Scenario
  • 23.6. Key Market Segmentations

24. CELL THERAPY MANUFACTURING MARKET, BY TYPE OF CELL THERAPY

  • 24.1. Chapter Overview
  • 24.2. Key Assumptions and Methodology
  • 24.3. Cell Therapy Manufacturing Market: Distribution by Type of Cell Therapy, 2022, 2024 and 2035
    • 24.3.1. T Cell Therapies: Historical Trends (2022-2023) and Forecasted Estimates (2024-2035)
      • 24.3.1.1. CAR-T Cell Therapies: Historical Trends (2022-2023) and Forecasted Estimates (2024-2035)
      • 24.3.1.2. TCR Cell Therapies: Historical Trends (2022-2023) and Forecasted Estimates (2024-2035)
      • 24.3.1.3. TIL Cell Therapies: Historical Trends (2022-2023) and Forecasted Estimates (2024-2035)
    • 24.3.2. Stem Cell Therapies: Historical Trends (2022-2023) and Forecasted Estimates (2024-2035)
    • 24.3.3. Dendritic Cell Therapies: Historical Trends (2022-2023) and Forecasted Estimates (2024-2035)
    • 24.3.4. NK Cell Therapies: Historical Trends (2022-2023) and Forecasted Estimates (2024-2035)
  • 24.4. Data Triangulation and Validation

25. CELL THERAPY MANUFACTURING MARKET, BY SOURCE OF CELLS

  • 25.1. Chapter Overview
  • 25.2. Key Assumptions and Methodology
  • 25.3. Cell Therapy Manufacturing Market: Distribution by Source of Cells, 2022, 2024 and 2035
    • 25.3.1. Autologous Source of Cells: Historical Trends (2022-2035) and Forecasted Estimates (2024-2035)
    • 25.3.2. Allogeneic Source of Cells: Historical Trends (2022-2035) and Forecasted Estimates (2024-2035)
    • 25.3.3. Unspecified Source of Cells: Historical Trends (2022-2035) and Forecasted Estimates (2024-2035)
  • 25.4. Data Triangulation and Validation

26. CELL THERAPY MANUFACTURING MARKET, BY SCALE OF OPERATION

  • 26.1. Chapter Overview
  • 26.2. Key Assumptions and Methodology
  • 26.3. Cell Therapy Manufacturing Market: Distribution by Scale of Operation, 2022, 2024 And 2035
    • 26.3.1. Clinical Scale: Historical Trends (2022-2023) and Forecasted Estimates (2024-2035)
  • 26.4. Clinical Cell Therapy Manufacturing Market, by Type of Therapy
    • 26.4.1. Clinical Scale Manufacturing Market for T Cell Therapies, 2022-2035
      • 26.4.1.1. Clinical Scale Manufacturing Market for T Cell Therapies: Distribution by Type of Therapy, 2022-2035
      • 26.4.1.2. Clinical Scale Manufacturing Market for T Cell Therapies: Distribution by Source of Cells, 2022-2035
      • 26.4.1.3. Clinical Scale Manufacturing Market for T Cell Therapies: Distribution by Geography, 2022-2035
    • 26.4.2. Clinical Scale Manufacturing Market for NK Cell Therapies, 2022-2035
      • 26.4.2.1. Clinical Scale Manufacturing Market for NK Cell Therapies: Distribution by Source of Cells, 2022-2035
      • 26.4.2.2. Clinical Scale Manufacturing Market for NK Cell Therapies: Distribution by Geography, 2022-2035
    • 26.4.3. Clinical Scale Manufacturing Market for Dendritic Cell Therapies, 2022-2035
      • 26.4.3.1. Clinical Scale Manufacturing Market for Dendritic Cell Therapies: Distribution by Source of Cells, 2022-2035
      • 26.4.3.2. Clinical Scale Manufacturing Market for Dendritic Cell Therapies: Distribution by Geography, 2022-2035
    • 26.4.4. Clinical Scale Manufacturing Market for Stem Cell Therapies, 2022-2035
      • 26.4.4.1. Clinical Scale Manufacturing Market for Stem Cell Therapies: Distribution by Source of Cells, 2022-2035
      • 26.4.4.2. Clinical Scale Manufacturing Market for Stem Cell Therapies: Distribution by Geography, 2022-2035
    • 26.4.5. Commercial Scale: Historical Trends (2022-2023) And Forecasted Estimates (2024-2035)
  • 26.5. Commercial Cell Therapy Manufacturing Market, by Type of Cell Therapy
    • 26.5.1. Commercial Scale Manufacturing Market for T Cell Therapies, 2022-2035
      • 26.5.1.1. Commercial Scale Manufacturing Market for T Cell Therapies: Distribution by Type of Therapy, 2022-2035
      • 26.5.1.2. Commercial Scale Manufacturing Market for T Cell Therapies: Distribution by Source of Cells, 2022-2035
      • 26.5.1.3. Commercial Scale Manufacturing Market for T Cell Therapies: Distribution by Geography, 2022-2035
    • 26.5.2. Commercial Scale Manufacturing Market for Dendritic Cell Therapies, 2022-2035
      • 26.5.2.1. Commercial Scale Manufacturing Market for Dendritic Cell Therapies: Distribution by Geography, 2022-2035
    • 26.5.3. Commercial Scale Manufacturing Market for Stem Cell Therapies, 2022-2035
      • 26.5.3.1. Commercial Scale Manufacturing Market for Stem Cell Therapies: Distribution by Source of Cells, 2022-2035
      • 26.5.3.2. Commercial Scale Manufacturing Market for Stem Cell Therapies, 2022-2035: Distribution by Geography
  • 26.6. Data Triangulation and Validation

27. CELL THERAPY MANUFACTURING MARKET, BY TYPE OF MANUFACTURER

  • 27.1. Chapter Overview
  • 27.2. Key Assumptions and Methodology
  • 27.3. Cell Therapy Manufacturing Market: Distribution by Type of Manufacturer, 2022, 2024 And 2035
    • 27.3.1. In-House Manufacturers: Historical Trends (2022-2023) and Forecasted Estimates (2024-2035)
    • 27.3.2. Contract Manufacturing Organizations: Historical Trends (2022-2023) and Forecasted Estimates (2024-2035)
  • 27.4. Data Triangulation and Validation

28. CELL THERAPY MANUFACTURING MARKET, BY GEOGRAPHY

  • 28.1. Chapter Overview
  • 28.2. Key Assumptions and Methodology
  • 28.3. Cell Therapy Manufacturing Market: Distribution by Geography, 2022, 2024 And 2035
    • 28.3.1. North America: Historical Trends (2022-2023) and Forecasted Estimates (2024-2035)
    • 28.3.2. Europe: Historical Trends (2022-2023) and Forecasted Estimates (2024-2035)
    • 28.3.3. Asia Pacific: Historical Trends (2022-2023) and Forecasted Estimates (2024-2035)
    • 28.3.4. Rest of the World: Historical Trends (2022-2023) And Forecasted Estimates (2024-2035)
  • 28.4. Data Triangulation and Validation

29. SWOT ANALYSIS

  • 29.1. Chapter Overview
  • 29.2. Strengths
  • 29.3. Weaknesses
  • 29.4. Opportunities
  • 29.5. Threats
  • 29.6. Comparison of SWOT Factors

30. SURVEY ANALYSIS

  • 30.1. Chapter Overview
  • 30.2. Analysis by Designation of Respondents
  • 30.3. Analysis by Type of Cell Therapy
  • 30.4. Analysis by Scale of Operation
  • 30.5. Analysis by Source of Cells
  • 30.6. Analysis by Type of Cell Culture System Used
  • 30.7. Analysis by Availability of Fill / Finish Services

31. CONCLUDING REMARKS

32. EXECUTIVE INSIGHTS

  • 32.1. Chapter Overview
  • 32.2. Marketing Manager, Cell Therapy, Mid-sized Company in Australia
  • 32.3. Director, Organization in UK
  • 32.4. Marketing Director, Small Company in Belgium
  • 32.5. Management Board Vice-President, Large Company in Poland
  • 32.6. Senior Director of Sales Advanced Therapies; Vice President of Marketing, Small Company in US
  • 32.7. Business Administration Department Manager, Mid-sized Company in Japan
  • 32.8. Chief Business Officer, Small Company in Netherlands
  • 32.9. Director of Finance and Facility Operations, Organization in US
  • 32.10. Senior Director, Very Large Company in Japan
  • 32.11. Chief Executive Officer, Mid-sized Company in UK
  • 32.12. Former Chief Technical Officer, Cell and Gene Therapy, Large Company in US
  • 32.13. Former Chief Executive Officer, Small Company in Netherlands
  • 32.14. Former General Manager, Small Company in France
  • 32.15. Chief Executive Officer, Large Company in China
  • 32.16. Executive Vice President Research and Development, Small Company in Israel
  • 32.17. Former Business Development Manager, Mid-sized Company in UK
  • 32.18. Professor and American Red Cross Chair in Transfusion Medicine, Organization in US
  • 32.19. Former Co-Founder and Chief Executive Officer, Small Company in Singapore
  • 32.20. Former Manager, Business Development and Operations-cGMP Manufacturing Unit, Mid-sized Company in Canada
  • 32.21. Manager of Business Development, Small Company in US
  • 32.22. Former Department Leader, Cell Therapy Innovation and Development, Mid-sized Company in France
  • 32.23. Former Chief Executive Officer, Mid-sized Company in Australia
  • 32.24. Chief Executive Officer, Small Company in Netherlands

33. APPENDIX 1: TABULATED DATA

34. APPENDIX 2: LIST OF COMPANIES AND ORGANIZATIONS