|
|
市場調査レポート
商品コード
1498618
デジタルプロダクトパスポート(DPP)の世界市場の考察、予測(~2030年)Global Digital Product Passports (DPP) Market Insights, Forecast to 2030 |
||||||

|
|||||||
カスタマイズ可能
適宜更新あり
|
|||||||


| デジタルプロダクトパスポート(DPP)の世界市場の考察、予測(~2030年) |
|
出版日: 2024年06月21日
発行: QYResearch
ページ情報: 英文 168 Pages
納期: 2~3営業日
|

全表示
- 概要
- 図表
- 目次
世界のデジタルプロダクトパスポート(DPP)の市場規模は、2024年の2,235万米ドルから2030年までに9億63万米ドルに達すると予測され、予測期間にCAGRで85.16%の成長が見込まれます。
米国・カナダの市場規模は、2024年の287万米ドルから2030年までに6,370万米ドルに達すると推定され、2024年~2030年の予測期間のCAGRは67.64%です。
中国の市場規模は、2025年の202万米ドルから2030年までに1億2,847万米ドルに達すると推定され、2025年~2030年の予測期間のCAGRは129.45%です。
欧州の市場規模は、2024年の1,948万米ドルから2030年までに6億4,857万米ドルに達すると推定され、2024年~2030年の予測期間のCAGRは79.36%です。
世界のデジタルプロダクトパスポート(DPP)の主要企業は、Avery Dennison、Sigma Technology、OPTEL、iPoint systems、Kezzler、Protokolなどです。2024年、世界の主要企業上位5社の収益シェアは約42.73%です。
当レポートでは、世界のデジタルプロダクトパスポート(DPP)市場について調査分析し、各地域の市場規模と予測、収益と市場シェア、主要企業のランキングなどの情報を提供しています。
目次
第1章 レポートの概要
- 調査範囲
- 市場の分析:タイプ別
- 世界のデジタルプロダクトパスポート(DPP)の市場規模成長率:タイプ別(2024年・2030年)
- ソフトウェア
- サービス
- 市場:用途別
- 世界のデジタルプロダクトパスポート(DPP)の市場シェア:用途別(2027年・2030年)
- 電池
- テキスタイル(衣料品、フットウェア)
- 鉄鋼
- 電子
- 家具(マットレスを含む)
- 化学品
- タイヤ
- アルミニウム
- その他
- 前提条件と制限
- 調査目的
第2章 世界の成長動向
- 世界のデジタルプロダクトパスポート(DPP)市場の見通し(2024年~2030年)
- 世界のデジタルプロダクトパスポート(DPP)の成長動向:地域別
- 世界のデジタルプロダクトパスポート(DPP)の市場規模:地域別(2024年・2030年)
- デジタルプロダクトパスポート(DPP)の市場規模:地域別(2024年~2030年)
- デジタルプロダクトパスポート(DPP)の市場力学
- デジタルプロダクトパスポート(DPP)産業の動向
- デジタルプロダクトパスポート(DPP)市場の促進要因
- デジタルプロダクトパスポート(DPP)市場の課題
- デジタルプロダクトパスポート(DPP)市場の抑制要因
第3章 競合情勢:主要企業別
- 世界のデジタルプロダクトパスポート(DPP)の収益:企業別
- 世界のデジタルプロダクトパスポート(DPP)収益:企業別(2024年~2030年)
- 世界のデジタルプロダクトパスポート(DPP)収益の市場シェア:企業別(2024年~2030年)
- 世界のデジタルプロダクトパスポート(DPP)の市場シェア:企業タイプ別(Tier 1・Tier 2・Tier 3)
- 世界のデジタルプロダクトパスポート(DPP)の主要企業、収益ランキング(2024年・2030年)
- 世界のデジタルプロダクトパスポート(DPP)の市場集中度
- 世界のデジタルプロダクトパスポート(DPP)の市場集中度(CR5)
- 世界のデジタルプロダクトパスポート(DPP)収益の10大・5大企業(2024年)
- 世界のデジタルプロダクトパスポート(DPP)の主要企業の本社、サービス地域
- 世界のデジタルプロダクトパスポート(DPP)の主要企業、製品、用途
- 世界のデジタルプロダクトパスポート(DPP)の主要企業、設立日
第4章 デジタルプロダクトパスポート(DPP)の内訳データ:タイプ別
第5章 デジタルプロダクトパスポート(DPP)の内訳データ:用途別
第6章 北米
- 北米のデジタルプロダクトパスポート(DPP)の市場規模(2024年~2030年)
- 北米のデジタルプロダクトパスポート(DPP)の市場規模:タイプ別
- 北米のデジタルプロダクトパスポート(DPP)の市場規模:タイプ別(2024年~2030年)
- 北米のデジタルプロダクトパスポート(DPP)の市場シェア:タイプ別(2024年~2030年)
- 北米のデジタルプロダクトパスポート(DPP)の市場規模:用途別
- 北米のデジタルプロダクトパスポート(DPP)の市場規模:用途別(2024年~2030年)
- 北米のデジタルプロダクトパスポート(DPP)の市場シェア:用途別(2024年~2030年)
- 北米のデジタルプロダクトパスポート(DPP)の市場規模:国別
- 北米のデジタルプロダクトパスポート(DPP)の市場規模:国別(2024年・2030年)
- 北米のデジタルプロダクトパスポート(DPP)の市場規模:国別(2024年~2030年)
- 北米のデジタルプロダクトパスポート(DPP)の市場シェア:国別(2024年~2030年)
- 米国
- カナダ
第7章 欧州
- 欧州のデジタルプロダクトパスポート(DPP)の市場規模(2024年~2030年)
- 欧州のデジタルプロダクトパスポート(DPP)の市場規模:タイプ別
- 欧州のデジタルプロダクトパスポート(DPP)の市場規模:タイプ別(2024年~2030年)
- 欧州のデジタルプロダクトパスポート(DPP)の市場シェア:タイプ別(2024年~2030年)
- 欧州のデジタルプロダクトパスポート(DPP)の市場規模:用途別
- 欧州のデジタルプロダクトパスポート(DPP)の市場規模:用途別(2024年~2030年)
- 欧州のデジタルプロダクトパスポート(DPP)の市場シェア:用途別(2024年~2030年)
- 欧州のデジタルプロダクトパスポート(DPP)の市場規模:国別
- 欧州のデジタルプロダクトパスポート(DPP)の市場規模:国別(2024年・2030年)
- 欧州のデジタルプロダクトパスポート(DPP)の市場規模:国別(2024年~2030年)
- 欧州のデジタルプロダクトパスポート(DPP)の市場規模:国別(2024年~2030年)
- ドイツ
- フランス
- 英国
- イタリア
- スペイン
第8章 中国
- 中国のデジタルプロダクトパスポート(DPP)の市場規模(2024年~2030年)
- 中国のデジタルプロダクトパスポート(DPP)の市場規模:タイプ別
- 中国のデジタルプロダクトパスポート(DPP)の市場規模:タイプ別(2024年~2030年)
- 中国のデジタルプロダクトパスポート(DPP)の市場シェア:タイプ別(2025年~2030年)
- 中国のデジタルプロダクトパスポート(DPP)の市場規模:用途別
- 中国のデジタルプロダクトパスポート(DPP)の市場規模:用途別(2024年~2030年)
- 中国のデジタルプロダクトパスポート(DPP)の市場シェア:用途別(2025年~2030年)
第9章 アジア(中国を除く)
- アジアのデジタルプロダクトパスポート(DPP)の市場規模(2024年~2030年)
- アジアのデジタルプロダクトパスポート(DPP)の市場規模:タイプ別
- アジアのデジタルプロダクトパスポート(DPP)の市場規模:タイプ別(2024年~2030年)
- アジアのデジタルプロダクトパスポート(DPP)の市場シェア:タイプ別(2025年~2030年)
- アジアのデジタルプロダクトパスポート(DPP)の市場規模:用途別
- アジアのデジタルプロダクトパスポート(DPP)の市場規模:用途別(2024年~2030年)
- アジアのデジタルプロダクトパスポート(DPP)の市場シェア:用途別(2025年~2030年)
- アジアのデジタルプロダクトパスポート(DPP)の市場規模:地域別
- アジアのデジタルプロダクトパスポート(DPP)の市場規模:地域別(2025年・2030年)
- アジアのデジタルプロダクトパスポート(DPP)の市場規模:地域別(2024年~2030年)
- アジアのデジタルプロダクトパスポート(DPP)の市場規模:地域別(2024年~2030年)
- 日本
- 韓国
- インド
第10章 中東・アフリカ・ラテンアメリカ
- 中東・アフリカ・ラテンアメリカのデジタルプロダクトパスポート(DPP)の市場規模(2024年~2030年)
- 中東・アフリカ・ラテンアメリカのデジタルプロダクトパスポート(DPP)の市場規模:タイプ別
- 中東・アフリカ・ラテンアメリカのデジタルプロダクトパスポート(DPP)の市場規模:タイプ別(2024年~2030年)
- 中東・アフリカ・ラテンアメリカのデジタルプロダクトパスポート(DPP)の市場シェア:タイプ別(2027年~2030年)
- 中東・アフリカ・ラテンアメリカのデジタルプロダクトパスポート(DPP)の市場規模:用途別
- 中東・アフリカ・ラテンアメリカのデジタルプロダクトパスポート(DPP)の市場規模:用途別(2024年~2030年)
- 中東・アフリカ・ラテンアメリカのデジタルプロダクトパスポート(DPP)の市場シェア:用途別(2027年~2030年)
- 中東・アフリカ・ラテンアメリカのデジタルプロダクトパスポート(DPP)の市場規模:国別
- 中東・アフリカ・ラテンアメリカのデジタルプロダクトパスポート(DPP)の市場規模:国別(2027年・2030年)
- 中東・アフリカ・ラテンアメリカのデジタルプロダクトパスポート(DPP)の市場規模:国別(2024年~2030年)
- 中東・アフリカ・ラテンアメリカのデジタルプロダクトパスポート(DPP)の市場規模:国別(2024年~2030年)
- ブラジル
- メキシコ
- 中東
- アフリカ
第11章 主要企業のプロファイル
- Avery Dennison
- Sigma Technology
- OPTEL
- iPoint systems
- Kezzler
- Protokol
- Circularise
- Certilogo
- Neoception
- Minespider
- Narravero
- ID Factory Srl
- DNV
- PSQR
- Temera
- Qliktag
- Piconext
第12章 アナリストの視点/結論
第13章 付録
List of Tables
- Table 1. Global Digital Product Passports (DPP) Market Size Growth Rate by Type (US$ Million): 2024 VS 2030
- Table 2. Key Players of Software
- Table 3. Key Players of Service
- Table 4. Global Digital Product Passports (DPP) Market Size Growth by Application (US$ Million): 2027 VS 2030
- Table 5. Global Digital Product Passports (DPP) Market Size Growth Rate (CAGR) by Region (US$ Million): 2024 VS 2030
- Table 6. Global Digital Product Passports (DPP) Market Size by Region (2024-2030) & (US$ Million)
- Table 7. Global Digital Product Passports (DPP) Market Share by Region (2024-2030)
- Table 8. Digital Product Passports (DPP) Market Trends
- Table 9. Digital Product Passports (DPP) Market Drivers
- Table 10. Digital Product Passports (DPP) Market Challenges
- Table 11. Digital Product Passports (DPP) Market Restraints
- Table 12. Global Digital Product Passports (DPP) Revenue by Players (2024-2030) & (US$ Million)
- Table 13. Global Digital Product Passports (DPP) Market Share by Players (2024-2030)
- Table 14. Global Top Digital Product Passports (DPP) Players by Company Type (Tier 1, Tier 2, and Tier 3) & (based on the Revenue in Digital Product Passports (DPP) as of 2029)
- Table 15. Global Digital Product Passports (DPP) Industry Ranking 2024 VS 2030
- Table 16. Global 5 Largest Players Market Share by Digital Product Passports (DPP) Revenue (CR5) & (2024-2030)
- Table 17. Global Key Players of Digital Product Passports (DPP), Headquarters and Area Served
- Table 18. Global Key Players of Digital Product Passports (DPP), Product and Application
- Table 19. Global Key Players of Digital Product Passports (DPP), Date of Establish Date
- Table 20. Global Digital Product Passports (DPP) Market Size by Type (2024-2030) & (US$ Million)
- Table 21. Global Digital Product Passports (DPP) Revenue Market Share by Type (2024-2030)
- Table 22. Global Digital Product Passports (DPP) Market Size by Application (2024-2030) & (US$ Million)
- Table 23. Global Digital Product Passports (DPP) Revenue Market Share by Application (2024-2030)
- Table 24. North America Digital Product Passports (DPP) Market Size by Type (2024-2030) & (US$ Million)
- Table 25. North America Digital Product Passports (DPP) Market Size by Application (2024-2030) & (US$ Million)
- Table 26. North America Digital Product Passports (DPP) Growth Rate (CAGR) by Country (US$ Million): 2024 VS 2030
- Table 27. North America Digital Product Passports (DPP) Market Size by Country (2024-2030) & (US$ Million)
- Table 28. North America Digital Product Passports (DPP) Market Size by Country (2024-2030) & (US$ Million)
- Table 29. Europe Digital Product Passports (DPP) Market Size by Type (2024-2030) & (US$ Million)
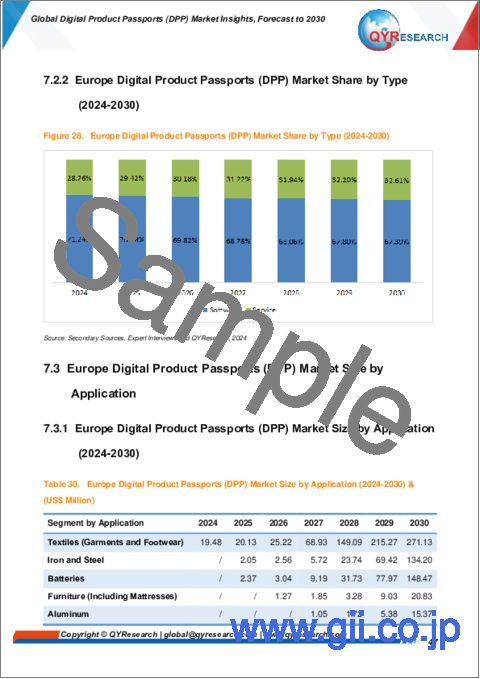
- Table 30. Europe Digital Product Passports (DPP) Market Size by Application (2024-2030) & (US$ Million)
- Table 31. Europe Digital Product Passports (DPP) Growth Rate (CAGR) by Country (US$ Million): 2024 VS 2030
- Table 32. Europe Digital Product Passports (DPP) Market Size by Country (2024-2030) & (US$ Million)
- Table 33. Europe Digital Product Passports (DPP) Market Size by Country (2024-2030) & (US$ Million)
- Table 34. China Digital Product Passports (DPP) Market Size by Type (2024-2030) & (US$ Million)
- Table 35. China Digital Product Passports (DPP) Market Size by Application (2024-2030) & (US$ Million)
- Table 36. Asia Digital Product Passports (DPP) Market Size by Type (2024-2030) & (US$ Million)
- Table 37. Asia Digital Product Passports (DPP) Market Size by Application (2024-2030) & (US$ Million)
- Table 38. Asia Digital Product Passports (DPP) Growth Rate (CAGR) by Region (US$ Million): 2025 VS 2030
- Table 39. Asia Digital Product Passports (DPP) Market Size by Region (2024-2030) & (US$ Million)
- Table 40. Asia Digital Product Passports (DPP) Market Size by Region (2024-2030) & (US$ Million)
- Table 41. Middle East, Africa, and Latin America Digital Product Passports (DPP) Market Size by Type (2024-2030) & (US$ Million)
- Table 42. Middle East, Africa, and Latin America Digital Product Passports (DPP) Market Size by Application (2024-2030) & (US$ Million)
- Table 43. Middle East, Africa, and Latin America Digital Product Passports (DPP) Growth Rate (CAGR) by Country (US$ Million): 2027 VS 2030
- Table 44. Middle East, Africa, and Latin America Digital Product Passports (DPP) Market Size by Country (2024-2030) & (US$ Million)
- Table 45. Middle East, Africa, and Latin America Digital Product Passports (DPP) Market Size by Country (2024-2030) & (US$ Million)
- Table 46. Avery Dennison Company Details
- Table 47. Avery Dennison Business Overview
- Table 48. Avery Dennison Digital Product Passports (DPP) Product
- Table 49. Avery Dennison Revenue in Digital Product Passports (DPP) Business (2024-2030) & (US$ Million)
- Table 50. Avery Dennison Recent Development
- Table 51. Sigma Technology Company Details
- Table 52. Sigma Technology Business Overview
- Table 53. Sigma Technology Digital Product Passports (DPP) Product
- Table 54. Sigma Technology Revenue in Digital Product Passports (DPP) Business (2024-2030) & (US$ Million)
- Table 55. Sigma Technology Recent Development
- Table 56. OPTEL Company Details
- Table 57. OPTEL Business Overview
- Table 58. OPTEL Digital Product Passports (DPP) Product
- Table 59. OPTEL Revenue in Digital Product Passports (DPP) Business (2024-2030) & (US$ Million)
- Table 60. OPTEL Recent Development
- Table 61. iPoint systems Company Details
- Table 62. iPoint systems Business Overview
- Table 63. iPoint systems Digital Product Passports (DPP) Product
- Table 64. iPoint systems Revenue in Digital Product Passports (DPP) Business (2024-2030) & (US$ Million)
- Table 65. Kezzler Company Details
- Table 66. Kezzler Business Overview
- Table 67. Kezzler Digital Product Passports (DPP) Product
- Table 68. Kezzler Revenue in Digital Product Passports (DPP) Business (2024-2030) & (US$ Million)
- Table 69. Kezzler Recent Development
- Table 70. Protokol Company Details
- Table 71. Protokol Business Overview
- Table 72. Protokol Digital Product Passports (DPP) Product
- Table 73. Protokol Revenue in Digital Product Passports (DPP) Business (2024-2030) & (US$ Million)
- Table 74. Circularise Company Details
- Table 75. Circularise Business Overview
- Table 76. Circularise Digital Product Passports (DPP) Product
- Table 77. Circularise Revenue in Digital Product Passports (DPP) Business (2024-2030) & (US$ Million)
- Table 78. Circularise Recent Development
- Table 79. Certilogo Company Details
- Table 80. Certilogo Business Overview
- Table 81. Certilogo Digital Product Passports (DPP) Product
- Table 82. Certilogo Revenue in Digital Product Passports (DPP) Business (2024-2030) & (US$ Million)
- Table 83. Certilogo Recent Development
- Table 84. Neoception Company Details
- Table 85. Neoception Business Overview
- Table 86. Neoception Digital Product Passports (DPP) Product
- Table 87. Neoception Revenue in Digital Product Passports (DPP) Business (2024-2030) & (US$ Million)
- Table 88. Minespider Company Details
- Table 89. Minespider Business Overview
- Table 90. Minespider Digital Product Passports (DPP) Product
- Table 91. Minespider Revenue in Digital Product Passports (DPP) Business (2024-2030) & (US$ Million)
- Table 92. Minespider Recent Development
- Table 93. Narravero Company Details
- Table 94. Narravero Business Overview
- Table 95. Narravero Digital Product Passports (DPP) Product
- Table 96. Narravero Revenue in Digital Product Passports (DPP) Business (2024-2030) & (US$ Million)
- Table 97. ID Factory Srl Company Details
- Table 98. ID Factory Srl Business Overview
- Table 99. ID Factory Srl Digital Product Passports (DPP) Product
- Table 100. ID Factory Srl Revenue in Digital Product Passports (DPP) Business (2024-2030) & (US$ Million)
- Table 101. ID Factory Srl Recent Development
- Table 102. DNV Company Details
- Table 103. DNV Business Overview
- Table 104. DNV Digital Product Passports (DPP) Product
- Table 105. DNV Revenue in Digital Product Passports (DPP) Business (2024-2030) & (US$ Million)
- Table 106. DNV Recent Development
- Table 107. PSQR Company Details
- Table 108. PSQR Business Overview
- Table 109. PSQR Digital Product Passports (DPP) Product
- Table 110. PSQR Revenue in Digital Product Passports (DPP) Business (2024-2030) & (US$ Million)
- Table 111. Temera Company Details
- Table 112. Temera Business Overview
- Table 113. Temera Digital Product Passports (DPP) Product
- Table 114. Temera Revenue in Digital Product Passports (DPP) Business (2024-2030) & (US$ Million)
- Table 115. Temera Recent Development
- Table 116. Qliktag Company Details
- Table 117. Qliktag Business Overview
- Table 118. Qliktag Digital Product Passports (DPP) Product
- Table 119. Qliktag Revenue in Digital Product Passports (DPP) Business (2024-2030) & (US$ Million)
- Table 120. Qliktag Recent Development
- Table 121. Piconext Company Details
- Table 122. Piconext Business Overview
- Table 123. Piconext Digital Product Passports (DPP) Product
- Table 124. Piconext Revenue in Digital Product Passports (DPP) Business (2024-2030) & (US$ Million)
- Table 125. Research Programs/Design for This Report
- Table 126. Key Data Information from Secondary Sources
- Table 127. Key Data Information from Primary Sources
List of Figures
- Figure 1. Global Digital Product Passports (DPP) Market Size Growth Rate by Type, 2024 VS 2030 (US$ Million)
- Figure 2. Global Digital Product Passports (DPP) Market Share by Type: 2024 VS 2030
- Figure 3. Software Features
- Figure 4. Service Features
- Figure 5. Global Digital Product Passports (DPP) Market Size Growth Rate by Application, 2024 VS 2030 (US$ Million)
- Figure 6. Global Digital Product Passports (DPP) Market Share by Application: 2024 VS 2030
- Figure 7. Batteries Case Studies
- Figure 8. Textiles (Garments and Footwear) Case Studies
- Figure 9. Iron and Steel Case Studies
- Figure 10. Electronics Case Studies
- Figure 11. Furniture (Including Mattresses) Case Studies
- Figure 12. Chemicals Case Studies
- Figure 13. Tires Case Studies
- Figure 14. Aluminum Case Studies
- Figure 15. Others Case Studies
- Figure 16. Global Digital Product Passports (DPP) Market Size (US$ Million), Year-over-Year: 2024-2030
- Figure 17. Global Digital Product Passports (DPP) Market Size, (US$ Million), 2024 VS 2030
- Figure 18. Global Digital Product Passports (DPP) Market Share by Region: 2024 VS 2030
- Figure 19. Global Digital Product Passports (DPP) Market Share by Players in 2024
- Figure 20. Global Top Digital Product Passports (DPP) Players by Company Type (Tier 1, Tier 2, and Tier 3) & (based on the Revenue in Digital Product Passports (DPP) as of 2029)
- Figure 21. The Top 10 and 5 Players Market Share by Digital Product Passports (DPP) Revenue in 2024
- Figure 22. North America Digital Product Passports (DPP) Market Size YoY Growth (2024-2030) & (US$ Million)
- Figure 23. North America Digital Product Passports (DPP) Market Share by Type (2024-2030)
- Figure 24. North America Digital Product Passports (DPP) Market Share by Application (2024-2030)
- Figure 25. United States Digital Product Passports (DPP) Market Size YoY Growth (2024-2030) & (US$ Million)
- Figure 26. Canada Digital Product Passports (DPP) Market Size YoY Growth (2024-2030) & (US$ Million)
- Figure 27. Europe Digital Product Passports (DPP) Market Size YoY Growth (2024-2030) & (US$ Million)
- Figure 28. Europe Digital Product Passports (DPP) Market Share by Type (2024-2030)
- Figure 29. Europe Digital Product Passports (DPP) Market Share by Application (2024-2030)
- Figure 30. Germany Digital Product Passports (DPP) Market Size YoY Growth (2024-2030) & (US$ Million)
- Figure 31. France Digital Product Passports (DPP) Market Size YoY Growth (2024-2030) & (US$ Million)
- Figure 32. U.K. Digital Product Passports (DPP) Market Size YoY Growth (2024-2030) & (US$ Million)
- Figure 33. Italy Digital Product Passports (DPP) Market Size YoY Growth (2024-2030) & (US$ Million)
- Figure 34. Spain Digital Product Passports (DPP) Market Size YoY Growth (2024-2030) & (US$ Million)
- Figure 35. China Digital Product Passports (DPP) Market Size YoY Growth (2024-2030) & (US$ Million)
- Figure 36. China Digital Product Passports (DPP) Market Share by Type (2025-2030)
- Figure 37. China Digital Product Passports (DPP) Market Share by Application (2025-2030)
- Figure 38. Asia Digital Product Passports (DPP) Market Size YoY Growth (2024-2030) & (US$ Million)
- Figure 39. Asia Digital Product Passports (DPP) Market Share by Type (2025-2030)
- Figure 40. Asia Digital Product Passports (DPP) Market Share by Application (2025-2030)
- Figure 41. Japan Digital Product Passports (DPP) Market Size YoY Growth (2024-2030) & (US$ Million)
- Figure 42. South Korea Digital Product Passports (DPP) Market Size YoY Growth (2024-2030) & (US$ Million)
- Figure 43. India Digital Product Passports (DPP) Market Size YoY Growth (2024-2030) & (US$ Million)
- Figure 44. Middle East, Africa, and Latin America Digital Product Passports (DPP) Market Size YoY Growth (2024-2030) & (US$ Million)
- Figure 45. Middle East, Africa, and Latin America Digital Product Passports (DPP) Market Share by Type (2027-2030)
- Figure 46. Middle East, Africa, and Latin America Digital Product Passports (DPP) Market Share by Application (2027-2030)
- Figure 47. Brazil Digital Product Passports (DPP) Market Size YoY Growth (2024-2030) & (US$ Million)
- Figure 48. Mexico Digital Product Passports (DPP) Market Size YoY Growth (2024-2030) & (US$ Million)
- Figure 49. Middle East Digital Product Passports (DPP) Market Size YoY Growth (2024-2030) & (US$ Million)
- Figure 50. Africa Digital Product Passports (DPP) Market Size YoY Growth (2024-2030) & (US$ Million)
- Figure 51. Bottom-up and Top-down Approaches for This Report
- Figure 52. Data Triangulation
- Figure 53. Key Executives Interviewed
The global Digital Product Passports (DPP) market is projected to grow from US$ 22.35 million in 2024 to US$ 900.63 million by 2030, at a Compound Annual Growth Rate (CAGR) of 85.16% during the forecast period.
The US & Canada market for Digital Product Passports (DPP) is estimated to increase from $ 2.87 million in 2024 to reach $ 63.70 million by 2030, at a CAGR of 67.64% during the forecast period of 2024 through 2030.
The China market for Digital Product Passports (DPP) is estimated to increase from $ 2.02 million in 2025 to reach $ 128.47 million by 2030, at a CAGR of 129.45% during the forecast period of 2025 through 2030.
The Europe market for Digital Product Passports (DPP) is estimated to increase from $ 19.48 million in 2024 to reach $ 648.57 million by 2030, at a CAGR of 79.36% during the forecast period of 2024 through 2030.
The global key companies of Digital Product Passports (DPP) include Avery Dennison, Sigma Technology, OPTEL, iPoint systems, Kezzler and Protokol, etc. In 2024, the global top five players had a share approximately 42.73% in terms of revenue.
Report Includes
This report presents an overview of global market for Digital Product Passports (DPP) market size. Analyses of the global market trends, estimates for 2024, and projections of CAGR through 2030.
This report researches the key producers of Digital Product Passports (DPP), also provides the revenue of main regions and countries. Highlights of the upcoming market potential for Digital Product Passports (DPP), and key regions/countries of focus to forecast this market into various segments and sub-segments. Country specific data and market value analysis for the U.S., Canada, Mexico, Brazil, China, Japan, South Korea, India, Germany, the U.K., Italy, Middle East, Africa, and Other Countries.
This report focuses on the Digital Product Passports (DPP) revenue, market share and industry ranking of main companies, data from 2024 to 2030. Identification of the major stakeholders in the global Digital Product Passports (DPP) market, and analysis of their competitive landscape and market positioning based on recent developments and segmental revenues. This report will help stakeholders to understand the competitive landscape and gain more insights and position their businesses and market strategies in a better way.
This report analyzes the segments data by Type and by Application, revenue, and growth rate, from 2024 to 2030. Evaluation and forecast the market size for Digital Product Passports (DPP) revenue, projected growth trends, production technology, application and end-user industry.
Descriptive company profiles of the major global players, including Avery Dennison, Sigma Technology, OPTEL, iPoint systems, Kezzler and Protokol, etc.
Market Segmentation
By Company
- Avery Dennison
- Sigma Technology
- OPTEL
- iPoint systems
- Kezzler
- Protokol
- Circularise
- Certilogo
- Neoception
- Minespider
- Narravero
- ID Factory Srl
- DNV
- PSQR
- Temera
- Qliktag
- Piconext
Segment by Type
- Software
- Service
Segment by Application
- Textiles (Garments and Footwear)
- Iron and Steel
- Batteries
- Furniture (Including Mattresses)
- Aluminum
- Tires
- Chemicals
- Electronics
- Others
By Region
- North America
- United States
- Canada
- Asia-Pacific
- China
- Japan
- South Korea
- India
- Rest of Asia
- Europe
- Germany
- France
- U.K.
- Italy
- Spain
- Rest of Europe
- Latin America
- Mexico
- Brazil
- Rest of Latin America
- Middle East & Africa
- Middle East
- Africa
Chapter Outline
Chapter 1: Introduces the report scope of the report, executive summary of different market segments (product type, application, etc), including the market size of each market segment, future development potential, and so on. It offers a high-level view of the current state of the market and its likely evolution in the short to mid-term, and long term.
Chapter 2: Revenue of Digital Product Passports (DPP) in global and regional level. It provides a quantitative analysis of the market size and development potential of each region and its main countries and introduces the market development, future development prospects, market space, and capacity of each country in the world. This section also introduces the market dynamics, latest developments of the market, the driving factors and restrictive factors of the market, the challenges and risks faced by companies in the industry, and the analysis of relevant policies in the industry.
Chapter 3: Detailed analysis of Digital Product Passports (DPP) companies' competitive landscape, revenue, market share and industry ranking, latest development plan, merger, and acquisition information, etc.
Chapter 4: Provides the analysis of various market segments by Type, covering the revenue, and development potential of each market segment, to help readers find the blue ocean market in different market segments.
Chapter 5: Provides the analysis of various market segments by Application, covering the revenue, and development potential of each market segment, to help readers find the blue ocean market in different downstream markets.
Chapter 6: North America (US & Canada) by Type, by Application and by country, revenue for each segment.
Chapter 7: Europe by Type, by Application and by country, revenue for each segment.
Chapter 8: China by Type, and by Application, revenue for each segment.
Chapter 9: Asia (excluding China) by Type, by Application and by region, revenue for each segment.
Chapter 10: Middle East, Africa, and Latin America by Type, by Application and by country, revenue for each segment.
Chapter 11: Provides profiles of key companies, introducing the basic situation of the main companies in the market in detail, including product descriptions and specifications, Digital Product Passports (DPP) revenue, gross margin, and recent development, etc.
Chapter 12: Analyst's Viewpoints/Conclusions
Table of Contents
1 Report Overview
- 1.1 Study Scope
- 1.2 Market Analysis by Type
- 1.2.1 Global Digital Product Passports (DPP) Market Size Growth Rate by Type: 2024 VS 2030
- 1.2.2 Software
- 1.2.3 Service
- 1.3 Market by Application
- 1.3.1 Global Digital Product Passports (DPP) Market Share by Application: 2027 VS 2030
- 1.3.2 Batteries
- 1.3.3 Textiles (Garments and Footwear)
- 1.3.4 Iron and Steel
- 1.3.5 Electronics
- 1.3.6 Furniture (Including Mattresses)
- 1.3.7 Chemicals
- 1.3.8 Tires
- 1.3.9 Aluminum
- 1.3.10 Others
- 1.4 Assumptions and Limitations
- 1.5 Study Objectives
2 Global Growth Trends
- 2.1 Global Digital Product Passports (DPP) Market Perspective (2024-2030)
- 2.2 Global Digital Product Passports (DPP) Growth Trends by Region
- 2.2.1 Global Digital Product Passports (DPP) Market Size by Region: 2024 VS 2030
- 2.2.2 Digital Product Passports (DPP) Market Size by Region (2024-2030)
- 2.3 Digital Product Passports (DPP) Market Dynamics
- 2.3.1 Digital Product Passports (DPP) Industry Trends
- 2.3.2 Digital Product Passports (DPP) Market Drivers
- 2.3.3 Digital Product Passports (DPP) Market Challenges
- 2.3.4 Digital Product Passports (DPP) Market Restraints
3 Competition Landscape by Key Players
- 3.1 Global Revenue Digital Product Passports (DPP) by Players
- 3.1.1 Global Digital Product Passports (DPP) Revenue by Players (2024-2030)
- 3.1.2 Global Digital Product Passports (DPP) Revenue Market Share by Players (2024-2030)
- 3.2 Global Digital Product Passports (DPP) Market Share by Company Type (Tier 1, Tier 2, and Tier 3)
- 3.3 Global Key Players of Digital Product Passports (DPP), Ranking by Revenue, 2024 VS 2030
- 3.4 Global Digital Product Passports (DPP) Market Concentration Ratio
- 3.4.1 Global Digital Product Passports (DPP) Market Concentration Ratio (CR5)
- 3.4.2 Global Top 10 and Top 5 Companies by Digital Product Passports (DPP) Revenue in 2024
- 3.5 Global Key Players of Digital Product Passports (DPP) Head office and Area Served
- 3.6 Global Key Players of Digital Product Passports (DPP), Product and Application
- 3.7 Global Key Players of Digital Product Passports (DPP), Date of Establish Date
4 Digital Product Passports (DPP) Breakdown Data by Type
5 Digital Product Passports (DPP) Breakdown Data by Application
6 North America
- 6.1 North America Digital Product Passports (DPP) Market Size (2024-2030)
- 6.2 North America Digital Product Passports (DPP) Market Size by Type
- 6.2.1 North America Digital Product Passports (DPP) Market Size by Type (2024-2030)
- 6.2.2 North America Digital Product Passports (DPP) Market Share by Type (2024-2030)
- 6.3 North America Digital Product Passports (DPP) Market Size by Application
- 6.3.1 North America Digital Product Passports (DPP) Market Size by Application (2024-2030)
- 6.3.2 North America Digital Product Passports (DPP) Market Share by Application (2024-2030)
- 6.4 North America Digital Product Passports (DPP) Market Size by Country
- 6.4.1 North America Digital Product Passports (DPP) Market Size by Country: 2024 VS 2030
- 6.4.2 North America Digital Product Passports (DPP) Market Size by Country (2024-2030)
- 6.4.3 North America Digital Product Passports (DPP) Market Share by Country (2024-2030)
- 6.4.4 United States
- 6.4.5 Canada
7 Europe
- 7.1 Europe Digital Product Passports (DPP) Market Size (2024-2030)
- 7.2 Europe Digital Product Passports (DPP) Market Size by Type
- 7.2.1 Europe Digital Product Passports (DPP) Market Size by Type (2024-2030)
- 7.2.2 Europe Digital Product Passports (DPP) Market Share by Type (2024-2030)
- 7.3 Europe Digital Product Passports (DPP) Market Size by Application
- 7.3.1 Europe Digital Product Passports (DPP) Market Size by Application (2024-2030)
- 7.3.2 Europe Digital Product Passports (DPP) Market Share by Application (2024-2030)
- 7.4 Europe Digital Product Passports (DPP) Market Size by Country
- 7.4.1 Europe Digital Product Passports (DPP) Market Size by Country: 2024 VS 2030
- 7.4.2 Europe Digital Product Passports (DPP) Market Size by Country (2024-2030)
- 7.4.3 Europe Digital Product Passports (DPP) Market Size by Country (2024-2030)
- 7.4.4 Germany
- 7.4.5 France
- 7.4.6 U.K.
- 7.4.7 Italy
- 7.4.8 Spain
8 China
- 8.1 China Digital Product Passports (DPP) Market Size (2024-2030)
- 8.2 China Digital Product Passports (DPP) Market Size by Type
- 8.2.1 China Digital Product Passports (DPP) Market Size by Type (2024-2030)
- 8.2.2 China Digital Product Passports (DPP) Market Share by Type (2025-2030)
- 8.3 China Digital Product Passports (DPP) Market Size by Application
- 8.3.1 China Digital Product Passports (DPP) Market Size by Application (2024-2030)
- 8.3.2 China Digital Product Passports (DPP) Market Share by Application (2025-2030)
9 Asia (excluding China)
- 9.1 Asia Digital Product Passports (DPP) Market Size (2024-2030)
- 9.2 Asia Digital Product Passports (DPP) Market Size by Type
- 9.2.1 Asia Digital Product Passports (DPP) Market Size by Type (2024-2030)
- 9.2.2 Asia Digital Product Passports (DPP) Market Share by Type (2025-2030)
- 9.3 Asia Digital Product Passports (DPP) Market Size by Application
- 9.3.1 Asia Digital Product Passports (DPP) Market Size by Application (2024-2030)
- 9.3.2 Asia Digital Product Passports (DPP) Market Share by Application (2025-2030)
- 9.4 Asia Digital Product Passports (DPP) Market Size by Region
- 9.4.1 Asia Digital Product Passports (DPP) Market Size by Region: 2025 VS 2030
- 9.4.2 Asia Digital Product Passports (DPP) Market Size by Region (2024-2030)
- 9.4.3 Asia Digital Product Passports (DPP) Market Size by Region (2024-2030)
- 9.4.4 Japan
- 9.4.5 South Korea
- 9.4.6 India
10 Middle East, Africa, and Latin America
- 10.1 Middle East, Africa, and Latin America Digital Product Passports (DPP) Market Size (2024-2030)
- 10.2 Middle East, Africa, and Latin America Digital Product Passports (DPP) Market Size by Type
- 10.2.1 Middle East, Africa, and Latin America Digital Product Passports (DPP) Market Size by Type (2024-2030)
- 10.2.2 Middle East, Africa, and Latin America Digital Product Passports (DPP) Market Share by Type (2027-2030)
- 10.3 Middle East, Africa, and Latin America Digital Product Passports (DPP) Market Size by Application
- 10.3.1 Middle East, Africa, and Latin America Digital Product Passports (DPP) Market Size by Application (2024-2030)
- 10.3.2 Middle East, Africa, and Latin America Digital Product Passports (DPP) Market Share by Application (2027-2030)
- 10.4 Middle East, Africa, and Latin America Digital Product Passports (DPP) Market Size by Country
- 10.4.1 Middle East, Africa, and Latin America Digital Product Passports (DPP) Market Size by Country: 2027 VS 2030
- 10.4.2 Middle East, Africa, and Latin America Digital Product Passports (DPP) Market Size by Country (2024-2030)
- 10.4.3 Middle East, Africa, and Latin America Digital Product Passports (DPP) Market Size by Country (2024-2030)
- 10.4.4 Brazil
- 10.4.5 Mexico
- 10.4.6 Middle East
- 10.4.7 Africa
11 Key Players Profiles
- 11.1 Avery Dennison
- 11.1.1 Avery Dennison Company Details
- 11.1.2 Avery Dennison Business Overview
- 11.1.3 Avery Dennison Digital Product Passports (DPP) Introduction
- 11.1.4 Avery Dennison Revenue in Digital Product Passports (DPP) Business (2024-2030)
- 11.1.5 Avery Dennison Recent Development
- 11.2 Sigma Technology
- 11.2.1 Sigma Technology Company Details
- 11.2.2 Sigma Technology Business Overview
- 11.2.3 Sigma Technology Digital Product Passports (DPP) Introduction
- 11.2.4 Sigma Technology Revenue in Digital Product Passports (DPP) Business (2024-2030)
- 11.2.5 Sigma Technology Recent Development
- 11.3 OPTEL
- 11.3.1 OPTEL Company Details
- 11.3.2 OPTEL Business Overview
- 11.3.3 OPTEL Digital Product Passports (DPP) Introduction
- 11.3.4 OPTEL Revenue in Digital Product Passports (DPP) Business (2024-2030)
- 11.3.5 OPTEL Recent Development
- 11.4 iPoint systems
- 11.4.1 iPoint systems Company Details
- 11.4.2 iPoint systems Business Overview
- 11.4.3 iPoint systems Digital Product Passports (DPP) Introduction
- 11.4.4 iPoint systems Revenue in Digital Product Passports (DPP) Business (2024-2030)
- 11.5 Kezzler
- 11.5.1 Kezzler Company Details
- 11.5.2 Kezzler Business Overview
- 11.5.3 Kezzler Digital Product Passports (DPP) Introduction
- 11.5.4 Kezzler Revenue in Digital Product Passports (DPP) Business (2024-2030)
- 11.5.5 Kezzler Recent Development
- 11.6 Protokol
- 11.6.1 Protokol Company Details
- 11.6.2 Protokol Business Overview
- 11.6.3 Protokol Digital Product Passports (DPP) Introduction
- 11.6.4 Protokol Revenue in Digital Product Passports (DPP) Business (2024-2030)
- 11.7 Circularise
- 11.7.1 Circularise Company Details
- 11.7.2 Circularise Business Overview
- 11.7.3 Circularise Digital Product Passports (DPP) Introduction
- 11.7.4 Circularise Revenue in Digital Product Passports (DPP) Business (2024-2030)
- 11.7.5 Circularise Recent Development
- 11.8 Certilogo
- 11.8.1 Certilogo Company Details
- 11.8.2 Certilogo Business Overview
- 11.8.3 Certilogo Digital Product Passports (DPP) Introduction
- 11.8.4 Certilogo Revenue in Digital Product Passports (DPP) Business (2024-2030)
- 11.8.5 Certilogo Recent Development
- 11.9 Neoception
- 11.9.1 Neoception Company Details
- 11.9.2 Neoception Business Overview
- 11.9.3 Neoception Digital Product Passports (DPP) Introduction
- 11.9.4 Neoception Revenue in Digital Product Passports (DPP) Business (2024-2030)
- 11.10 Minespider
- 11.10.1 Minespider Company Details
- 11.10.2 Minespider Business Overview
- 11.10.3 Minespider Digital Product Passports (DPP) Introduction
- 11.10.4 Minespider Revenue in Digital Product Passports (DPP) Business (2024-2030)
- 11.10.5 Minespider Recent Development
- 11.11 Narravero
- 11.11.1 Narravero Company Details
- 11.11.2 Narravero Business Overview
- 11.11.3 Narravero Digital Product Passports (DPP) Introduction
- 11.11.4 Narravero Revenue in Digital Product Passports (DPP) Business (2024-2030)
- 11.12 ID Factory Srl
- 11.12.1 ID Factory Srl Company Details
- 11.12.2 ID Factory Srl Business Overview
- 11.12.3 ID Factory Srl Digital Product Passports (DPP) Introduction
- 11.12.4 ID Factory Srl Revenue in Digital Product Passports (DPP) Business (2024-2030)
- 11.12.5 ID Factory Srl Recent Development
- 11.13 DNV
- 11.13.1 DNV Company Details
- 11.13.2 DNV Business Overview
- 11.13.3 DNV Digital Product Passports (DPP) Introduction
- 11.13.4 DNV Revenue in Digital Product Passports (DPP) Business (2024-2030)
- 11.13.5 DNV Recent Development
- 11.14 PSQR
- 11.14.1 PSQR Company Details
- 11.14.2 PSQR Business Overview
- 11.14.3 PSQR Digital Product Passports (DPP) Introduction
- 11.14.4 PSQR Revenue in Digital Product Passports (DPP) Business (2024-2030)
- 11.15 Temera
- 11.15.1 Temera Company Details
- 11.15.2 Temera Business Overview
- 11.15.3 Temera Digital Product Passports (DPP) Introduction
- 11.15.4 Temera Revenue in Digital Product Passports (DPP) Business (2024-2030)
- 11.15.5 Temera Recent Development
- 11.16 Qliktag
- 11.16.1 Qliktag Company Details
- 11.16.2 Qliktag Business Overview
- 11.16.3 Qliktag Digital Product Passports (DPP) Introduction
- 11.16.4 Qliktag Revenue in Digital Product Passports (DPP) Business (2024-2030)
- 11.16.5 Qliktag Recent Development
- 11.17 Piconext
- 11.17.1 Piconext Company Details
- 11.17.2 Piconext Business Overview
- 11.17.3 Piconext Digital Product Passports (DPP) Introduction
- 11.17.4 Piconext Revenue in Digital Product Passports (DPP) Business (2024-2030)
12 Analyst's Viewpoints/Conclusions
13 Appendix
- 13.1 Research Methodology
- 13.1.1 Methodology/Research Approach
- 13.1.2 Data Source
- 13.2 Author Details
- 13.3 Disclaimer

